Market Report 2011 GerMany - Europe Real Estate
Market Report 2011 GerMany - Europe Real Estate
Market Report 2011 GerMany - Europe Real Estate

Create successful ePaper yourself
Turn your PDF publications into a flip-book with our unique Google optimized e-Paper software.
Office markets: Most recent developments<br />
and projected trend<br />
A-locations: Recovery in prime locations, stabilisation<br />
in secondary locations<br />
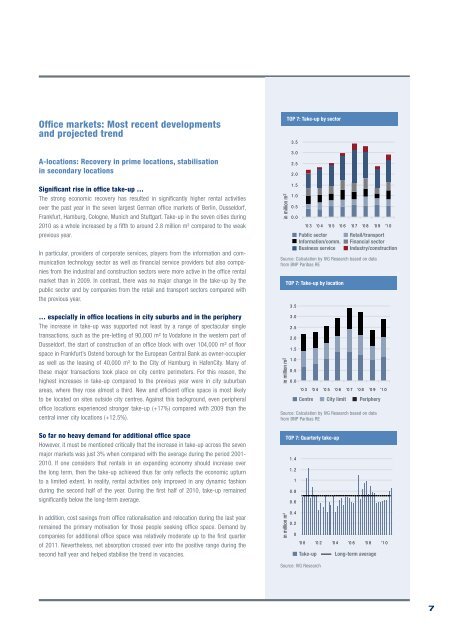
Significant rise in office take-up …<br />
The strong economic recovery has resulted in significantly higher rental activities<br />
over the past year in the seven largest German office markets of Berlin, Dusseldorf,<br />
Frankfurt, Hamburg, Cologne, Munich and Stuttgart. Take-up in the seven cities during<br />
2010 as a whole increased by a fifth to around 2.8 million m² compared to the weak<br />
previous year.<br />
In particular, providers of corporate services, players from the information and communication<br />
technology sector as well as financial service providers but also companies<br />
from the industrial and construction sectors were more active in the office rental<br />
market than in 2009. In contrast, there was no major change in the take-up by the<br />
public sector and by companies from the retail and transport sectors compared with<br />
the previous year.<br />
… especially in office locations in city suburbs and in the periphery<br />
The increase in take-up was supported not least by a range of spectacular single<br />
transactions, such as the pre-letting of 90,000 m² to Vodafone in the western part of<br />
Dusseldorf, the start of construction of an office block with over 104,000 m² of floor<br />
space in Frankfurt’s Ostend borough for the <strong>Europe</strong>an Central Bank as owner-occupier<br />
as well as the leasing of 40,000 m² to the City of Hamburg in HafenCity. Many of<br />
these major transactions took place on city centre perimeters. For this reason, the<br />
highest increases in take-up compared to the previous year were in city suburban<br />
areas, where they rose almost a third. New and efficient office space is most likely<br />
to be located on sites outside city centres. Against this background, even peripheral<br />
office locations experienced stronger take-up (+17%) compared with 2009 than the<br />
central inner city locations (+12.5%).<br />
So far no heavy demand for additional office space<br />
However, it must be mentioned critically that the increase in take-up across the seven<br />
major markets was just 3% when compared with the average during the period 2001-<br />
2010. If one considers that rentals in an expanding economy should increase over<br />
the long term, then the take-up achieved thus far only reflects the economic upturn<br />
to a limited extent. In reality, rental activities only improved in any dynamic fashion<br />
during the second half of the year. During the first half of 2010, take-up remained<br />
significantly below the long-term average.<br />
In addition, cost savings from office rationalisation and relocation during the last year<br />
remained the primary motivation for those people seeking office space. Demand by<br />
companies for additional office space was relatively moderate up to the first quarter<br />
of <strong>2011</strong>. Nevertheless, net absorption crossed over into the positive range during the<br />
second half year and helped stabilise the trend in vacancies.<br />
in million m 2<br />
TOP 7: Take-up by sector<br />
3.5<br />
3.0<br />
2.5<br />
2.0<br />
1.5<br />
1.0<br />
0.5<br />
0.0<br />
'0 3 '04 '0 5 '06 '0 7 '08 '0 9 '10<br />
Public sector<br />
Information/comm.<br />
Business service<br />
Retail/transport<br />
Financial sector<br />
Industry/construction<br />
Source: Calculation by IVG Research based on data<br />
from BNP Paribas RE<br />
in million m 2<br />
TOP 7: Take-up by location<br />
3.5<br />
3.0<br />
2.5<br />
2.0<br />
1.5<br />
1.0<br />
0.5<br />
0.0<br />
'0 3 '04 '0 5 '06 '0 7 '08 '0 9 '10<br />
Centre City limit Periphery<br />
Source: Calculation by IVG Research based on data<br />
from BNP Paribas RE<br />
in million m 2<br />
TOP 7: Quarterly take-up<br />
1.4<br />
1.2<br />
1<br />
0.8<br />
0.6<br />
0.4<br />
0.2<br />
0<br />
'0 0 '02 '0 4 '06 '0 8 '10<br />
Take-up Long-term average<br />
Source: IVG Research<br />
7