General National Spatial Plan / Shqipëria 2030
The General National Spatial Plan (GNSP) provides the strategic reference framework for sustainable territorial development for the next 15 years, in order to ensure balanced economic and social national development, responsible management of natural resources, environmental protection, all while ensuring the rational land use. The GNSP is introduced not only as fulfillment of a legal obligation, but also as a prerequisite to achieving the governmental program objectives to enhance citizens’ welfare and national economic growth by reducing inequalities, strengthening the strategic partnership with neighboring countries and implementation of policies that foster competitiveness of economic sectors, thus ensuring integration in the European Union.
The General National Spatial Plan (GNSP) provides the strategic reference framework for sustainable territorial development for the next 15 years, in order to ensure balanced economic and social national development, responsible management of natural resources, environmental protection, all while ensuring the rational land use. The GNSP is introduced not only as fulfillment of a legal obligation, but also as a prerequisite to achieving the governmental program objectives to enhance citizens’ welfare and national economic growth by reducing inequalities, strengthening the strategic partnership with neighboring countries and implementation of policies that foster competitiveness of economic sectors, thus ensuring integration in the European Union.

You also want an ePaper? Increase the reach of your titles
YUMPU automatically turns print PDFs into web optimized ePapers that Google loves.
20.0%<br />
15.0%<br />
10.0%<br />
30.0% 5.0%<br />
25.0% 0.0%<br />
20.0%<br />
15.0%<br />
10.0%<br />
5.0%<br />
24.<br />
24.5%<br />
8.1%<br />
8.1%<br />
21.9%<br />
2000<br />
21.9%<br />
22.4%<br />
22.4%<br />
11.3%<br />
Agriculture<br />
Forests<br />
Fishing<br />
11.3%<br />
18.8%<br />
18.8%<br />
9.7%<br />
9.7%<br />
16.9%<br />
16.9%<br />
26.6%<br />
15.3%<br />
15.3%<br />
18.0%<br />
18.0%<br />
12.0%<br />
12.0%<br />
16.5%<br />
16.5%<br />
27.5%<br />
12.9%<br />
12.9%<br />
19.5%<br />
19.5%<br />
12.8%<br />
2005 2010 2015<br />
Trade<br />
Transport<br />
Accomodation<br />
Construction<br />
Industry<br />
Other<br />
services<br />
12.8%<br />
15.8%<br />
15.8%<br />
29.9%<br />
10.3%<br />
10.3%<br />
0.0%<br />
2000<br />
2005 2010 2015<br />
Agriculture<br />
Forests<br />
Fishing<br />
Trade<br />
Transport<br />
Accomodation<br />
Construction<br />
Industry<br />
Other<br />
services<br />
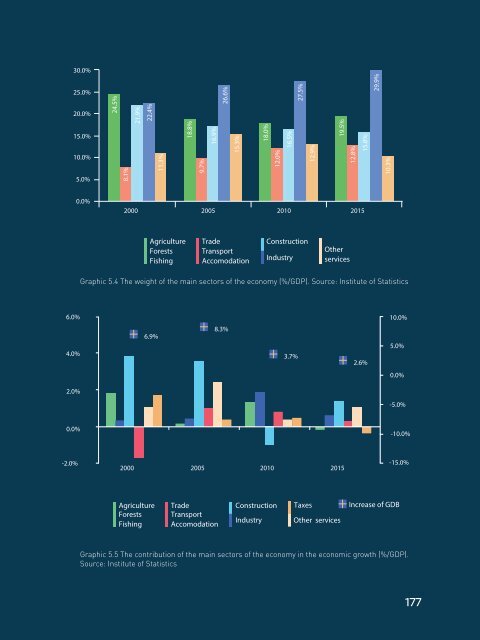
Graphic 5.4 The weight of the main sectors of the economy (%/GDP). Source: Institute of Statistics<br />
6.0%<br />
10.0%<br />
4.0%<br />
6.9%<br />
8.3%<br />
3.7%<br />
2.6%<br />
5.0%<br />
0.0%<br />
2.0%<br />
-5.0%<br />
0.0% 6.0%<br />
-2.0% 4.0%<br />
2000<br />
6.9%<br />
8.3%<br />
2005 2010 3.7%<br />
2015<br />
2.6%<br />
10.0%<br />
-10.0%<br />
5.0%<br />
-15.0%<br />
0.0%<br />
2.0%<br />
Agriculture<br />
Forests<br />
Fishing<br />
Trade<br />
Transport<br />
Accomodation<br />
Construction<br />
Industry<br />
Taxes<br />
Other services<br />
Increase of GDB<br />
-5.0%<br />
0.0%<br />
-10.0%<br />
Graphic 5.5 The contribution of the main sectors of the economy in the economic growth (%/GDP).<br />
Source: Institute of Statistics<br />
-2.0%<br />
-15.0%<br />
2000<br />
2005 2010 2015<br />
Agriculture<br />
Forests<br />
Fishing<br />
Trade<br />
Transport<br />
Accomodation<br />
Construction<br />
Industry<br />
Taxes<br />
Other services<br />
Increase of GDB<br />
177