ETX-10829_Etex-AR2017_WEB_2018_DEF2 (2)

You also want an ePaper? Increase the reach of your titles
YUMPU automatically turns print PDFs into web optimized ePapers that Google loves.
<br />
Key figures<br />
<strong>Etex</strong> Annual Report 2017<br />
<br />
Key figures<br />
Key figures<br />
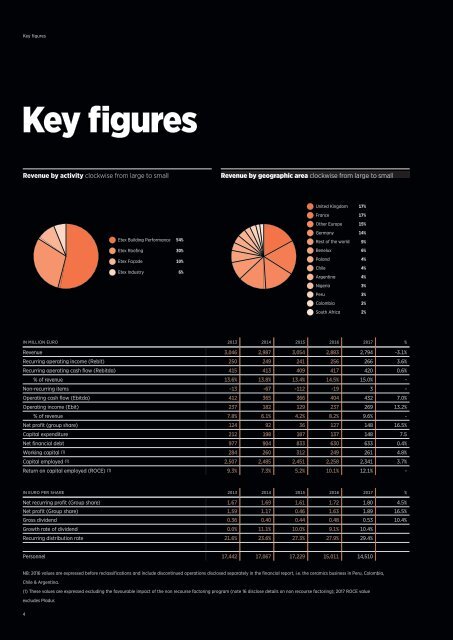
Revenue by activity clockwise from large to small<br />
Revenue by geographic area clockwise from large to small<br />
Revenue in billion euro 2.794<br />
Recurring operating cash flow in million euro 420<br />
United Kingdom 17%<br />
France<br />
Other Europe<br />
Germany<br />
17%<br />
15%<br />
14%<br />
2013<br />
2014<br />
3.046<br />
2.987<br />
<strong>Etex</strong> Building Performance 54%<br />
Rest of the world 9%<br />
2015<br />
3.054<br />
<strong>Etex</strong> Roofing<br />
30%<br />
Benelux 6%<br />
2016<br />
2.883<br />
<strong>Etex</strong> Façade<br />
10%<br />
Poland 4%<br />
<strong>Etex</strong> Industry 6%<br />
Chile 4%<br />
2017<br />
2.794<br />
Argentina 4%<br />
Nigeria 3%<br />
Peru 3%<br />
Colombia 2%<br />
South Africa 2%<br />
2013 415<br />
2014<br />
413<br />
2015<br />
409<br />
2016<br />
417<br />
2017<br />
420<br />
Personnel evolution 14,510<br />
Recurring operating income in million euro 266<br />
IN MILLION EURO 2013 2014 2015 2016 2017 %<br />
Revenue 3,046 2,987 3,054 2,883 2,794 -3.1%<br />
Recurring operating income (Rebit) 250 249 241 256 266 3.6%<br />
Recurring operating cash flow (Rebitda) 415 413 409 417 420 0.6%<br />
2013<br />
17,442<br />
2013<br />
250<br />
% of revenue 13.6% 13.8% 13.4% 14.5% 15.0% -<br />
Non-recurring items -13 -67 -112 -19 3 -<br />
Operating cash flow (Ebitda) 412 365 366 404 432 7.0%<br />
2014<br />
2015<br />
17,067<br />
17,229<br />
2014<br />
2015<br />
249<br />
241<br />
Operating income (Ebit) 237 182 129 237 269 13.2%<br />
% of revenue 7.8% 6.1% 4.2% 8.2% 9.6% -<br />
2016<br />
15,011<br />
2016<br />
256<br />
Net profit (group share) 124 92 36 127 148 16.5%<br />
Capital expenditure 212 198 187 137 148 7.5<br />
2017<br />
14,510<br />
2017<br />
266<br />
Net financial debt 977 904 833 630 633 0.4%<br />
Working capital (1) 284 260 312 249 261 4.8%<br />
Capital employed (1) 2,507 2,485 2,451 2,258 2,341 3.7%<br />
Return on capital employed (ROCE) (1) 9.3% 7.3% 5.2% 10.1% 12.1% -<br />
IN EURO PER SHARE 2013 2014 2015 2016 2017 %<br />
Number of accidents 79<br />
Gravity rate 0.15<br />
Net recurring profit (Group share) 1.67 1.69 1.61 1.72 1.80 4.5%<br />
Net profit (Group share) 1.59 1.17 0.46 1.63 1.89 16.5%<br />
Gross dividend 0.36 0.40 0.44 0.48 0.53 10.4%<br />
Growth rate of dividend 0.0% 11.1% 10.0% 9.1% 10.4%<br />
2013<br />
133<br />
2013<br />
0.16<br />
Recurring distribution rate 21.6% 23.6% 27.3% 27.9% 29.4%<br />
2014<br />
116<br />
2014<br />
0.17<br />
Personnel 17,442 17,067 17,229 15,011 14,510<br />
2015<br />
105<br />
2015<br />
0.15<br />
NB: 2016 values are expressed before reclassifications and include discontinued operations disclosed separately in the financial report, i.e. the ceramics business in Peru, Colombia,<br />
2016<br />
65<br />
2016<br />
0.31<br />
Chile & Argentina.<br />
(1) These values are expressed excluding the favourable impact of the non recourse factoring program (note 16 disclose details on non recourse factoring); 2017 ROCE value<br />
2017<br />
79<br />
2017<br />
0.15<br />
excludes Pladur.<br />
4<br />
5