

TN2018504

Create successful ePaper yourself
Turn your PDF publications into a flip-book with our unique Google optimized e-Paper software.
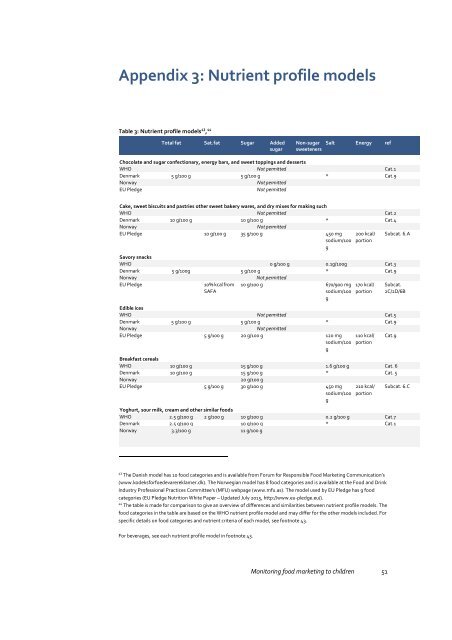
Appendix 3: Nutrient profile models<br />
Table 3: Nutrient profile models 43 , 44<br />
Total fat Sat.fat Sugar Added<br />
sugar<br />
Non-sugar<br />
sweeteners<br />
Salt Energy ref<br />
Chocolate and sugar confectionary, energy bars, and sweet toppings and desserts<br />
WHO Not permitted Cat.1<br />
Denmark 5 g/100 g 5 g/100 g * Cat.9<br />
Norway<br />
Not permitted<br />
EU Pledge<br />
Not permitted<br />
Cake, sweet biscuits and pastries other sweet bakery wares, and dry mixes for making such<br />
WHO Not permitted Cat.2<br />
Denmark 10 g/100 g 10 g/100 g * Cat.4<br />
Norway<br />
Not permitted<br />
EU Pledge 10 g/100 g 35 g/100 g 450 mg<br />
sodium/100<br />
g<br />
200 kcal/<br />
portion<br />
Subcat. 6.A<br />
Savory snacks<br />
WHO 0 g/100 g 0.1g/100g Cat.3<br />
Denmark 5 g/100g 5 g/100 g * Cat.9<br />
Norway<br />
Not permitted<br />
EU Pledge<br />
10% kcal from<br />
SAFA<br />
10 g/100 g 670/900 mg<br />
sodium/100<br />
g<br />
170 kcal/<br />
portion<br />
Subcat.<br />
2C/2D/6B<br />
Edible ices<br />
WHO Not permitted Cat.5<br />
Denmark 5 g/100 g 5 g/100 g * Cat.9<br />
Norway<br />
Not permitted<br />
EU Pledge 5 g/100 g 20 g/100 g 120 mg<br />
sodium/100<br />
g<br />
110 kcal/<br />
portion<br />
Breakfast cereals<br />
WHO 10 g/100 g 15 g/100 g 1.6 g/100 g Cat. 6<br />
Denmark 10 g/100 g 15 g/100 g * Cat. 5<br />
Norway<br />
20 g/100 g<br />
EU Pledge 5 g/100 g 30 g/100 g 450 mg<br />
sodium/100<br />
g<br />
210 kcal/<br />
portion<br />
Yoghurt, sour milk, cream and other similar foods<br />
WHO 2.5 g/100 g 2 g/100 g 10 g/100 g 0.2 g/100 g Cat.7<br />
Denmark 2.5 g/100 g 10 g/100 g * Cat.1<br />
Norway 3.3/100 g 11 g/100 g<br />
Cat.9<br />
Subcat. 6.C<br />
43 The Danish model has 10 food categories and is available from Forum for Responsible Food Marketing Communication’s<br />
(www.kodeksforfoedevarereklamer.dk). The Norwegian model has 8 food categories and is available at the Food and Drink<br />
Industry Professional Practices Committee’s (MFU) webpage (www.mfu.as). The model used by EU Pledge has 9 food<br />
categories (EU Pledge Nutrition White Paper – Updated July 2015, http://www.eu-pledge.eu/).<br />
44 The table is made for comparison to give an overview of differences and similarities between nutrient profile models. The<br />
food categories in the table are based on the WHO nutrient profile model and may differ for the other models included. For<br />
specific details on food categories and nutrient criteria of each model, see footnote 43.<br />
For beverages, see each nutrient profile model in footnote 43.<br />
Monitoring food marketing to children 51