Sun-Earth-Man - PlasmaResources
Sun-Earth-Man - PlasmaResources
Sun-Earth-Man - PlasmaResources

Create successful ePaper yourself
Turn your PDF publications into a flip-book with our unique Google optimized e-Paper software.
a SUN-EARTH-MAN: A MESH OF COSMIC OSCILLATIONS VII. PLANETARY FORCINGAND FLARE CYCLES 5 1<br />
that deal with relations of tidal planets with flare^.^ This is difficult to<br />
understand, as it is known from Skylab observations that flares are set off by<br />
initial disruptions in hot coronal loops over active regions. It is easier to<br />
imagine that weak tidal disturbances may trigger such events in an unstable<br />
zone of the <strong>Sun</strong>'s atmosphere than to concede that the tide-generating forces<br />
could act on the strong magnetic fields that are contained in sunspots.<br />
Calculations of the relative tidal forces of the planets Mercury to Saturn show<br />
that the latter is as negligible as that of Mars. Comparison of the composed<br />
vector of the tidal forces of Venus, <strong>Earth</strong>, and Jupiter, excluding or including , :<br />
Mercury, shows that the vector including Mercury oscillates around the vector<br />
of Venus, <strong>Earth</strong>, and Jupiter. Therefore, only the latter was investigated in its<br />
relation to energetic flares marked by X-ray bursts equal to or greater than class<br />
X2 (2x2). Figure 21 presents the result. Unexpectedly, no cardinal correlations<br />
with the magnitude of the vector emerged. But the change in direction proved<br />
to be crucial. The angular acceleration dwldt = dZqidt2 of the vector forms a cyclic<br />
pattern which shows a strong relation with X-ray bursts observed since 1970.<br />
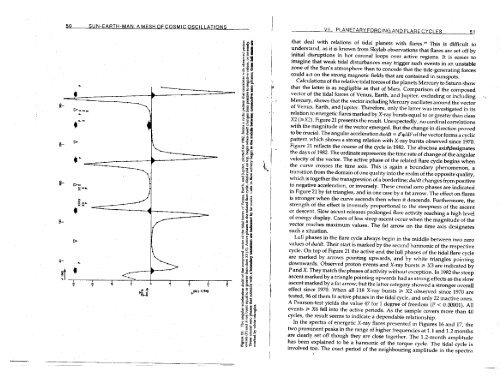
Figure 21 reflects the course of the cycle in 1982. The abscissa axiNesignates<br />
the days of 1982. The ordinate represents the time rate of change of the angular<br />
velocity of the vector. The active phase of the related flare cycle begins when<br />
the curve crosses the time axis. This is again a boundary phenomenon, a<br />
transition from the domain of one quality into the realm of the opposite quality,<br />
which is together the transgression of a borderline; dwidt changes frpm positive<br />
to negative acceleration, or inversely. These crucial zero phases are indicated<br />
in Figure 21 by fat triangles, and in one case by a fat arrow. The effect on flares<br />
is stronger when the curve ascends then when it descends. Furthermore, the<br />
strength of the effect is inversely proportional to the steepness of the ascent<br />
or descent. Slow ascent releases prolonged flare activity reaching a high level<br />
of energy display. Cases of less steep ascent occur when the magnitude of the<br />
vector reaches maximum values. The fat arrow on the time axis designates<br />
such a situation.<br />
LuIl phases in the flare cycle always begin in the middle between two zero<br />
values of dwldf. Their start is marked by the second harmonic of the respective<br />
cycle. On top of Figure 21 the active and the lull phases of the tidal flare cycle<br />
are marked by arrows pointing upwards, and by white triangles pointing<br />
downwards. Observed proton events and X-ray bursts B X3 are indicated by<br />
Pand X. They match the phases of activity without exception. In 1982 the steep<br />
ascent marked by a triangle pointing upwards had as strong effects as the slow<br />
ascent marked by a fat arrow; but the latter category showed a stronger overall<br />
effect since 1970. When all 118 X-ray bursts 3 X2 observed since 1970 are<br />
tested, 96 of them fit active phases in the tidal cycle, and onIy 22 inactive ones.<br />
A Fearson-test yields the value 47 for 1 degree of freedom (P < 0.00002). AII<br />
events 3 X6 fell into the active periods. As the sample covers more than 40<br />
cycIes, the result seems to indicate a dependable relationship.<br />
In the spectra of energetic X-ray flaris presented in ~igures 16 and 17, the<br />
two prominent peaks in the range of higher frequencies at 1.1 and 1.2 months<br />
are clearly set off though they are close together. The 1.2-month amplitude<br />
has been explained to be a harmonic of the torque cycle. The tidal cycle is<br />
involved too. The exact period of the neighbouring amplitude in the spectra