Sun-Earth-Man - PlasmaResources
Sun-Earth-Man - PlasmaResources
Sun-Earth-Man - PlasmaResources

Create successful ePaper yourself
Turn your PDF publications into a flip-book with our unique Google optimized e-Paper software.
76 SUN-EARTH-MAN: A MESH OFCOSMIC OSCILLATIONS<br />
Figure 32 explains why in 1982 the adive phases in the dwidt cycles displayed<br />
emphons of such high intens~ty. Contrary to former years, zero phases and<br />
extrema of the curve of the angular acceleration of the composed vector of che<br />
tidal forces of Venus, <strong>Earth</strong>, and Jup~ter formed just in 1982 a wealth of<br />
consonant intervals of musical harmony. Vertical flat triangles in Figure 32<br />
indicate the limits of the respective intervals. At the top two fifths (2 : 3) are<br />
formed by the positive extrema in the curve In the middle, around the hme<br />
axis, the zero phases appear just at :uch distances that they represent a fou~+h<br />
(3 : 4), a major third (4 : 5), and a minor third (5 : 6). Eventually, three of the<br />
I four negative extrema form a minor sixth (5 : 8). Such connection of an<br />
accumulation of consonant intervals and strong solar activity is a common<br />
feature. Only when the 11-year sunspot cycle is in its deepest valley, IS there<br />
no effect because of the lack of an energy potentialthat could be tapped<br />
Figure 33 repeats the former presentation of thk prototypal pattern of a<br />
composite wave formed by the superimposition of the fourth, fifth, and sixth<br />
harmonics of JU-CM-CS cycles of any length. The positive phases coincide<br />
with clusters of solar cosmic ray events (P), observed from 1942 to 1969, and<br />
flare-generated X-ray bursts 3 X4, indicated by arrow heads, registered from<br />
1970 through 1987. It has been stressed in the explanation of Figure 26 that the<br />
ratio 4 : 5 : 6 of the composed harmonics is representative of the major perfect<br />
chord. Figure 33 shows m addition that the centroids of clusters of highly<br />
energetic events mark intervals of the major sixth (3 : 5) rather precisely. This<br />
is indicated by vertical flat triangles and large numbers on top of the plot.<br />
Furthermore, the octave (1 : 2) and the major third (4 : 5) form substructuce~<br />
that are indicated on the right of Figure 33 by small numbers between the arrow<br />
heads. As the prototypal pattern in Figure 33 presents a synopsis of the most<br />
energetic category of solar eruptions recorded for the past 45 years, it<br />
corroborates the hypothesis that consonant intervals play an important role<br />
with respect to the <strong>Sun</strong>'s eruptional activity.<br />
'<br />
XV. WARMONICAL CONSONANCES IN SOLAR CYCLES COVERlNG<br />
THOUSANDS OF YEARS<br />
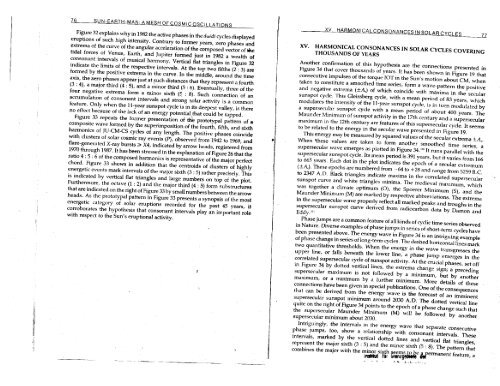
Another confirmation of this hypothesis are the connections presented in<br />
Figure 34 that cover thousands of years. It has been shown in Figure 19 that<br />
consecutive impulses of the torque IOT in the <strong>Sun</strong>'s motion about CM, when<br />
taken to constitute a smoothed time series, form a wave-pattern the posit~ve<br />
and negative extrema (?A3 of which coincide with maxima in the secular<br />
sunspot cycle This Gleissberg cycle, with a mean period of 83 years, which<br />
modulates the intensity of the 11-year sunspot cycle, is in turn modulated by<br />
a supersecular sunspot cycle with a mean period of about 400 years. The<br />
Maunder Minimum of sunspot activity in the 17th century and a supersecular<br />
maximum in the 12th century are features of this supersecular cycle. It seems<br />
to be related to the energy in the secular wave presented in ~ i~kre 19.<br />
This energy may be measured by squared values of the secuIar extrema &A,.<br />
When 'these values are taken to form another smoothed time series, a<br />
supersecular wave emerges as plotted in Figure 34."' it runs parallel with the<br />
supersecular sunspot cycle. Its mean period is 391 years, but it varies from 166<br />
to665 years. Each dot in the plot indicates the epoch of a secular extremum<br />
(&A,). These epochs are numbered from -64 to +28 and range from 5259 B.C.<br />
to 2347 A.D. Black triangles indicate maxima in the correlated supersecular<br />
sunspot curve and white triangles minima. The medieval maximum, which<br />
was together a climate optimum (O), the Spoerer Minimum (S), and the<br />
Maunder Minimum (M) are marked by respective abbreviations. The extrema<br />
in the supersecular wave properly reflect all marked peaks and troughs in the<br />
supersecular sunspot curve derived from radiocarbon data by amo on and<br />
Eddy."'<br />
Phase jumps are a common feature of all kinds of cyclic time series observed<br />
in Nature. Diverse examples of phase jumps in series of short-term cycles have<br />
been presented above. The energy wave in Figure 34 is an intriguing example<br />
of phase changein series of long-term cycles. The dashed horizontaI lines mark<br />
two quantitative thresholds. When the energy in the wave transgresses the<br />
upper line, or falls beneath the lower line, a phase jump emerges in the<br />
correlated supersecular cycle of sunspot activ~t~.-At the cruhal set off<br />
in Figure 34 by dotted vertical lines, the extrema change sign; a preceding<br />
supersecular maximum is not followed by a minimum, but by another<br />
maxlmum, or a minimum by a further miaimurn. More details of these<br />
connechons have been given in special pubhcations. One of the consequences<br />
that can be derived from the energy wave is the forecast of an imminent<br />
supersecular sunspot minimum around 2030 A.D. The dotted vertical fine<br />
quite on the r~ght of Figure 34 points to the epoch of a phase change such that<br />
the supersecular Maunder Minimum (M) will be followed by another<br />
supersecular minimum about 2030.<br />
Intriguingly, the intervals in the energy wave that separate consecutive<br />
phase jumps, too, show a relationship with consonant intervals, These<br />
intervals, marked by the vertical dotted lines and vertical flat trian~les,<br />
represent the maior sixth (3 : 5) and the minor sixth 15 : 8). The aattern