Sun-Earth-Man - PlasmaResources
Sun-Earth-Man - PlasmaResources
Sun-Earth-Man - PlasmaResources

You also want an ePaper? Increase the reach of your titles
YUMPU automatically turns print PDFs into web optimized ePapers that Google loves.
66<br />
SUN-EARTH-MAN: A MESH OF COSMIC OSCILLATIONS<br />
Figure 29 presents the deviation of annual mean values from the 50- year<br />
mean of 337 Dobson units. A change of about 17 Dobson units corresponds to<br />
a 5% change in ozone concentration. The epochs of JU-CM-CS constellations<br />
are marked by flat triangles. As to the events 1967.8 and 1970, which are ody<br />
separated by an interval of 2.2 years, the mean of both epochs is indicated. It<br />
is together the epoch of the major solar instability event that started in 1968.<br />
The JU-CM-CS epochs, which are related to periods of energetic flare activity,<br />
also fit the strongest ozone deviations, as can be seen in Figure 29. In addition,<br />
the phases n/2 and T radians (90" and 18W), that were conspicuous in the <strong>Sun</strong>'s<br />
rotation data, concur with secondary peaks. Small arrow heads point to these<br />
phases. After the instability event starting in 1968 the pattern seems to have<br />
changed. The epoch of JU-CM-CS in 1974 coincided with a minimum. If the<br />
new pattern proves to be stable, the next minimum is to be expected in 1990.<br />
I<br />
r<br />
I<br />
*<br />
XII. COSMIC INFLUENCE ON WEATHER 6 7<br />
MI. COSMIC INFLUENCE ON WEATHER<br />
There has been a lot of controversy over whether or not the <strong>Sun</strong>'s activity<br />
influences weather on <strong>Earth</strong> Simple relationsh~ps discovered in the 1870's and<br />
1880's vanished when exarn~ned more critically, or faded in the light of longer<br />
records. A classical example is a marked correlation between the 11-year<br />
sunspot cycle and the water level in Lake Victoria that seemed to imply a direct<br />
connection between solar activity and rainfall in Africa. After the middle<br />
192Ws, however, the pattern that included two sur~spot cycles vanished and<br />
did not appear again. In add~tion, such ephemeral relationships were limited<br />
to speclal regions and did not cover larger areas subjected to the same or a<br />
similar climate. These d~scussions will perhaps enter a new stage now. The<br />
following results cover more than a century and Iarge parts of the Northern<br />
Hemisphere in a consistent way.<br />
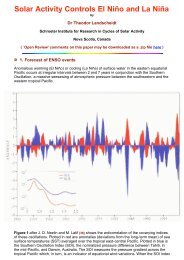
Figure 30 provides evidence of a strong connection of rainfall over central<br />
Europe with JU-CM-CS epochs. The investigation is based on the mean of<br />
yearly rainfa11 totals in mrn derived from observations of 14 German stations<br />
by Baur." This homogeneous time series, supplemented by data from<br />
"Berliner Wetterkarte", published by the Meteorological Institute of the Free<br />
University of Berlin, covers the period 1851 to 1983. The 2-year running<br />
variance s1 of these data was subjected to a Gaussian low-pass filter. Peaks in<br />
the plot point to a strong contrast in the rainfall of consecutive years. Very wet<br />
years are followed by very dry years or very dry years by very wet years,<br />
whereas minima go along with little contrast in this respect. The x-axis<br />
indicates the years of observation and the y-axis the smoothed variance v =<br />
s'. It is obvious that the epochs of JU-CM-CS events marked by pointers show<br />
a good correlation with peaks in the plot, whereas minima, designated by open<br />
circles, coincide with phases .rr radians (180") in the middle between two<br />
epochs that also can be looked at as second harmonics of cycles of consecutive<br />
JU-CM-CS events. Only at the secular minimum in sunspot activity around<br />
1900 the respective maxima are quite weak or even disappear.<br />
This correlation is corroborated by a statistical analysis of the unsmoothed<br />
2-year running variance of the German rainfall data presented irr Figure 31.<br />
The JU-CM-CS epochs are marked by flat triangles and the phases .rr radians<br />
(180"), the second harmonics, by open circles. The analysis evaluates the<br />
significance of the difference between rneans,of the running variance of two<br />
groups: Group 1 composed of the variance of years coinciding with JU-CM-CS<br />
epochs and of the respective preceding year and following year; Group 2<br />
comprising the variance of the years that concur with phases T radians (180")<br />
and the respective preceding year and following year. The rainfall distribution<br />
is Gaussian and free from Markov type persistence. Daily or monthly data<br />
show some persistence patterns. These were eliminated, however, by the<br />
formation of yearly means. Thus, the t-test may be applied. The Fisher-<br />
Behrens formula, described in the gIossary, is to be used, as the variance iq:,<br />
the test groups shows a significant difference. V<br />
Group 1 yielded: number of data points n, = 46; mean f, = 13.46; standard<br />
deviation s, = 15.25. The corresponding values in Group 2 are: n, = 48, 2, =