Fertigation: Optimizing the Utilization of Water and Nutrients - SSWM
Fertigation: Optimizing the Utilization of Water and Nutrients - SSWM
Fertigation: Optimizing the Utilization of Water and Nutrients - SSWM

You also want an ePaper? Increase the reach of your titles
YUMPU automatically turns print PDFs into web optimized ePapers that Google loves.
grain. Therefore, it is likely that at least 5% <strong>of</strong> global grain production could be<br />
used for bi<strong>of</strong>uel <strong>and</strong> bio-‐based industrial feedstock production by 2025.<br />
If we take into account <strong>the</strong> increased use <strong>of</strong> grain for bi<strong>of</strong>uels <strong>and</strong> bio-‐based<br />
products, <strong>and</strong> a small annual decrease <strong>of</strong> 0.1% in <strong>the</strong> area dedicated to growing<br />
<strong>the</strong> major cereals, we obtain a very different scenario for <strong>the</strong> food dem<strong>and</strong>-‐<br />
supply balance. Under this scenario, global dem<strong>and</strong> for maize, rice, <strong>and</strong> wheat<br />
will increase by 1.46% annually, compared with <strong>the</strong> required rate <strong>of</strong> yield<br />
increase <strong>of</strong> 1.56% per annum (Table 1).<br />
Yield trends<br />
Yields <strong>of</strong> <strong>the</strong> major cereals have been increasing steadily, but unlike <strong>the</strong><br />
projected dem<strong>and</strong>, which is predicted to increase at an exponential rate <strong>of</strong><br />
increase <strong>of</strong> 1.29% annually, according to <strong>the</strong> baseline scenario <strong>of</strong> <strong>the</strong> IMPACT<br />
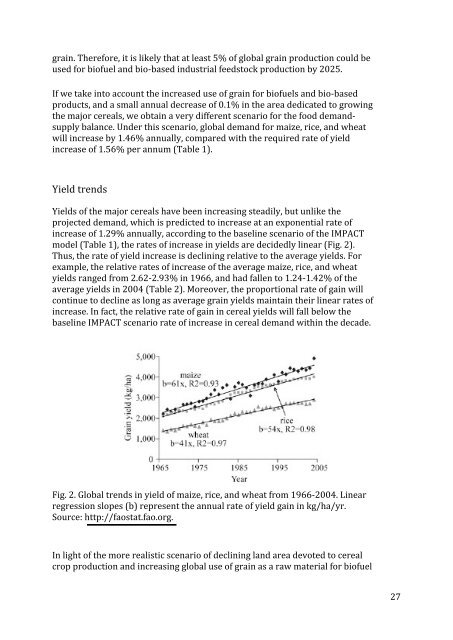
model (Table 1), <strong>the</strong> rates <strong>of</strong> increase in yields are decidedly linear (Fig. 2).<br />
Thus, <strong>the</strong> rate <strong>of</strong> yield increase is declining relative to <strong>the</strong> average yields. For<br />
example, <strong>the</strong> relative rates <strong>of</strong> increase <strong>of</strong> <strong>the</strong> average maize, rice, <strong>and</strong> wheat<br />
yields ranged from 2.62-‐2.93% in 1966, <strong>and</strong> had fallen to 1.24-‐1.42% <strong>of</strong> <strong>the</strong><br />
average yields in 2004 (Table 2). Moreover, <strong>the</strong> proportional rate <strong>of</strong> gain will<br />
continue to decline as long as average grain yields maintain <strong>the</strong>ir linear rates <strong>of</strong><br />
increase. In fact, <strong>the</strong> relative rate <strong>of</strong> gain in cereal yields will fall below <strong>the</strong><br />
baseline IMPACT scenario rate <strong>of</strong> increase in cereal dem<strong>and</strong> within <strong>the</strong> decade.<br />
Fig. 2. Global trends in yield <strong>of</strong> maize, rice, <strong>and</strong> wheat from 1966-‐2004. Linear<br />
regression slopes (b) represent <strong>the</strong> annual rate <strong>of</strong> yield gain in kg/ha/yr.<br />
Source: http://faostat.fao.org.<br />
In light <strong>of</strong> <strong>the</strong> more realistic scenario <strong>of</strong> declining l<strong>and</strong> area devoted to cereal<br />
crop production <strong>and</strong> increasing global use <strong>of</strong> grain as a raw material for bi<strong>of</strong>uel<br />
27