The Maturing of the Chinese Real Estate Market - RREEF Real Estate
The Maturing of the Chinese Real Estate Market - RREEF Real Estate
The Maturing of the Chinese Real Estate Market - RREEF Real Estate

Create successful ePaper yourself
Turn your PDF publications into a flip-book with our unique Google optimized e-Paper software.
<strong>RREEF</strong> Research<br />
March 2007 <strong>The</strong> <strong>Maturing</strong> <strong>of</strong> <strong>the</strong> <strong>Chinese</strong> <strong>Real</strong><br />
<strong>Estate</strong> <strong>Market</strong><br />
Table <strong>of</strong> Contents<br />
1. Introduction…………………….1<br />
2. Macroeconomic Prospects and<br />
Status…………………………. 2<br />
3. <strong>Real</strong> <strong>Estate</strong> Performance… 5<br />
• <strong>Real</strong> estate fundamentals….. 5<br />
• Office markets………………. 7<br />
• Retail markets……………... 10<br />
• Industrial/logistics markets.. 12<br />
• Residential………………. 13<br />
• Hotel markets……………… 15<br />
• <strong>Real</strong> estate pricing………… 17<br />
4. <strong>Real</strong> <strong>Estate</strong> <strong>Market</strong> Risks…. 19<br />
5. Conclusions and Fur<strong>the</strong>r<br />
Research………………………. 22<br />
Authors:<br />
Tan Yen Keng<br />
+852 2203 8062<br />
yenkeng.tan@rreef.com<br />
Peter Hobbs<br />
+44 (0)20 7547 4855<br />
peter.hobbs@rreef.com<br />
Henry Chin<br />
+44 (0)20 7545 6611<br />
henry.chin@rreef.com<br />
IMPORTANT: PLEASE SEE<br />
IMPORTANT DISCLOSURES AND<br />
ANALYST CERTIFICATION<br />
IMMEDIATELY AT THE END OF<br />
THE TEXT OF THIS REPORT<br />
1. Introduction<br />
Given <strong>the</strong> recent dramatic growth in <strong>the</strong> scale and activity <strong>of</strong> <strong>the</strong> <strong>Chinese</strong> real estate<br />
market it is worth pausing to consider <strong>the</strong> evolution <strong>of</strong> <strong>the</strong> market and some <strong>of</strong> <strong>the</strong><br />
opportunities and challenges in <strong>the</strong> years ahead. In this paper, we provide a<br />
framework for understanding <strong>the</strong> attractiveness <strong>of</strong> <strong>the</strong> market as a way to identify<br />
some <strong>of</strong> <strong>the</strong> steps that <strong>Chinese</strong> real estate needs to go through to ensure <strong>the</strong><br />
continued development <strong>of</strong> <strong>the</strong> market. <strong>The</strong> paper draws from recent research on<br />
global, regional and local real estate markets, as part <strong>of</strong> <strong>RREEF</strong>’s ongoing analysis <strong>of</strong><br />
<strong>the</strong> market 1 .<br />
In understanding <strong>the</strong> evolution <strong>of</strong> <strong>the</strong> <strong>Chinese</strong> real estate market, it is useful to explore<br />
some <strong>of</strong> <strong>the</strong> key issues that determine <strong>the</strong> attractiveness <strong>of</strong> <strong>the</strong> market to institutional<br />
investors, along three dimensions:<br />
1. Macroeconomic Prospects and Status<br />
2. <strong>Real</strong> <strong>Estate</strong> Performance<br />
3. <strong>Real</strong> <strong>Estate</strong> <strong>Market</strong> Risks<br />
<strong>The</strong>se issues are explored in turn, and <strong>the</strong> paper concludes by assessing <strong>the</strong> relative<br />
attractiveness <strong>of</strong> <strong>the</strong> market on each <strong>of</strong> <strong>the</strong> dimensions, and by identifying areas for<br />
fur<strong>the</strong>r research.<br />
1 <strong>RREEF</strong> (2006), “Global <strong>Real</strong> <strong>Estate</strong> Insights”; <strong>RREEF</strong> (2006) “Asia Pacific Property<br />
Cycle Monitor”, November.
…phenomenal economic<br />
growth means that by 2010,<br />
China’s GDP will exceed<br />
Germany and, by 2015, that<br />
<strong>of</strong> Japan<br />
2. Macroeconomic Prospects and Status<br />
A combination <strong>of</strong> factors including strong manufacturing activity and exports, and<br />
increasing domestic wealth and rising consumption means that China has, over recent<br />
years, experienced phenomenal economic growth. This growth means that, by 2006,<br />
China had become <strong>the</strong> fourth largest economy in <strong>the</strong> world, ranked in front <strong>of</strong> UK and<br />
France. By 2010, China’s GDP will exceed Germany and, by 2015, that <strong>of</strong> Japan, making<br />
China <strong>the</strong> second largest economy in <strong>the</strong> world.<br />
Table 1: Top Ten World Economies: Ranked by GDP, US$ Billion<br />
Country 1995 Country 2006 Country 2010 Country 2015 Country 2020<br />
US 7398 US 13237 US 16103 US 20278 US 25624<br />
Japan 5246 Japan 4351 Japan 5908 China 8235 China 13466<br />
Germany 2525 Germany 2905 China 4753 Japan 6977 Japan 7655<br />
France 1572 China 2624 Germany 3719 Germany 4122 UK 5212<br />
UK 1135 UK 2376 UK 3153 UK 3858 Germany 5043<br />
Italy 1128 France 2237 France 2967 France 3485 France 4479<br />
China 761 Italy 1853 Italy 2413 Italy 2782 Italy 3533<br />
Brazil 704 Canada 1271 Russia 1749 Russia 2429 India 3508<br />
Spain 597 Spain 1221 Spain 1740 India 2228 Russia 3088<br />
Canada 591 Russia 986 Canada 1544 Spain 2130 Spain 2821<br />
Source: <strong>RREEF</strong> Research, Global Insights, World Bank<br />
China’s GDP growth is set to exceed 10% in 2006 and, although it will slow slightly in 2007<br />
due to <strong>the</strong> “mid-cycle slowdown” <strong>of</strong> <strong>the</strong> global economy and <strong>the</strong> “administrative tightening”<br />
by <strong>the</strong> <strong>Chinese</strong> government, growth is set to remain around 9.5%, <strong>the</strong> fastest rate <strong>of</strong><br />
growth <strong>of</strong> all <strong>the</strong> major global economies 2 . Despite an expected deceleration <strong>of</strong> export<br />
growth for China to 17% in 2007 from 2006’s 25% due to a slowdown in G3 growth,<br />
domestic growth is coming to be a more important component <strong>of</strong> GDP, and this is set to<br />
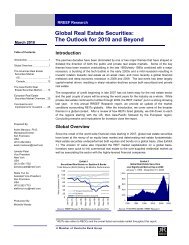
support high rates <strong>of</strong> growth over <strong>the</strong> medium and longer term 3 . Based on this and a<br />
series <strong>of</strong> o<strong>the</strong>r changes, a recent study by Deutsche Bank Research forecast that China is<br />
expected to have, alongside India, <strong>the</strong> strongest rate <strong>of</strong> annual average GDP growth<br />
among <strong>the</strong> major economies over <strong>the</strong> coming 15 years 4 .<br />
Projected GDP growth p.a 2007-25 %<br />
9.0<br />
8.0<br />
7.0<br />
6.0<br />
5.0<br />
4.0<br />
3.0<br />
2.0<br />
1.0<br />
India<br />
Source: <strong>RREEF</strong> Research, Global Insights<br />
Chart 1:Long Term Economic Prospects<br />
China<br />
Thailand<br />
Brazil<br />
Mexico<br />
Emerging Economies<br />
New Zeland<br />
Australia<br />
Canada<br />
Spain<br />
Finland<br />
Belgium Denmark<br />
France<br />
Austria<br />
Nederlands<br />
Italy Germany<br />
Japan<br />
Sweden<br />
UK<br />
2 Deutsche Bank (2007), “Global Economic Perspectives“, January.<br />
3 Deutsche Bank (2006), “2007 Emerging <strong>Market</strong>s Outlook”, December.<br />
4 Deutsche Bank Research Formel-G (2005), “Global Growth 2020”.<br />
<strong>RREEF</strong> Research 2<br />
Malaysia<br />
Greece<br />
Portugal<br />
S Korea<br />
0.0<br />
0 5,000 10,000 15,000 20,000 25,000 30,000 35,000 40,000 45,000 50,000<br />
GDP per Capita PPP<br />
OECD Economies<br />
Ireland<br />
US
…despite recent volatility in<br />
financial markets, <strong>the</strong><br />
tightening measures seem to<br />
be having <strong>the</strong> desired effect<br />
Despite <strong>the</strong> favourable outlook, <strong>the</strong>re remain two significant economic risks facing <strong>the</strong><br />
<strong>Chinese</strong> economy, those <strong>of</strong> “overheating” and <strong>of</strong> “economic maturity”. <strong>The</strong> recent volatility<br />
<strong>of</strong> <strong>the</strong> <strong>Chinese</strong> stock market and increasing concerns by <strong>the</strong> government over <strong>the</strong> liquidity<br />
in <strong>the</strong> market demonstrate <strong>the</strong> ongoing risks facing <strong>the</strong> <strong>Chinese</strong> economy. Despite <strong>the</strong><br />
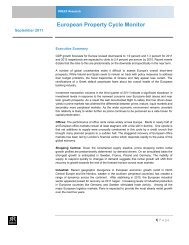
recent volatility, <strong>the</strong> tightening measures seem to be having <strong>the</strong> desired effect, with inflation<br />
remaining low and with Deutsche Bank’s “China Overheating Indicator” (COI) hovering below<br />
<strong>the</strong> overheating warning threshold (amber threshold) since Q4 2004 5 . It is expected that<br />
<strong>the</strong> <strong>Chinese</strong> government will maintain a tightening bias as long as <strong>the</strong>re are signs <strong>of</strong><br />
overheating. Despite this, aggressive policy tightening has become less likely as <strong>the</strong><br />
quality <strong>of</strong> economic growth has improved significantly over <strong>the</strong> past year with little sign <strong>of</strong><br />
inflation and sectoral imbalance, and broad-based improvement in pr<strong>of</strong>it growth and pr<strong>of</strong>it<br />
margins 6 .<br />
COI Indicator<br />
9<br />
6<br />
3<br />
0<br />
-3<br />
Mar-93<br />
Sep-93<br />
Mar-94<br />
Sep-94<br />
Mar-95<br />
Source: Deutsche Bank Research<br />
Chart 2: China Overheating Indicator<br />
Amber threshold Red threshold COI % yoy (3-month moving average)<br />
Sep-95<br />
Note 1: COI tracks demand factors that exert upward pressure on prices and can be used as leading indicator for<br />
inflation<br />
Note 2: <strong>The</strong> amber and red thresholds represent 1.5 and 2.5 standard deviations from <strong>the</strong> historical average <strong>of</strong> <strong>the</strong><br />
series, and are applied to gauge <strong>the</strong> extent <strong>of</strong> overheating pressures<br />
Note 3: Higher score indicates a greater risk <strong>of</strong> overheating<br />
Mar-96<br />
Sep-96<br />
In terms <strong>of</strong> economic risks, <strong>the</strong> government has, over recent years, introduced a series <strong>of</strong><br />
measures and reforms to enable greater economic flexibility and liberalisation. Despite this,<br />
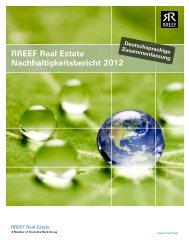
<strong>the</strong> economy and political system remains centrally controlled, such that <strong>the</strong> “country risks”<br />
associated with investing in China are significantly higher than for o<strong>the</strong>r major global<br />
economies (Chart 3). This is particularly due to <strong>the</strong> relatively poor regulation <strong>of</strong> credit,<br />
labour and business markets, as well as uncertainty <strong>of</strong> legal structures and <strong>the</strong> security <strong>of</strong><br />
property rights 7. Although China suffers from relatively high degrees <strong>of</strong> “country risk”, <strong>the</strong>re<br />
are significant efforts to liberalise <strong>the</strong> economy driven, according to <strong>the</strong> Economist<br />
Intelligence Unit, by concerns to reduce social inequalities which have led “<strong>the</strong> balance <strong>of</strong><br />
economic development [to be] altered in favour <strong>of</strong> social priorities. <strong>The</strong> economy is opening<br />
up now that China has joined <strong>the</strong> World Trade Organisation and is pursuing fur<strong>the</strong>r<br />
liberalisation. A private sector made up <strong>of</strong> domestic and foreign-funded interests is now<br />
fully encouraged to expand and complement <strong>the</strong> state sector.” 8<br />
5 Deutsche Bank (2007), “China Overheating Indicator”, March.<br />
6 Deutsche Bank (2006), “2007 Emerging <strong>Market</strong>s Outlook”, December.<br />
7 Fraser Institute (2006), “Economic Freedom <strong>of</strong> <strong>the</strong> World Annual Report”.<br />
8 EIU Country Briefing, November 2006.<br />
<strong>RREEF</strong> Research 3<br />
Mar-97<br />
Sep-97<br />
Mar-98<br />
Sep-98<br />
Mar-99<br />
Sep-99<br />
Mar-00<br />
Sep-00<br />
Mar-01<br />
Sep-01<br />
Mar-02<br />
Sep-02<br />
Mar-03<br />
Sep-03<br />
Mar-04<br />
Sep-04<br />
Mar-05<br />
Sep-05<br />
Mar-06<br />
Sep-06
Country Risk (out <strong>of</strong> 100 - higher is better)<br />
110<br />
100<br />
90<br />
80<br />
70<br />
60<br />
50<br />
40<br />
China<br />
India<br />
Chart 3: Country Risk vs. Economic Growth<br />
Poland<br />
Mexico<br />
Russia<br />
S Korea<br />
0 10,000 20,000 30,000 40,000 50,000 60,000<br />
Source: <strong>RREEF</strong> Research, EuroMoney, Global Insights<br />
Note 1: Size <strong>of</strong> bubble represents nominal GDP size<br />
GDP Per Capita US$<br />
Note 2: Country risk score based on a combination <strong>of</strong> political, economic, debt, credit, financial and capital market<br />
considerations<br />
<strong>RREEF</strong> Research 4<br />
Spain<br />
UK<br />
Japan<br />
USA<br />
Higher Risk Singapore France<br />
Lower Risk
…urban population larger than<br />
North America and India…<br />
…113 cities with a population<br />
<strong>of</strong> more than one million<br />
people…<br />
3. <strong>Real</strong> <strong>Estate</strong> Performance<br />
3.1 <strong>Real</strong> <strong>Estate</strong> Fundamentals<br />
<strong>The</strong> second critical factor for investors relates to real estate performance in terms both <strong>of</strong><br />
market fundamentals and pricing. In terms <strong>of</strong> market fundamentals, <strong>the</strong> strong pace <strong>of</strong><br />
economic growth coupled with <strong>the</strong> very low levels <strong>of</strong> good quality space mean <strong>the</strong>re has<br />
been significant growth across all real estate sectors in China, and this is set to continue<br />
over <strong>the</strong> medium and longer term.<br />
As <strong>the</strong> <strong>Chinese</strong> economy has grown and modernised, so <strong>the</strong> role <strong>of</strong> cities has increased.<br />
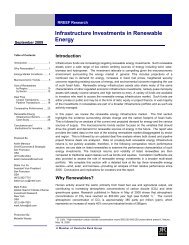
During <strong>the</strong> 1950s, it is estimated that less than 15% <strong>of</strong> <strong>the</strong> population was “urban” 9 . Over<br />
<strong>the</strong> following decades, urbanisation increased dramatically such that, by 2005, over 40% <strong>of</strong><br />
<strong>the</strong> population had become urban (Chart 4). This rapid increase means that China now<br />
has a bigger urban population than North America and India, and is marginally behind<br />
Europe. <strong>The</strong> United Nation Population Division forecasts <strong>the</strong> degree <strong>of</strong> urbanisation in<br />
China will grow to over 60% with an urban population <strong>of</strong> 875 million by 2030.<br />
%<br />
100<br />
90<br />
80<br />
70<br />
60<br />
50<br />
40<br />
30<br />
20<br />
10<br />
0<br />
Chart 4: Urbanisation Ratio, %<br />
Source: <strong>RREEF</strong> Research, United Nation, World Population Prospects: <strong>The</strong> 2005 Revision<br />
This urbanisation trend is widespread across China, such that <strong>the</strong> country now has a total<br />
<strong>of</strong> 113 cities with a population <strong>of</strong> more than one million people, and three mega cities with<br />
more than ten million people 10 . Many <strong>of</strong> <strong>the</strong>se cities are regional centres with heavy<br />
concentrations <strong>of</strong> economic activity. Although <strong>the</strong> national GDP per capita is only slightly<br />
above US$1,700 11 , <strong>the</strong>re are 35 cities (including <strong>the</strong> four Tier-1 cities <strong>of</strong> Beijing, Shanghai,<br />
Shenzhen and Guangzhou) with over 900,000 people and a GDP per capita over<br />
US$4,000. <strong>The</strong>se 35 cities in aggregate only account for 8.7% <strong>of</strong> <strong>the</strong> total population but<br />
contribute 35% <strong>of</strong> <strong>the</strong> country’s GDP.<br />
<strong>The</strong> increased urbanisation rate will see cities continue to grow in size, especially <strong>the</strong> more<br />
economically developed cities. Infrastructure and public services such as transportation<br />
network, utilities, education and healthcare facilities, as well as housing, will need to<br />
expand to cope with <strong>the</strong> growing population 12<br />
. It is estimated that at least 15 million new<br />
9<br />
United Nation, World Population Prospects: <strong>The</strong> 2005 Revision.<br />
10<br />
Beijing, Shanghai and Chongqing – according to <strong>The</strong> Yearbook <strong>of</strong> China’s Cities 2006.<br />
11<br />
As <strong>of</strong> 2005, International Monetary Fund.<br />
12<br />
<strong>RREEF</strong> Research (2006), “Asian Infrastructure <strong>Market</strong>s: Exploring Trends in a Changing <strong>Market</strong>”,<br />
November.<br />
Europe Nor<strong>the</strong>rn America China<br />
1950 1955 1960 1965 1970 1975 1980 1985 1990 1995 2000 2005 2010 2015 2020 2025 2030<br />
<strong>RREEF</strong> Research 5
…transformations in <strong>the</strong> urban<br />
structure are driving demand<br />
for real estate.<br />
residential units in cities are required over <strong>the</strong> next 5 years driven by this urbanisation 13 . In<br />
<strong>the</strong> 11th Five-Year Plan 14 , <strong>the</strong> <strong>Chinese</strong> government has acknowledged that rapid<br />
population expansion in <strong>the</strong> established cities (i.e. Tier-I cities) will strain <strong>the</strong> limits <strong>of</strong> <strong>the</strong>ir<br />
infrastructure and population growth in <strong>the</strong>se cities should be moderated via industrybased<br />
restructuring. Despite <strong>the</strong>se measures, <strong>the</strong> population <strong>of</strong> Tier-1 cities is set to<br />
continue to grow but probably at a lower rate than <strong>the</strong> second-tier cities where urbanisation<br />
continues to be encouraged.<br />
Population (million)<br />
14<br />
13<br />
12<br />
11<br />
10<br />
9<br />
8<br />
7<br />
6<br />
5<br />
Dongguan<br />
Chart 5: <strong>Chinese</strong> Cities with Over 900,000 People and<br />
GDP per capita over US$ 4,000<br />
Shenyang<br />
Tianjin<br />
Nanjing<br />
<strong>RREEF</strong> Research 6<br />
Beijing<br />
Shanghai<br />
Guangzhou<br />
4 Changcun Foshan<br />
Hangzhou<br />
Tangshan Jinan<br />
Zibo<br />
Qingdao<br />
3<br />
Shijiazhuang Changsha Yantai<br />
Nanchang Hefei Anshan<br />
2<br />
Changzhou<br />
Xiamen<br />
Huhehaute<br />
1<br />
Zhongshan<br />
Wenzhou<br />
Zhenjiang Liuzhou Zhuhai<br />
0<br />
Dalian<br />
Suzhou<br />
Ningbo<br />
Shenzhen<br />
Wuxi<br />
Daqing<br />
Macau<br />
(POP:0.5mn; GDPPC:$24,274)<br />
3,000 5,000 7,000 9,000 11,000 13,000<br />
GDP Per Capita (US$/person)<br />
Source: <strong>The</strong> Yearbook <strong>of</strong> China's Cities 2006, China Statistical Yearbook 2006<br />
Note: Data shown in this chart are 2005’s figure<br />
Hong Kong<br />
(POP:6.9mn; GDPPC:$25,622)<br />
<strong>The</strong> dramatic transformations in <strong>the</strong> urban structure <strong>of</strong> <strong>the</strong> <strong>Chinese</strong> economy are driving<br />
strong demand for all forms <strong>of</strong> real estate, especially in <strong>the</strong> major cities. <strong>The</strong> high levels <strong>of</strong><br />
new supply mean that certain property markets are facing rising vacancies and stable or<br />
declining rents over <strong>the</strong> short term, but <strong>the</strong> medium and long-term prospects for each <strong>of</strong> <strong>the</strong><br />
main property sectors remain favourable, as summarized below:<br />
13 DTZ Research (2006), “China’s 11 th Five Year Plan: What It Means for <strong>the</strong> Property Sector”.<br />
14 <strong>The</strong> Central People’s Government <strong>of</strong> <strong>the</strong> People’s Republic <strong>of</strong> China “<strong>The</strong> 11 th Five Year Plan”.
…surge <strong>of</strong> new supply such<br />
that new construction has<br />
accounted for over 20% <strong>of</strong> <strong>the</strong><br />
existing stock<br />
…poor quality <strong>of</strong> much <strong>of</strong> <strong>the</strong><br />
existing <strong>of</strong>fice space… leading<br />
to a “flight to quality”.<br />
3.2 Office <strong>Market</strong>s<br />
<strong>The</strong> scale <strong>of</strong> economic growth and <strong>the</strong> urbanisation and liberalisation <strong>of</strong> <strong>the</strong> economy have<br />
led to <strong>the</strong> rapid expansion <strong>of</strong> both domestic and international companies across <strong>the</strong> major<br />
cities in China. This growth has been accompanied by a general shifting <strong>of</strong> <strong>the</strong> economic<br />
base within major urban areas such that <strong>the</strong>re has been a move away from productionbased<br />
industrial activities to more service-based activities. This restructuring <strong>of</strong> economic<br />
activity has underpinned <strong>the</strong> exceptionally strong demand for <strong>of</strong>fice space in <strong>the</strong> major<br />
urban areas, in a similar way to <strong>the</strong> strong and sustained growth experienced in North<br />
America and Japan between <strong>the</strong> 1950s and <strong>the</strong> 1980s.<br />
In <strong>the</strong> face <strong>of</strong> this strong demand and, given <strong>the</strong> relative shortage <strong>of</strong> quality <strong>of</strong>fice space,<br />
most <strong>of</strong> China’s major cities have experienced a surge <strong>of</strong> new supply over recent years.<br />
During much <strong>of</strong> <strong>the</strong> 1990s, new construction activity averaged over 20% <strong>of</strong> <strong>the</strong> existing<br />
stock, twice as high as <strong>the</strong> regional average, as shown in Chart 6. <strong>The</strong> scale <strong>of</strong><br />
construction activity, coupled with <strong>the</strong> inherent cyclicality <strong>of</strong> <strong>of</strong>fice markets, means that<br />
vacancy rates and rental growth has tended to be fairly volatile over recent years. As <strong>the</strong><br />
markets gain scale and critical mass, it is likely that new construction will come to<br />
represent a smaller share <strong>of</strong> <strong>the</strong> overall inventory, and this is likely to reduce <strong>the</strong> volatility <strong>of</strong><br />
vacancy rates and rental growth.<br />
% <strong>of</strong> Total Stock<br />
60%<br />
50%<br />
40%<br />
30%<br />
20%<br />
10%<br />
0%<br />
Chart 6: Office Space Under Construction<br />
China Cities Regional Average<br />
1990 1991 1992 1993 1994 1995 1996 1997 1998 1999 2000 2001 2002 2003 2004 2005 2006<br />
Source: <strong>RREEF</strong> Research, JLL<br />
Note 1: As <strong>of</strong> Q4 2006<br />
Note 2: China Cities include Shanghai Pudong and Puxi prime <strong>of</strong>fice stock and Beijing prime <strong>of</strong>fice stock in CBD,<br />
East Chang An, 3rd Embassy and Zhongguancun<br />
Note 3: Regional average covers prime <strong>of</strong>fice stock in Beijing, Shanghai, Seoul, Tokyo, Sydney, Melbourne and<br />
Singapore.<br />
Beyond <strong>the</strong> strong and sustained nature <strong>of</strong> demand for <strong>of</strong>fice space and <strong>the</strong> likely<br />
reductions in <strong>the</strong> volatility <strong>of</strong> <strong>the</strong> major markets, <strong>the</strong>re are a number <strong>of</strong> additional factors<br />
that will influence <strong>the</strong> performance <strong>of</strong> <strong>of</strong>fice markets over <strong>the</strong> coming years. First, <strong>the</strong><br />
relatively poor quality <strong>of</strong> much <strong>of</strong> <strong>the</strong> existing <strong>of</strong>fice space, despite <strong>the</strong> high levels <strong>of</strong><br />
construction activity over recent years. Much <strong>of</strong> <strong>the</strong> existing stock is <strong>of</strong> poor quality or<br />
functionally obsolete for <strong>of</strong>fice occupiers that have become more sophisticated and more<br />
demanding, and this has been demonstrated by <strong>the</strong> “flight to quality” in Tier-1 cities in<br />
recent years. Within this context, <strong>the</strong> prospects seem to be better for <strong>the</strong> relatively few<br />
prime quality <strong>of</strong>fice buildings in <strong>the</strong> best locations. Such buildings will continue to<br />
experience strong demand and be able to maintain high occupancy and high rents even<br />
when <strong>the</strong> market as a whole is experiencing considerable oversupply. In contrast, <strong>the</strong><br />
<strong>RREEF</strong> Research 7
…marked variations at <strong>the</strong><br />
sub-market and asset-specific<br />
levels.<br />
prospects for poor quality and functionally obsolete <strong>of</strong>fice space are less good with<br />
increasing pressure for <strong>the</strong> refurbishment or redevelopment <strong>of</strong> such buildings.<br />
A second additional feature <strong>of</strong> <strong>the</strong> maturing <strong>of</strong> <strong>the</strong> market is <strong>the</strong> marked variations within<br />
individual cities, at <strong>the</strong> sub-market and asset-specific levels. <strong>The</strong> scale <strong>of</strong> many <strong>of</strong> <strong>the</strong><br />
larger cities means that <strong>the</strong>y tend to have multiple CBDs and, with <strong>the</strong> continual<br />
improvements to <strong>the</strong> transportation infrastructure and occupier preferences, <strong>the</strong> relative<br />
strength <strong>of</strong> different sub-markets can vary over time within individual cities. This is clearly<br />
demonstrated for <strong>the</strong> case <strong>of</strong> Beijing, as explained below, but is also apparent within o<strong>the</strong>r<br />
major cities.<br />
Beijing’s <strong>of</strong>fice market is expecting a surge in new supply in 2007 due to <strong>the</strong> moratorium on<br />
new development during <strong>the</strong> hosting <strong>of</strong> <strong>the</strong> Olympic Games in 2008. This surge <strong>of</strong> new<br />
supply is, however, concentrated in particular sub-markets, most particularly in <strong>the</strong> CBD<br />
where vacancies are set to rise. <strong>The</strong> new supply in o<strong>the</strong>r <strong>of</strong>fice submarkets such as<br />
Lufthansa and Financial Street is less significant compared with <strong>the</strong> CBD. <strong>The</strong> high<br />
occupancy rates in <strong>the</strong>se sub-markets, coupled with strong occupier demand, means that<br />
vacancy rates are likely to remain relatively low, certainly compared with <strong>the</strong> CBD. <strong>The</strong><br />
liberalisation <strong>of</strong> <strong>the</strong> local banking and insurance industries will underpin strong demand in<br />
Beijing <strong>of</strong>fice market as a whole but <strong>the</strong>re will continue to be marked variations across <strong>the</strong><br />
major sub-markets.<br />
In Shanghai, <strong>the</strong> short term prospects for <strong>the</strong> <strong>of</strong>fice market remain good due to <strong>the</strong><br />
resilience <strong>of</strong> demand and, with limited to moderate new supply in <strong>the</strong> Puxi and Pudong<br />
area, declining vacancy rates. By <strong>the</strong> end <strong>of</strong> 2006, vacancy rates had declined to close to<br />
6% and prime rents continued to grow strongly. New supply is expected to come to <strong>the</strong><br />
market in 2008 and 2009 with <strong>the</strong> majority in <strong>the</strong> Pudong area. This is likely to push <strong>the</strong><br />
vacancy rate up, particularly for <strong>the</strong> older and secondary <strong>of</strong>fice stock given <strong>the</strong> high quality<br />
<strong>of</strong> <strong>the</strong> space that is being completed. Over <strong>the</strong> medium and longer term, <strong>the</strong> outlook <strong>of</strong> <strong>the</strong><br />
market is positive due to <strong>the</strong> strength <strong>of</strong> demand and underlying economic fundamentals <strong>of</strong><br />
this key business centre <strong>of</strong> China.<br />
<strong>RREEF</strong> Research 8
Moscow<br />
Source: <strong>RREEF</strong> Research<br />
Note: Based on <strong>RREEF</strong> 2006 year-end forecast<br />
Chart 7: Global Office <strong>Market</strong> Rental Cycle, 2007<br />
Budapest<br />
Beijing<br />
Frankfurt/ Tokyo<br />
Berlin<br />
Amsterdam<br />
Guangzhou’s prime <strong>of</strong>fice market has benefited from a relative shortage <strong>of</strong> supply which,<br />
coupled with <strong>the</strong> steady economic growth and declining vacancy rates, led to strong rental<br />
growth during 2006. With <strong>the</strong> development <strong>of</strong> a new CBD in Pearl River New City, <strong>the</strong> new<br />
<strong>of</strong>fice space comes on stream between 2007 and 2009 will increase to 1.5 million sq m 15 .<br />
Over <strong>the</strong> medium term, <strong>the</strong> continuous deregulation <strong>of</strong> China’s financial market will drive<br />
Guangzhou’s economic development which, coupled with increasing demand for<br />
pr<strong>of</strong>essional and business services, will help absorb <strong>the</strong> increased supply <strong>of</strong> prime <strong>of</strong>fices.<br />
As <strong>the</strong> Guangzhou real estate market matures, <strong>the</strong>re are signs that an increasing number<br />
<strong>of</strong> developers are choosing to hold <strong>the</strong>ir newly developed properties under sole ownership<br />
for rental income, instead <strong>of</strong> selling <strong>the</strong> property in strata title units 16 .<br />
As for o<strong>the</strong>r Tier-1 cities, Shenzhen is experiencing active <strong>of</strong>fice development, with more<br />
than 900,000 sq m <strong>of</strong> <strong>of</strong>fice space scheduled for completion during 2007. Many <strong>of</strong> <strong>the</strong> new<br />
buildings are <strong>of</strong> higher quality and have been pre-sold or pre-leased to occupiers. <strong>The</strong><br />
demand for quality <strong>of</strong>fice space in Shenzhen is driven by <strong>the</strong> expansion <strong>of</strong> local businesses<br />
and <strong>the</strong> continued influx <strong>of</strong> foreign enterprises, partly due to <strong>the</strong> WTO and CEPA<br />
agreements, increased ties between Shenzhen and Hong Kong, and <strong>the</strong> Guangzhou-<br />
Shenzhen-Hong Kong Rail Link 16 . Despite <strong>the</strong> strong demand, <strong>the</strong> <strong>of</strong>fice vacancy rate is<br />
expected to rise in <strong>the</strong> short term, but <strong>of</strong>fice rents will be likely to remain stable as a series<br />
<strong>of</strong> occupiers seek to upgrade <strong>the</strong>ir existing accommodation.<br />
15 JLL REIS services.<br />
16 CBRE (2006), “China Office <strong>Market</strong> Review 3Q/2006”.<br />
Guangzhou<br />
Washington/<br />
Singapore<br />
New York<br />
Paris<br />
Shanghai/<br />
Hong Kong<br />
Shenzhen<br />
London/ West End<br />
London/ City<br />
<strong>RREEF</strong> Research 9
Retail markets benefit from<br />
structural changes…<br />
… but certain markets are<br />
oversupplied.<br />
3.3 Retail <strong>Market</strong>s<br />
Although <strong>the</strong> <strong>of</strong>fice markets in China are highly cyclical, <strong>the</strong> retail markets are benefiting<br />
from structural changes associated with <strong>the</strong> maturing <strong>of</strong> <strong>the</strong> overall retail market (see<br />
Charts 8 and 9). Rising prosperity toge<strong>the</strong>r with <strong>the</strong> liberalisation <strong>of</strong> <strong>the</strong> retail sector<br />
including <strong>the</strong> relaxation <strong>of</strong> restrictions on foreign retailers entering China, has boosted<br />
retailer demand for <strong>the</strong> limited amount <strong>of</strong> high quality retail space in prime location. <strong>The</strong>se<br />
factors are set to continue to underpin strong rental growth for prime retail sectors and<br />
markets across China.<br />
Strong retail sales and confidence in <strong>the</strong> performance prospects for pr<strong>of</strong>essionally<br />
managed retail property have spurred investment interest from both investors and retailers.<br />
<strong>The</strong> introduction <strong>of</strong> a series <strong>of</strong> austerity measures to curb housing speculation in 2006 has<br />
also seen some funds being channelled into retail property. Although high quality retail<br />
space in prime location remains attractive due to <strong>the</strong>ir scarcity and strong demand, certain<br />
parts <strong>of</strong> <strong>the</strong> <strong>Chinese</strong> retail market are becoming oversupplied. This is particularly <strong>the</strong> case<br />
where <strong>the</strong>re has been massive retail development in regional areas and second-tier cities<br />
that is likely to result in downward pressure on rents.<br />
Prospects for prime rents in <strong>the</strong> Tier-1 cities remain more favourable. For instance, retail<br />
rents in Shanghai rose by around 30% in 2006 17 due to <strong>the</strong> strong demand, <strong>of</strong>ten driven by<br />
high-pr<strong>of</strong>ile international retailers, and <strong>the</strong> limited amount <strong>of</strong> space in <strong>the</strong> downtown<br />
commercial areas. With new prime retail developments mostly pre-let, vacancy rates are<br />
expected to trend downwards during <strong>the</strong> remainder <strong>of</strong> <strong>the</strong> decade, such that positive rental<br />
growth is likely to continue. In Beijing, prime rental growth was broadly flat in 2006 due to<br />
<strong>the</strong> anticipation <strong>of</strong> a surge in new supply in 2007 and retailers’ increasing resistance to<br />
paying higher rents. <strong>The</strong> vacancy rate is expected to peak in 2007, with modest rental<br />
growth likely to return by <strong>the</strong> end <strong>of</strong> <strong>the</strong> decade with retail sales being buoyed by rising<br />
tourism, increasing disposable incomes and <strong>the</strong> 2008 Olympics. Retail markets in<br />
Shenzhen and Guangzhou were active in 2006 with major local and international retailers<br />
taking up more retail space, driven by buoyant retail sales. Small strata-title retail units<br />
have attracted interest from private investors and funds that have been diverted from<br />
residential market 18 . With <strong>the</strong> maturing <strong>of</strong> <strong>the</strong> retail market and demand for better managed<br />
retail space, new retail developments are more likely to be single owned ra<strong>the</strong>r than stratatitled.<br />
17 JLL (2007), “REIS Preliminary <strong>Market</strong> Overview 4Q/2006”.<br />
18 DTZ (2006), “Property Times – Guangzhou and Shenzhen 3Q/2006”.<br />
<strong>RREEF</strong> Research 10
RMB Billion<br />
Chart 8: Retail Sales in China, RMB Billion<br />
Source: <strong>RREEF</strong> Research, National Bureau <strong>of</strong> Statistics <strong>of</strong> China<br />
RMB<br />
7,000<br />
6,000<br />
5,000<br />
4,000<br />
3,000<br />
2,000<br />
1,000<br />
0<br />
12,000<br />
10,000<br />
8,000<br />
6,000<br />
4,000<br />
2,000<br />
0<br />
1978<br />
1980<br />
1985<br />
1989<br />
Chart 9: Disposable Income in China, RMB per capita per annum<br />
Source: <strong>RREEF</strong> Research, National Bureau <strong>of</strong> Statistics <strong>of</strong> China<br />
1990<br />
1978 -2005 CAGR= 14.4%<br />
<strong>RREEF</strong> Research 11<br />
1991<br />
1992<br />
1993<br />
1994<br />
1995<br />
1991-2005 CAGR= 13.9%<br />
1991 1992 1993 1994 1995 1996 1997 1998 1999 2000 2001 2002 2003 2004 2005<br />
1996<br />
1997<br />
1998<br />
1999<br />
2000<br />
2001<br />
2002<br />
2003<br />
2004<br />
2005
Strong manufacturing base<br />
and increasing role in global<br />
trade are driving industrial and<br />
logistics markets<br />
3.4 Industrial/Logistic <strong>Market</strong>s<br />
As for <strong>the</strong> retail market, <strong>the</strong> industrial/logistic market is benefiting from strong underlying<br />
demand and structural changes in <strong>the</strong> nature <strong>of</strong> <strong>the</strong> market. On <strong>the</strong> one hand, <strong>the</strong> country<br />
is benefiting from <strong>the</strong> region’s strong manufacturing base, rising affluence and consumer<br />
spending. On <strong>the</strong> o<strong>the</strong>r, <strong>the</strong> country has come to play a key role in global trade, with some<br />
<strong>of</strong> <strong>the</strong> world’s largest container ports and busiest cargo airports being located in China.<br />
Although industrial activity is increasing throughout <strong>the</strong> country, <strong>the</strong>re are three major<br />
concentrations as shown on <strong>the</strong> map. <strong>The</strong> industrial/logistic market in China is still very<br />
much dominated by local players with very high owner-occupation rates but international<br />
logistic players are increasing <strong>the</strong>ir presence in China and this has brought a structural<br />
shift to <strong>the</strong> demand <strong>of</strong> high quality purpose built industrial/logistic facilities.<br />
Greater Bohai Bay, North China<br />
Source: <strong>RREEF</strong> Research<br />
Chart 10: China’s Major Industrial Location<br />
•Beijing – Tianjin. Tianjin is <strong>the</strong> main manufacturing and logistics hub in <strong>the</strong><br />
Greater Bohai Bay area with Beijing focusing on business, technology and R&D.<br />
Yangtze River Delta, China<br />
•<strong>The</strong> growth <strong>of</strong> Tianjin industrial market has been boosted by government<br />
restrictions on new industrial land supply in Beijing. Manufacturing and<br />
logistics properties, predominately purpose built. Trade links between North<br />
China, Korea and Japan being promoted.<br />
Beijing<br />
Dalian<br />
• Shanghai is China’s main economic<br />
centre with <strong>the</strong> country’s largest<br />
container port.<br />
Pearl River Delta, China<br />
Chengdu<br />
Xian<br />
Tianjin<br />
Seoul<br />
Tokyo •Jiangsu is <strong>the</strong> principal<br />
Inchon Ulsan Yokohama<br />
Osaka<br />
Chiba manufacturing province in <strong>the</strong><br />
Quingdao<br />
Busan Nagoya Yangtze River Delta region.<br />
Gwangyang<br />
Fukuoka<br />
Suzhou<br />
•Jiangsu and Zhejiang provinces in<br />
Shanghai<br />
Greater Yangtze River Delta area are<br />
•Hong Kong has a strong logistics market – it is viewed<br />
as a major gateway into China with <strong>the</strong> world’s largest<br />
Delhi<br />
container port and Asia’s busiest cargo airports.<br />
Ksndla<br />
•Shenzhen and Guangzhou are strong logistics and<br />
Ningbo<br />
Chongqing<br />
Xiamen<br />
Guangzhou<br />
Taipei<br />
Kaohsiung<br />
Shenzhen<br />
growing in importance as cheaper<br />
logistics and manufacturing<br />
locations compared to Shanghai as<br />
infrastructure links improve.<br />
manufacturing markets. Mumbai Kolkata<br />
Hanoi<br />
Vientiane<br />
Hong Kong/<br />
Macau<br />
China’s Major Industrial Locations<br />
Dominant Regional Industrial City<br />
National/Regional Hub<br />
Major Industrial Region<br />
Ho Chi Minh City<br />
In terms <strong>of</strong> short term prospects, Beijing, Shanghai and Guangzhou benefit from relatively<br />
limited good quality supply, even in prime logistic centres and industrial zones. But <strong>the</strong>re<br />
are exceptions to this tight supply, such as in <strong>the</strong> city <strong>of</strong> Shenzhen 19 , where a number <strong>of</strong><br />
new industrial parks have recently been completed. Despite such exceptions, <strong>the</strong> strong<br />
fundamentals mean that in most markets high-spec buildings are expected to experience<br />
double-digit rental growth during 2007, although <strong>the</strong> vacancy rate for poorly constructed<br />
properties will remain high. Over <strong>the</strong> medium term, a series <strong>of</strong> factors including rising land<br />
costs due to <strong>the</strong> new industrial land auction policy, increasing government controls on land<br />
supply, fixed investments and foreign investment, and <strong>the</strong> boost to <strong>the</strong> local economies<br />
from <strong>the</strong> 2008 Olympics and 2010 World Expo should also all contribute to rents continuing<br />
on <strong>the</strong>ir upward trend.<br />
19 DTZ (2006), “Property Times – Shenzhen 3Q/2006”.<br />
<strong>RREEF</strong> Research 12<br />
Bangkok<br />
Kuala Lumpur<br />
Singapore
Despite <strong>the</strong> surge in house<br />
prices, <strong>the</strong> growth <strong>of</strong><br />
disposable income has also<br />
risen such that affordability<br />
has increased…<br />
3.5 Residential<br />
<strong>The</strong>re has been considerable recent comment on <strong>the</strong> pricing <strong>of</strong> <strong>the</strong> <strong>Chinese</strong> residential<br />
market, and <strong>the</strong> measures to curb house price speculation as well as to restrict foreign<br />
investment in <strong>the</strong> residential market 20 . It is clear that house prices have risen strongly, with<br />
average prices in <strong>the</strong> <strong>Chinese</strong> residential market increasing nearly 400% in 15 years.<br />
Despite this surge, <strong>the</strong> growth <strong>of</strong> per capita net disposable income has outpaced <strong>the</strong><br />
growth <strong>of</strong> housing prices resulting in improved affordability over this period, as shown in<br />
Chart 11.<br />
Based on <strong>the</strong> analysis <strong>of</strong> house prices, per capita income growth and affordability, it seems<br />
<strong>the</strong> rapid increase in house prices is a structural response to <strong>the</strong> growing wealth <strong>of</strong> <strong>the</strong><br />
overall <strong>Chinese</strong> economy. It also seems that <strong>the</strong> demand for affordable residential remains<br />
very strong given <strong>the</strong> favourable economic environment, rising income, improved living<br />
standards and urbanisation. Coupled with <strong>the</strong> functionally obsolete residential units built<br />
decades ago, <strong>the</strong>se factors are likely to create a structural shortage <strong>of</strong> housing supply,<br />
particularly, in cities. It is notable that <strong>the</strong> <strong>Chinese</strong> government’s control measures are<br />
targeted at high-end residential, while <strong>the</strong> government continues to encourage <strong>the</strong><br />
development <strong>of</strong> affordable mass residential to cater for <strong>the</strong> rising housing needs <strong>of</strong> <strong>the</strong><br />
population.<br />
<strong>The</strong> continued liberalization <strong>of</strong> <strong>the</strong> <strong>Chinese</strong> economy has attracted many foreign firms and<br />
expatriates. <strong>The</strong> accommodation needs <strong>of</strong> <strong>the</strong>se expatriates, coupled with an increasingly<br />
large local high-income group, have underpinned <strong>the</strong> demand for high-end residential units.<br />
However, <strong>the</strong> austerity measures have put pressure on <strong>the</strong> sales market and more<br />
potential buyers have turned to leasing. In Shanghai, <strong>the</strong> huge supply <strong>of</strong> luxury apartments<br />
between 2006 and 2009 is expected to lead to an increase in <strong>the</strong> vacancy rate to around<br />
20%. In Beijing, <strong>the</strong> vacancy rate <strong>of</strong> luxury apartments increased in 2006 and this is set to<br />
rise fur<strong>the</strong>r due to <strong>the</strong> anticipated growth in supply during 2007 and 2008. Rental growth<br />
for <strong>the</strong> high-end residential is expected to be minimal or even negative due to this<br />
oversupply and government control measures. However, over <strong>the</strong> medium term, <strong>the</strong><br />
continued increase in demand in Beijing and Shanghai associated with <strong>the</strong> 2008 Olympics<br />
and <strong>the</strong> 2010 World Expo, as well as <strong>the</strong> expectation <strong>of</strong> <strong>the</strong> fur<strong>the</strong>r RMB appreciation is<br />
likely to fuel investment interest for high-end properties.<br />
20 <strong>Chinese</strong> Urban and Rural <strong>Real</strong> <strong>Estate</strong> Economic Research Institute (2006),” Monthly Report <strong>of</strong> <strong>Real</strong><br />
<strong>Estate</strong> <strong>Market</strong> Prices”, various issues; Policy Research Centre <strong>of</strong> <strong>the</strong> Construction Department (2006),<br />
“Weekly Report <strong>of</strong> Construction and <strong>Real</strong> <strong>Estate</strong> Industry”, various issues; Xinhua (2006), “New<br />
Macro-Control Measures to Curb Soaring House Prices”, 21 May 2006; Colliers International (2006),<br />
“Greater China Quarterly Research Report”, July 2006; DTZ (2007), “Foreign <strong>Real</strong> <strong>Estate</strong> Investment<br />
Surges in Mainland China”, February 2007.<br />
<strong>RREEF</strong> Research 13
1991=100<br />
400<br />
350<br />
300<br />
250<br />
200<br />
150<br />
100<br />
50<br />
0<br />
Chart 11: Average House Price and Affordability Index in China<br />
Source: <strong>RREEF</strong> Research, NBS, CEIC<br />
Average House Price Index Affordability Index<br />
1991 1992 1993 1994 1995 1996 1997 1998 1999 2000 2001 2002 2003 2004 2005<br />
Note: <strong>The</strong> affordability index is calculated as <strong>the</strong> average mortgage payment for a 20-year mortgage loan for an<br />
average unit over per capita disposable income in China<br />
<strong>RREEF</strong> Research 14
Three drivers behind <strong>the</strong> hotel<br />
market, increased domestic<br />
tourism, rising business travel<br />
and increased international<br />
visitors…<br />
3.6 Hotel <strong>Market</strong>s<br />
<strong>The</strong> travel and tourism industry in China, which is <strong>the</strong> underlying demand driver for hotel<br />
markets, is one <strong>of</strong> <strong>the</strong> fastest growing markets in <strong>the</strong> world 21 . In <strong>the</strong> past two decades, <strong>the</strong><br />
real consumption <strong>of</strong> domestic travellers grew at 10.2% p.a. to reach US$80 billion in 2006,<br />
and that <strong>of</strong> business travellers, at 9.8% p.a. <strong>The</strong> number <strong>of</strong> international travellers to China<br />
grew even more quickly, rising at a compound annual growth rate <strong>of</strong> 18.9% since 1988.<br />
<strong>The</strong> expanding economy and business activity, increasing MICE 22 functions, rising<br />
domestic middle class, continued investment and development <strong>of</strong> historic and tourism<br />
spots, improving tourism infrastructure and transportation network are among <strong>the</strong> key<br />
contributing factors to this impressive growth. According to <strong>the</strong> World Travel and Tourism<br />
Council, <strong>the</strong> growth trend is expected to continue into <strong>the</strong> next decade (see Charts 12 to<br />
14). By 2020, <strong>the</strong> World Tourism Organisation forecasts that China will become <strong>the</strong><br />
world’s top tourist destination with 130 million arrivals.<br />
Chart 12: Consumption <strong>of</strong> Domestic Traveller<br />
Source: <strong>RREEF</strong> Research, World Travel and Tourism Council<br />
21<br />
Total Consumption (2000 constant) US$bn<br />
220<br />
200<br />
180<br />
160<br />
140<br />
120<br />
100<br />
80<br />
60<br />
40<br />
20<br />
1988-2006 CAGR = 10.2%<br />
Projected Growth<br />
= 9.9%p.a.<br />
0<br />
1988 1990 1992 1994 1996 1998 2000 2002 2004 2006 2008 2010 2012 2014 2016<br />
World Travel and Tourism Council (2006), “China Travel & Tourism Climbing To New Heights: <strong>The</strong><br />
2006 Travel & Tourism Economic Research”.<br />
22 MICE is an acronym for Meetings, Incentives, Conferencing and Exhibitions.<br />
<strong>RREEF</strong> Research 15
Chart 13: Consumption <strong>of</strong> Business Traveller<br />
Source: <strong>RREEF</strong> Research, World Travel and Tourism Council<br />
Chart 14: Consumption <strong>of</strong> International Traveller<br />
Source: <strong>RREEF</strong> Research, World Travel and Tourism Council<br />
On <strong>the</strong> supply side, China has <strong>the</strong> largest hotel development pipeline in Asia Pacific with<br />
over 300 hotel projects being developed 23 . <strong>The</strong> majority <strong>of</strong> <strong>the</strong>se hotel developments are<br />
concentrated in <strong>the</strong> larger cities such as Beijing, Shanghai, Shenzhen, Guangzhou, Tianjin,<br />
Ningbo, Chengdu and Macau. In Beijing, hotel development has been fast tracked leading<br />
up to 2008 Olympic Games, with 22 23 hotels scheduled to open between 2007 and early<br />
2008. In Shanghai, 43 23 new hotels are in <strong>the</strong> development pipeline and are planned to<br />
open between 2007 and 2010, before <strong>the</strong> World Expo takes place.<br />
Increased hotel supply (especially post international events), booming<br />
domestic/international visitors and business travellers, and continued expansion <strong>of</strong><br />
international hotel operators have brought a structural change to <strong>the</strong> hotel industry in China.<br />
<strong>The</strong> ADR for high-end (5-star) international (branded) hotel has been on a steady rise at a<br />
23<br />
Total Consumption (2000 constant) US$bn<br />
Total Consumption (2000 constant) US$bn<br />
80<br />
60<br />
40<br />
20<br />
1988-2006 CAGR = 9.8%<br />
Projected Growth<br />
= 10.1%p.a.<br />
0<br />
1988 1990 1992 1994 1996 1998 2000 2002 2004 2006 2008 2010 2012 2014 2016<br />
60<br />
50<br />
40<br />
30<br />
20<br />
10<br />
1988-2006 CAGR = 18.9%<br />
Projected Growth<br />
= 5.4%p.a.<br />
0<br />
1988 1990 1992 1994 1996 1998 2000 2002 2004 2006 2008 2010 2012 2014 2016<br />
Lodging Econometrics (2006), “Development Pipelines and Three Year Supply Growth Forecasts<br />
for 21 Asian Countries”, October 2006.<br />
<strong>RREEF</strong> Research 16
Current levels <strong>of</strong> yields mean<br />
many <strong>Chinese</strong> cities have<br />
become relatively attractive…<br />
rate <strong>of</strong> over 9% in <strong>the</strong> past four years, whilst <strong>the</strong> ADR for lower range local operated (nonbranded)<br />
hotel recorded minimal growth (1%) over <strong>the</strong> same period 24 . This divergence is<br />
expected to continue as <strong>the</strong> competition within <strong>the</strong> industry intensifies. Going forward, it is<br />
likely that <strong>the</strong> niche hotel class such as business hotel (targeting business traveller) and<br />
budget hotel (targeting domestic travellers) will outperform locally operated 4- and 3-star<br />
hotels, and non-branded hotels are likely to lose out to branded hotels. <strong>The</strong> dominance <strong>of</strong><br />
international hotel operators in <strong>the</strong> high-end sector and business class hotel will continue<br />
given <strong>the</strong>ir established brands, extensive client and marketing networks, and experienced<br />
hotel management teams.<br />
3.7 <strong>Real</strong> <strong>Estate</strong> Pricing<br />
In terms <strong>of</strong> pricing, <strong>the</strong> growing demand from both domestic and international investors for<br />
real estate product in China has led to general downward pressure on cap rates, although<br />
this has eased over <strong>the</strong> past year or so. This easing is due to a combination <strong>of</strong> factors<br />
including <strong>the</strong> increased restrictions on foreign investment, as well as <strong>the</strong> prospect <strong>of</strong><br />
oversupply and reduced rental growth in a number <strong>of</strong> <strong>of</strong>fice markets. This stabilisation <strong>of</strong><br />
cap rates contrasts markedly with o<strong>the</strong>r major cities, as shown on Chart 15. As we see in<br />
<strong>the</strong> following section, <strong>the</strong>re is a series <strong>of</strong> risks associated with investing in China, and investors<br />
need to be compensated for <strong>the</strong>se risks by higher yields. Despite this, <strong>the</strong> current level <strong>of</strong><br />
yields mean that many <strong>Chinese</strong> cities have become relatively attractive compared with a<br />
series <strong>of</strong> o<strong>the</strong>r major global markets.<br />
%<br />
12<br />
10<br />
8<br />
6<br />
4<br />
2<br />
0<br />
Source: <strong>RREEF</strong> Research, JLL, and CBRE<br />
24 China Hotel Industry Study 2006.<br />
Chart 15: Cap Rates for Key Global Office <strong>Market</strong>s<br />
New York London: City London: West End Bejing Shanghai Tokyo<br />
2000 2001 2002 2003 2004 2005 2006<br />
<strong>RREEF</strong> Research 17
9<br />
7<br />
5<br />
3<br />
1<br />
-1<br />
-3<br />
Avg Q4<br />
2001- 2006<br />
05<br />
Chart 16: Spread between Cap Rates and 10-year Govt. Yield<br />
Avg Q4<br />
2001- 2006<br />
05<br />
Avg Q4<br />
2001- 2006<br />
05<br />
Tokyo Hong Kong Singapore<br />
Bond rate Spread with Cap Rate<br />
Avg Q4<br />
2001- 2006<br />
05<br />
Shanghai<br />
Avg Q4<br />
2001- 2006<br />
05<br />
Source: <strong>RREEF</strong> Research, JLL, CBRE, Deutsche Bank, Global Insights<br />
Avg Q4<br />
2001- 2006<br />
05<br />
Avg Q4<br />
2001- 2006<br />
05<br />
Beijing New York London:<br />
City<br />
Avg Q4<br />
2001- 2006<br />
05<br />
London:<br />
Westend<br />
<strong>RREEF</strong> Research 18
China suffers from a shortage<br />
<strong>of</strong> market and performance<br />
data…<br />
<strong>The</strong> market remains relatively<br />
illiquid, but this is starting to<br />
change…<br />
4. <strong>Real</strong> <strong>Estate</strong> <strong>Market</strong> Risks<br />
Investors tend to categorise real estate risks into two groups. First, “institutional” factors<br />
related to <strong>the</strong> maturity <strong>of</strong> real estate markets as this plays a major role in determining <strong>the</strong><br />
risks <strong>of</strong> different markets 25 . A range <strong>of</strong> institutional factors is important, including liquidity,<br />
<strong>the</strong> reliability <strong>of</strong> pr<strong>of</strong>essional services and <strong>the</strong> availability <strong>of</strong> market information. <strong>The</strong><br />
availability <strong>of</strong> performance measurement services and general market data is a good<br />
indicator <strong>of</strong> market maturity/immaturity. <strong>The</strong> chart below demonstrates that China, as for<br />
o<strong>the</strong>r emerging markets, suffers from a shortage <strong>of</strong> such market and performance data and<br />
this makes it harder for investors to gauge <strong>the</strong> risks <strong>of</strong> real estate investment 26 . <strong>The</strong>re are<br />
a number <strong>of</strong> signs that <strong>the</strong> institutional risks <strong>of</strong> investing in China are being reduced, with<br />
JLL’s transparency rating improving between 2004 and 2006 due, in particular, to “more<br />
effective legal measures that address <strong>the</strong> compulsory acquisition process” 27 .<br />
UK<br />
Ireland<br />
Sweden<br />
France<br />
Ne<strong>the</strong>rlands<br />
Germany<br />
Finland<br />
Denmark<br />
Norway<br />
Portugal<br />
Spain<br />
Switzerland<br />
Italy<br />
Austria<br />
Belgium<br />
CEE<br />
Czech Republic<br />
Hungary<br />
Poland<br />
Americas<br />
US<br />
Canada<br />
Asia-Pacific<br />
Australia<br />
New Zealand<br />
Japan<br />
Africa<br />
South Africa<br />
Source: <strong>RREEF</strong> Research, IPD<br />
Chart 17: <strong>Real</strong> <strong>Estate</strong> Performance Series Availability<br />
1981 1982 1983 1984 1985 1986 1987 1988 1989 1990 1991 1992 1993 1994 1995 1996 1997 1998 1999 2000 2001 2002 2003 2004 2005 2006 2007<br />
Europe<br />
Key<br />
Established series<br />
Consultative/planned index<br />
Note: Based on <strong>the</strong> availability <strong>of</strong> real estate performance series<br />
All property index available<br />
All property index available<br />
A more fundamental indication <strong>of</strong> <strong>the</strong> reduction in institutional risks relates to <strong>the</strong> increasing<br />
liquidity <strong>of</strong> <strong>the</strong> market. Although China is <strong>the</strong> second largest real estate market in Asia, it<br />
has a relatively high owner occupation ratio, as shown on Chart 18. This high level <strong>of</strong><br />
owner occupation reduces <strong>the</strong> level <strong>of</strong> investment activity but this is set to change given<br />
<strong>the</strong> increasing desire <strong>of</strong> owner occupiers to raise capital by <strong>the</strong> sale and leaseback <strong>of</strong> <strong>the</strong>ir<br />
buildings and <strong>the</strong> increasing moves to enable domestic institutions (insurance companies<br />
and pension funds) to invest in real estate. <strong>The</strong>re are signs that <strong>the</strong>re could be greater<br />
domestic investment in commercial real estate, with recent reports that <strong>the</strong> regulator is<br />
considering widening <strong>the</strong> scope <strong>of</strong> investment such that domestic insurance companies<br />
might be able to invest in real estate alongside equities and bonds 28 . Even though <strong>the</strong><br />
restrictions remain in place, <strong>the</strong>re has been a surge <strong>of</strong> liquidity in recent years, with<br />
recorded investment activity in Shanghai and Beijing increasing seven times between 2003<br />
and 2005, reaching US$ 5.9 billion 29 . For 2006 as a whole, <strong>the</strong>re was a total <strong>of</strong> US$ 4.6<br />
billion <strong>of</strong> transactions in <strong>the</strong> two cities. <strong>The</strong> slight reduction in activity during 2006 was<br />
primarily due to <strong>the</strong> tightening <strong>of</strong> various policies on real estate by <strong>the</strong> <strong>Chinese</strong><br />
Government that had a particular impact during <strong>the</strong> second half <strong>of</strong> <strong>the</strong> year. It is likely that<br />
25 Chin et al. (2006), “An Exploratory Analysis <strong>of</strong> Barriers to Investment and <strong>Market</strong> Maturity in<br />
Sou<strong>the</strong>ast Asian Cities”, Journal <strong>of</strong> <strong>Real</strong> <strong>Estate</strong> Portfolio Management; Chen, J. and Hobbs, P (2003)<br />
“Global <strong>Real</strong> <strong>Estate</strong> Risk Index”, Journal <strong>of</strong> Portfolio Management.<br />
26 See also ULI (2006), “Emerging Trends in <strong>Real</strong> <strong>Estate</strong>: Asia Pacific 2007”, p. 12.<br />
27 Jones Lang LaSalle (2006), “<strong>Real</strong> <strong>Estate</strong> Transparency Index”, p. 8.<br />
28 Whiting, D and Zhu, C. (2007), “Insurers Poised to Spur China Commercial Property”, Reuters<br />
February 9 th<br />
29 <strong>The</strong>se estimates are based on JLL REIS’s figures on sales and purchases <strong>of</strong> commercial real estate.<br />
Although this is likely to underestimate <strong>the</strong> level <strong>of</strong> commercial investment activity, it demonstrates <strong>the</strong><br />
rapid increase in activity over recent years.<br />
<strong>RREEF</strong> Research 19
… phenomenal growth <strong>of</strong><br />
cross-border investing…<br />
<strong>the</strong>se tightening measures are part <strong>of</strong> a cyclical effort to slow <strong>the</strong> economy and it is likely<br />
that, as <strong>the</strong> tightening is relaxed, levels <strong>of</strong> investment activity will resume <strong>the</strong>ir recent<br />
strong growth. <strong>The</strong> growth <strong>of</strong> cross-border investment has been even more phenomenal.<br />
In 2006, cross-border investment reached US$ 2.2 billion, up from <strong>the</strong> barely significant<br />
US$ 67m in 2003, with <strong>the</strong> US, Singaporean and Hong Kong investors being <strong>the</strong> most<br />
active overseas investors.<br />
US$ Billion<br />
1,600<br />
1,400<br />
1,200<br />
1,000<br />
800<br />
600<br />
400<br />
200<br />
0<br />
Japan<br />
Source: <strong>RREEF</strong> Research<br />
Chart 18: Scale <strong>of</strong> key Asian Pacific <strong>Real</strong> <strong>Estate</strong> <strong>Market</strong><br />
China<br />
South Korea<br />
Investible Stock (LHS) Owner-Occupation Ratio (RHS)<br />
Closely related to <strong>the</strong>se “institutional” factors, “market” risks are also critically important in<br />
terms <strong>of</strong> performance volatility and susceptibility to supply shocks. Although long term<br />
performance series are not available for many <strong>Chinese</strong> markets, it is likely that <strong>the</strong>y<br />
behave in a similar way to o<strong>the</strong>r emerging markets, with far higher performance volatility<br />
compared with more mature markets. As explained earlier, much <strong>of</strong> this volatility is due to<br />
<strong>the</strong> emergence <strong>of</strong> real estate markets across <strong>the</strong> country, with new construction accounting<br />
for a high proportion <strong>of</strong> <strong>the</strong> existing inventory. As <strong>the</strong> markets grow in scale and critical<br />
mass, it is likely that <strong>the</strong> volatility <strong>of</strong> rental growth will be reduced. Over <strong>the</strong> longer term,<br />
<strong>the</strong> increase in <strong>the</strong> number <strong>of</strong> domestic and international investors will lead to deeper and<br />
more broad-based investor market, with a likely reduction in overall market volatility.<br />
Although this is likely over <strong>the</strong> longer term, considerable cap rate volatility can be expected<br />
over <strong>the</strong> short term as <strong>the</strong> investment market grows in scale and critical mass.<br />
<strong>RREEF</strong> Research 20<br />
Australia<br />
India<br />
Taiwan<br />
Indonesia<br />
Hong Kong<br />
Thailand<br />
Singapore<br />
New Zealand<br />
Malaysia<br />
100%<br />
90%<br />
80%<br />
70%<br />
60%<br />
50%<br />
40%<br />
30%<br />
20%<br />
10%<br />
0%
Rental growth Volatility % (1992-2006)<br />
45<br />
40<br />
35<br />
30<br />
25<br />
20<br />
15<br />
10<br />
5<br />
0<br />
Los Angeles<br />
Source: <strong>RREEF</strong> Research<br />
Chart 19: Global Office <strong>Market</strong> Volatility, 1992 – 2006, %<br />
New York<br />
San Francisco<br />
Washington DC<br />
<strong>RREEF</strong> Research 21<br />
Brussels<br />
Frankfurt<br />
London: City<br />
London: West End<br />
Madrid<br />
Paris: CBD<br />
Bejing<br />
Hong Kong<br />
Mumbai<br />
Singapore<br />
Sydney<br />
Tokyo
Huge potential in <strong>the</strong> market…<br />
…but important steps need to<br />
be taken for <strong>the</strong> country to<br />
evolve into a mature, liquid<br />
and transparent market.<br />
Fur<strong>the</strong>r research is needed<br />
into <strong>the</strong> dimensions <strong>of</strong><br />
economic change …<br />
5. Conclusions and Fur<strong>the</strong>r Research<br />
This brief overview <strong>of</strong> <strong>the</strong> <strong>Chinese</strong> real estate market demonstrates <strong>the</strong> significant changes<br />
underway as <strong>the</strong> market matures and becomes more institutional. As concluded in<br />
<strong>RREEF</strong>’s Global Insights report, “China and India are particularly attractive as emerging<br />
real estate markets given <strong>the</strong> pace <strong>of</strong> growth <strong>of</strong> <strong>the</strong>se economies” 30 . <strong>The</strong> strong growth<br />
and <strong>the</strong> structural changes underway throughout <strong>the</strong> economy, coupled with <strong>the</strong> relative<br />
shortage <strong>of</strong> all types <strong>of</strong> good quality real estate mean <strong>the</strong> medium to long term prospects<br />
for market fundamentals remain very good. Despite <strong>the</strong> huge potential for <strong>the</strong> market, a<br />
number <strong>of</strong> important steps need to be taken for <strong>the</strong> market to evolve into a mature, liquid<br />
and transparent investment, as illustrated in <strong>the</strong> table below.<br />
Source: <strong>RREEF</strong> Research<br />
Table 2: China <strong>Real</strong> <strong>Estate</strong> <strong>Market</strong> Assessment<br />
Dimension Component China <strong>Real</strong> <strong>Estate</strong> <strong>Market</strong> Assessment<br />
Overall Assessment Explanation<br />
Economy<br />
<strong>Real</strong> <strong>Estate</strong><br />
Performance<br />
<strong>Real</strong> <strong>Estate</strong> Risks<br />
Economic Growth Very Strong<br />
Economic Status Improving<br />
Fundamentals<br />
Pricing<br />
Institutional Risks<br />
<strong>Market</strong> Risks<br />
Relatively Weak, but<br />
Liquidity Improving<br />
For institutional investors, <strong>the</strong> table demonstrates that improvements need to be made to<br />
<strong>the</strong> transparency and discipline <strong>of</strong> <strong>the</strong> real estate market, and much <strong>of</strong> <strong>the</strong> responsibility for<br />
this lies with <strong>the</strong> real estate pr<strong>of</strong>ession in China. A key aspect <strong>of</strong> <strong>the</strong> maturing <strong>of</strong> <strong>the</strong> real<br />
estate market relates to more detailed research and understanding on <strong>the</strong> dimensions <strong>of</strong><br />
change within <strong>the</strong> market.<br />
This research needs to be conducted on a series <strong>of</strong> dimensions and at different levels. In<br />
terms <strong>of</strong> fur<strong>the</strong>r research into economic change, key issues relate to:<br />
� <strong>The</strong> changing nature <strong>of</strong> economic growth and <strong>the</strong> implications <strong>of</strong> this for <strong>the</strong> real<br />
estate market. As <strong>the</strong> economy shifts from being export and investment-led to<br />
being more “consumer-driven”, this will generate a different set <strong>of</strong> demand drivers<br />
for real estate across <strong>the</strong> country.<br />
� A related area for fur<strong>the</strong>r research involves <strong>the</strong> process <strong>of</strong> urbanisation and <strong>the</strong><br />
implications for social and economic infrastructure provision, and for labour<br />
availability.<br />
� A third set <strong>of</strong> macroeconomic issues relate to <strong>the</strong> transformations underway in<br />
specific economic sectors, whe<strong>the</strong>r relating to <strong>the</strong> retail, industrial, residential or<br />
<strong>of</strong>fice markets. <strong>The</strong> structural changes in each <strong>of</strong> <strong>the</strong>se sectors will shape both<br />
<strong>the</strong> level and <strong>the</strong> spatial patterns <strong>of</strong> demand for real estate.<br />
In terms <strong>of</strong> fur<strong>the</strong>r research into more specific real estate issues, <strong>the</strong>re is an equally broad<br />
set <strong>of</strong> factors that need to be addressed:<br />
30 <strong>RREEF</strong> (2006), “Global <strong>Real</strong> <strong>Estate</strong> Insights”, August, p. 33.<br />
Strong long term potential, as <strong>the</strong> economy shifts from being<br />
export and investment-led to more “consumer-driven”<br />
Relatively low GDP per capita, high business regulation, low<br />
transparency<br />
Cap rates have compressed over recent years, but have<br />
stabilized in recent months making current levels <strong>of</strong> cap rates<br />
relatively attractive compared with o<strong>the</strong>r global markets<br />
Low liquidity and limited availability <strong>of</strong> market information and<br />
performance measurement. Despite <strong>the</strong> weaknesses, <strong>the</strong><br />
increasing liquidity provides greater depth and transparency to <strong>the</strong><br />
market.<br />
Volatile rent and cap rate performance increases risks for<br />
institutional investors<br />
<strong>RREEF</strong> Research 22<br />
Strong<br />
Attractive<br />
Relatively Weak<br />
Despite short term oversupply in a number <strong>of</strong> <strong>of</strong>fice markets, <strong>the</strong><br />
shortage <strong>of</strong> modern real estate coupled with <strong>the</strong> strength <strong>of</strong><br />
demand underpin strong medium and long-term prospects
… and research into specific<br />
real estate issues… to help<br />
<strong>the</strong> market continue to mature.<br />
� On <strong>the</strong> one hand, this relates to data and information on market activity in terms<br />
<strong>of</strong> supply, demand and performance, at asset-specific and market levels.<br />
� On <strong>the</strong> o<strong>the</strong>r hand, greater research is required on <strong>the</strong> liquidity <strong>of</strong> <strong>the</strong> real estate<br />
market, and <strong>the</strong> way in which changing regulations will impact <strong>the</strong> ability <strong>of</strong> both<br />
domestic and foreign investors to hold <strong>Chinese</strong> real estate as an investment<br />
asset.<br />
A series <strong>of</strong> government and industry bodies, and commercial organisations such as<br />
<strong>RREEF</strong>, is engaged in research in <strong>the</strong>se broad areas. Toge<strong>the</strong>r, this research will help<br />
improve understanding <strong>of</strong> <strong>the</strong> changes underway in <strong>the</strong> <strong>Chinese</strong> real estate market, and<br />
will help <strong>the</strong> market become established as an integral part <strong>of</strong> China’s maturing economy<br />
and capital market.<br />
<strong>RREEF</strong> Research 23
<strong>RREEF</strong> Research 24
ANALYST CERTIFICATION<br />
<strong>The</strong> views expressed in this report accurately reflect <strong>the</strong> personal views <strong>of</strong> <strong>the</strong> undersigned<br />
lead analyst. In addition, <strong>the</strong> undersigned lead analyst has not and will not receive any<br />
compensation for providing a specific recommendation or view in this report.<br />
(Signed) Peter Hobbs<br />
<strong>RREEF</strong> Research 25
Important disclosure<br />
© 2007. All rights reserved.<br />
<strong>RREEF</strong> is <strong>the</strong> brand name <strong>of</strong> <strong>the</strong> real estate and infrastructure division for <strong>the</strong> asset management<br />
activities <strong>of</strong> Deutsche Bank AG. In <strong>the</strong> US this relates to <strong>the</strong> asset management activities <strong>of</strong> <strong>RREEF</strong><br />
America L.L.C.; in Australia: Deutsche Asset Management (Australia) Limited<br />
(ABN 11 076 098 596) Australian Financial Services licence holder; in Hong Kong: Deutsche Asset<br />
Management (Hong Kong) Limited (“DeAMHK”); in Japan: Deutsche Securities Inc.; and in <strong>the</strong> United<br />
Kingdom: <strong>RREEF</strong> Limited, Deutsche Asset Management (UK) Limited and DWS Investment Trust<br />
Managers Limited; in addition to o<strong>the</strong>r regional entities in <strong>the</strong> Deutsche Bank Group.<br />
<strong>RREEF</strong> <strong>of</strong>fers a diverse menu <strong>of</strong> investment options, including: separate accounts, core and valueadded<br />
private investment vehicles and investments in publicly-traded real estate securities. We also<br />
have an extensive track record in <strong>the</strong> property re-assignment business. An investment in real estate<br />
involves a high degree <strong>of</strong> risk and is suitable only for sophisticated investors who can bear substantial<br />
investment losses.<br />
This material is for wholesale investors only and is intended for information purposes only and does not<br />
constitute investment advice or a recommendation or an <strong>of</strong>fer or solicitation and is not <strong>the</strong> basis for any<br />
contract to purchase or sell any security or o<strong>the</strong>r instrument, or for Deutsche Bank to enter into or<br />
arrange any type <strong>of</strong> transaction as a consequence <strong>of</strong> any information contained herein. Reference to<br />
specific companies are being shown to relate regional employment to real estate prospects in <strong>the</strong> area<br />
and should not be considered a recommendation for such a company. <strong>RREEF</strong> Research is a<br />
department within <strong>RREEF</strong>. To <strong>the</strong> extent permitted by applicable law, no member <strong>of</strong> <strong>the</strong> Deutsche Bank<br />
group, or <strong>the</strong> Issuer <strong>of</strong> this document or any <strong>of</strong>ficer, employee or associate <strong>of</strong> <strong>the</strong>m accepts any liability<br />
whatsoever for any direct or consequential loss arising from any use <strong>of</strong> this presentation or its contents,<br />
including for negligence.<br />
Although <strong>the</strong> information contained in <strong>the</strong> material has been obtained from sources believed to be<br />
reliable, we do not guarantee its accuracy, completeness or fairness. Opinions expressed are our<br />
present opinions only, reflecting prevailing market conditions and are subject to change. Opinions and<br />
estimates involve a number <strong>of</strong> assumptions which may not prove valid and may be changed without<br />
notice. In preparing this material, we have relied upon and assumed without independent verification,<br />
<strong>the</strong> accuracy and completeness <strong>of</strong> all information available from public sources. Nei<strong>the</strong>r this material,<br />
nor any <strong>of</strong> its contents, may be used for any purpose without <strong>the</strong> consent and knowledge <strong>of</strong> <strong>RREEF</strong>.<br />
Past performance is not indicative <strong>of</strong> future results.<br />
For Investors in <strong>the</strong> United Kingdom:<br />
Issued in <strong>the</strong> United Kingdom by <strong>RREEF</strong> Limited. Authorised and regulated by <strong>the</strong> Financial Services<br />
Authority. This document is directed only at persons falling within <strong>the</strong> following exemptions from s.21 <strong>of</strong><br />
<strong>the</strong> United Kingdom Financial Services and <strong>Market</strong>s Act 2000 (“FSMA”): (i) authorised firms under<br />
FSMA and certain o<strong>the</strong>r investment pr<strong>of</strong>essionals falling within article 19 <strong>of</strong> <strong>the</strong> FSMA (Financial<br />
Promotion) Order, (<strong>the</strong> “FPO”); (ii) high net worth entities (not individuals) falling within article 49 FPO;<br />
and (iii) persons who receive this document outside <strong>the</strong> United Kingdom. <strong>The</strong> distribution <strong>of</strong> this<br />
document in <strong>the</strong> United Kingdom to anyone not falling within <strong>the</strong> foregoing categories is not permitted<br />
by <strong>the</strong> Issuer and may contravene FSMA. No one in <strong>the</strong> United Kingdom who is not ei<strong>the</strong>r a high net<br />
worth entity or person with pr<strong>of</strong>essional experience in matters relating to investments as referred to in<br />
<strong>the</strong> foregoing should treat this document as constituting a promotion to him, or act on it for any purpose<br />
whatsoever.<br />
For Investors in Australia and Hong Kong:<br />
An investment with <strong>RREEF</strong> is not a deposit with or any o<strong>the</strong>r type <strong>of</strong> liability <strong>of</strong> Deutsche Bank AG<br />
ARBN 064 165 162, Deutsche Asset Management (Australia) Limited or Deutsche Asset Management<br />
(Hong Kong) Limited or any o<strong>the</strong>r member <strong>of</strong> <strong>the</strong> Deutsche Bank AG Group and <strong>the</strong> capital value <strong>of</strong><br />
and performance <strong>of</strong> an investment with <strong>RREEF</strong> is not in any way guaranteed by Deutsche Bank AG,<br />
Deutsche Asset Management (Australia) Limited or Deutsche Asset Management (Hong Kong)<br />
Limited or any o<strong>the</strong>r member <strong>of</strong> <strong>the</strong> Deutsche Bank AG Group. Investments are subject to investment<br />
risk, including possible delays in repayment and loss <strong>of</strong> income and principal invested.<br />
For Investors in Dubai:<br />
This information has been provided to you by Deutsche Bank AG Dubai branch, an Authorised Firm<br />
regulated by <strong>the</strong> Dubai Financial Services Authority. It is solely directed at wholesale clients <strong>of</strong><br />
Deutsche Bank AG Dubai branch, who Deutsche Bank AG Dubai branch is satisfied meet <strong>the</strong><br />
regulatory criteria as established by <strong>the</strong> Dubai Financial Services Authority.<br />
<strong>RREEF</strong> Research 26
<strong>RREEF</strong> Research 27
Mars # 19859<br />
Main Offices<br />
London<br />
1 Appold Street<br />
Broadgate<br />
London, EC2A 2UU<br />
United Kingdom<br />
Tel: +44 20 7545 8000<br />
Eschborn<br />
Mergenthalerallee 73-75<br />
65760 Eschborn<br />
Germany<br />
Tel: +49 69 71704 906<br />
San Francisco<br />
101 California Street<br />
26th Floor<br />
San Francisco, CA 94111<br />
United States<br />
Tel: +1 415 781 3300<br />
Chicago<br />
875 N. Michigan Avenue<br />
41st Floor<br />
Chicago, IL 60611<br />
United States<br />
Tel: +1 312 266 9300<br />
New York<br />
280 Park Avenue<br />
40th Floor<br />
New York, NY10017-1270<br />
United States<br />
Tel: +1 212 454 3900<br />
Publication Address:<br />
<strong>RREEF</strong> Limited<br />
1 Appold Street<br />
Broadgate<br />
London EC2A 2UU<br />
Internet:<br />
www.rreef.com<br />
Additional information is<br />
available upon request<br />
<strong>RREEF</strong> <strong>Real</strong> <strong>Estate</strong> Research<br />
A member <strong>of</strong> <strong>the</strong> Deutsche Bank Group<br />
1 Appold Street, Broadgate, London EC2A 2UU Tel: +44 20 7545 8000<br />
Peter Hobbs<br />
Global Head <strong>of</strong> Research<br />
+44 20 7547 4855<br />
Europe <strong>The</strong> Americas<br />
Brenna O’Roarty Alan Billingsley<br />
Director Director<br />
+44 20 7545 6099 +1 415 262 2017<br />
Maren Väth Hope Nadji<br />
Vice President Director<br />
+49 69 717 04 204 +1 415 262 2022<br />
Henry (Wei) Chin Stephen Newbold<br />
Assistant Vice President Vice President<br />
+44 20 7545 6611 +1 415 262 2040<br />
Ermina Topintzi Brooks Wells<br />
Assistant Vice President Vice President<br />
+44 20 7545 6674 +1 212 454 6437<br />
Lonneke Löwik<br />
Assistant Vice President<br />
+44 20 7545 6328<br />
Susannah Hunter<br />
Assistant Vice President<br />
+44 20 7547 3305 Hong Kong<br />
Tan Yen Keng<br />
Vice President<br />
+852 2203 8062<br />
<strong>RREEF</strong> Research 28