Infrastructure Investments in Renewable Energy - RREEF Real Estate
Infrastructure Investments in Renewable Energy - RREEF Real Estate
Infrastructure Investments in Renewable Energy - RREEF Real Estate

Create successful ePaper yourself
Turn your PDF publications into a flip-book with our unique Google optimized e-Paper software.
September 2009<br />
Table of Contents:<br />
Introduction ...............................1<br />
Why <strong>Renewable</strong>s?....................1<br />
<strong>Energy</strong> Market Conditions ........3<br />
Macroeconomic Trends ............5<br />
Size of <strong>Renewable</strong>s<br />
by Region.............................10<br />
by Sector..............................12<br />
Deal Flow<br />
Closed Transactions ............14<br />
Pipel<strong>in</strong>e Transactions ..........18<br />
Comparative Performance......20<br />
<strong>Renewable</strong> <strong>Energy</strong><br />
<strong>Infrastructure</strong> Sectors ..........23<br />
Case Study ..........................26<br />
Conclusions and<br />
Implications for Investors .......26<br />
Prepared By:<br />
Asieh Mansour<br />
Chief Economist & Strategist<br />
San Francisco<br />
USA<br />
(415) 262-2044<br />
asieh.mansour@rreef.com<br />
Stella Yun Xu<br />
Assistant Vice President<br />
San Francisco<br />
USA<br />
(415) 262-7715<br />
stella-yun.xu@rreef.com<br />
Mark Fulton<br />
Global Head of Climate Change<br />
Investment Research<br />
New York<br />
USA<br />
(212) 454-7881<br />
mark.fulton@db.com<br />
Production By:<br />
Michelle Woods<br />
<strong>RREEF</strong> Research<br />
<strong>Infrastructure</strong> <strong>Investments</strong> <strong>in</strong> <strong>Renewable</strong><br />
<strong>Energy</strong><br />
Introduction<br />
<strong>Infrastructure</strong> funds are <strong>in</strong>creas<strong>in</strong>gly target<strong>in</strong>g renewable energy <strong>in</strong>vestments. Such renewable<br />
assets cover a wide range of low carbon emitt<strong>in</strong>g sources of energy <strong>in</strong>clud<strong>in</strong>g w<strong>in</strong>d, solar,<br />
biomass and hydropower. The <strong>in</strong>vestment rationale is compell<strong>in</strong>g given the macroeconomic<br />
environment surround<strong>in</strong>g the energy market <strong>in</strong> general. This <strong>in</strong>cludes projections of a<br />
cont<strong>in</strong>ued rise <strong>in</strong> demand for energy, <strong>in</strong>creases <strong>in</strong> fossil fuel prices, heightened security<br />
concerns regard<strong>in</strong>g exist<strong>in</strong>g sources of energy, and environmental concerns regard<strong>in</strong>g the use<br />
of such fossil fuels. <strong>Renewable</strong> energy <strong>in</strong>frastructure assets also share many of the same<br />
characteristics of other regulated economic <strong>in</strong>frastructure <strong>in</strong>vestments, namely quasi-monopoly<br />
assets with steady <strong>in</strong>come streams and high barriers to entry. A variety of funds are available<br />
to <strong>in</strong>vestors who want to access the renewable energy <strong>in</strong>frastructure market. Such funds are<br />
either private or public and may be <strong>in</strong> the form of debt, equity or project f<strong>in</strong>ance. A vast majority<br />
of the <strong>in</strong>vestments <strong>in</strong> renewables are part of a broader <strong>in</strong>frastructure portfolio and as such are<br />
actively managed.<br />
In this paper, we review the renewable energy <strong>in</strong>frastructure market. The first section<br />
highlights the evidence surround<strong>in</strong>g climate change and the carbon footpr<strong>in</strong>t of fossil fuels.<br />
This is followed by an analysis of the current and projected demand for energy and the various<br />
sources of supply. The macroeconomic trends section focuses on the variables that should<br />
drive the growth and demand for renewable sources of energy <strong>in</strong> the future. The report also<br />
provides the latest data on the size of the exist<strong>in</strong>g renewables market disaggregated by sector<br />
and region. This is followed by an updated deal flow analysis where both closed and pipel<strong>in</strong>e<br />
project f<strong>in</strong>ance deals are analyzed. Data on privately-held renewable energy <strong>in</strong>frastructure<br />
returns is not publicly available, therefore, <strong>in</strong> the follow<strong>in</strong>g comparative return performance<br />
section, we use data on listed renewables to exam<strong>in</strong>e the performance characteristics of such<br />
energy <strong>in</strong>vestments. The historical returns and volatility of listed renewables are then<br />
compared to traditional asset classes such as bonds and equities. Correlation coefficients are<br />
also provided to assess the role of renewable energy <strong>in</strong>vestments <strong>in</strong> a broader multi-asset<br />
portfolio. We complete this section with a detailed look at the top three renewable energy<br />
sectors—w<strong>in</strong>d, solar, and biomass—provid<strong>in</strong>g an analysis of their relative performance s<strong>in</strong>ce<br />
2006. Conclusions and implications for <strong>in</strong>vestors end the report.<br />
Why <strong>Renewable</strong>s?<br />
Human activity around the world, primarily from fossil fuel use and agricultural output, are<br />
contribut<strong>in</strong>g to <strong>in</strong>creas<strong>in</strong>g atmospheric concentrations of carbon dioxide (CO2) and other<br />
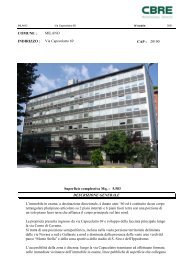
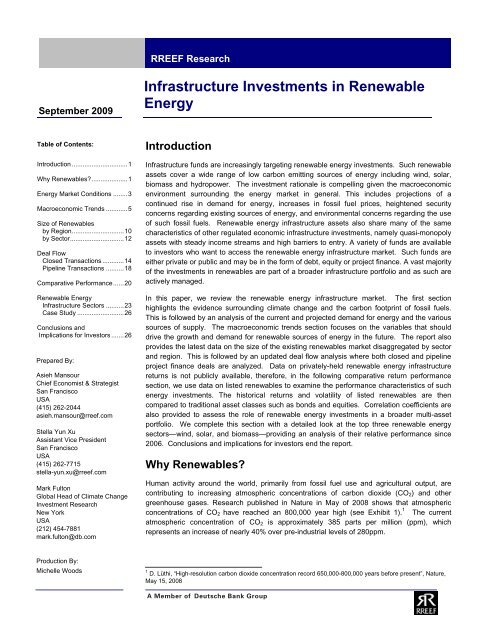
greenhouse gases. Research published <strong>in</strong> Nature <strong>in</strong> May of 2008 shows that atmospheric<br />
concentrations of CO2 have reached an 800,000 year high (see Exhibit 1). 1 The current<br />
atmospheric concentration of CO2 is approximately 385 parts per million (ppm), which<br />
represents an <strong>in</strong>crease of nearly 40% over pre-<strong>in</strong>dustrial levels of 280ppm.<br />
1<br />
D. Lüthi, “High-resolution carbon dioxide concentration record 650,000-800,000 years before present”, Nature,<br />
May 15, 2008
Atmospheric CO 2 concentration, ppm<br />
400<br />
380<br />
360<br />
340<br />
320<br />
300<br />
280<br />
260<br />
240<br />
220<br />
200<br />
180<br />
160<br />
Exhibit 1<br />
CO 2 Concentration for the Last 800,000 Years<br />
800,000 700,000 600,000 500,000 400,000 300,000 200,000 100,000 0<br />
Years before present<br />
Concentration <strong>in</strong> 2008: 385 ppm<br />
Source: DB Advisors, "Invest<strong>in</strong>g <strong>in</strong> Climate Change 2009 – Necessity and Opportunity <strong>in</strong> Turbulent Times", Deutsche Bank<br />
Group, October 2008<br />
The rate of future rises <strong>in</strong> greenhouse gas concentrations will depend on economic,<br />
technological and social factors. If no changes are made, concentrations of CO2 could<br />
<strong>in</strong>crease to as much as 630ppm by 2050 and 1,200ppm by the end of the century 2 .<br />
Accord<strong>in</strong>g to many scientific studies, net concentrations of greenhouse gases should not<br />
permanently exceed 450ppm CO2 equivalent because beyond that po<strong>in</strong>t it becomes<br />
<strong>in</strong>creas<strong>in</strong>gly likely that a series of macro-climatic shifts will set up a self-susta<strong>in</strong><strong>in</strong>g cycle of<br />
rapid global warm<strong>in</strong>g. Without significant and immediate action, <strong>in</strong>creas<strong>in</strong>g atmospheric<br />
concentrations of CO2 could lead to extensive and costly damage to regional climates<br />
throughout the world. Projections of future climate change suggest a global temperature<br />
<strong>in</strong>crease of between 1 to 6 degrees Celsius by 2100. 3 The magnitude of the potential warm<strong>in</strong>g<br />
varies accord<strong>in</strong>g to different forecasts. The Stern Review on The Economics of Climate<br />
Change, a report released <strong>in</strong> October 2006 by economist Lord Stern of Brentford for the British<br />
government concludes that ecosystems, water supply, sea-levels, agriculture and health are all<br />
likely to suffer from cont<strong>in</strong>ued climate change under bus<strong>in</strong>ess-as-usual conditions.<br />
There is now almost total consensus among the scientific community that the warm<strong>in</strong>g of the<br />
climate observed over the past 50 years is primarily due to human-<strong>in</strong>duced emissions of<br />
heat-trapp<strong>in</strong>g gases. Governments worldwide have determ<strong>in</strong>ed that it is critical to act now to<br />
mitigate further climate change and f<strong>in</strong>d alternatives to coal, oil, gas and other fossil fuels that<br />
have been used s<strong>in</strong>ce antiquity to meet grow<strong>in</strong>g energy demand. As a result, government<br />
regulations which <strong>in</strong>clude carbon pric<strong>in</strong>g, traditional regulation and <strong>in</strong>novation policy have<br />
become major drivers of <strong>in</strong>vestment opportunities for renewable energy. The International<br />
<strong>Energy</strong> Agency (IEA) estimates <strong>in</strong> their BLUE scenario, which calls for a 50% reduction <strong>in</strong> CO2<br />
emissions from 2005 levels by 2050, 4 that about $45 trillion of <strong>in</strong>cremental expenditure will be<br />
needed to develop and deploy new clean technologies between now and 2050. To many, this<br />
significant need represents noth<strong>in</strong>g less than the potential to unleash a low-carbon Industrial<br />
Revolution. 5<br />
At the same time, governments are also <strong>in</strong>terested <strong>in</strong> energy security, look<strong>in</strong>g for clean and<br />
diverse sources of energy. <strong>Renewable</strong>s provide a local source of energy which is clean, and<br />
diversifies the overall fuel mix. Grow<strong>in</strong>g concerns about the security of energy supplies,<br />
2<br />
DB Climate Change Advisors, CO2 measures is def<strong>in</strong>ed as the concentration of CO2 that would cause the same<br />
amount of radiative forc<strong>in</strong>g as the observed mixture of CO2 and other forc<strong>in</strong>g components <strong>in</strong> the atmosphere at<br />
any po<strong>in</strong>t <strong>in</strong> time - compar<strong>in</strong>g them <strong>in</strong> terms of their <strong>in</strong>stantaneous radiative effect.<br />
3<br />
DB Advisors, “Invest<strong>in</strong>g <strong>in</strong> Climate Change 2009 – Necessity and Opportunity <strong>in</strong> Turbulent Times”, Deutsche<br />
Bank Group, October 2008<br />
4<br />
The BLUE scenario is consistent with long-term stabilization of atmospheric greenhouse gas concentrations at a<br />
level below that where there would be a more than 50% change of temperature <strong>in</strong>creases above 2 degrees C,<br />
which is identified as a dangerous tipp<strong>in</strong>g po<strong>in</strong>t.<br />
5<br />
OECD/IEA, World <strong>Energy</strong> Outlook 2008<br />
2 Alternative <strong>Investments</strong>
particularly <strong>in</strong> Europe, will lead to more focus on renewable <strong>in</strong>vestment. Over 70% of the<br />
world’s oil reserves are held <strong>in</strong> regions with significant geopolitical risk, driv<strong>in</strong>g many countries<br />
to reduce their exposure to energy supply <strong>in</strong>terruptions through the development of domestic<br />
renewable sources. 6 Accord<strong>in</strong>gly, we expect to see a secular growth trend <strong>in</strong> renewable<br />
energy <strong>in</strong>vestment opportunities.<br />
<strong>Energy</strong> Market Conditions<br />
Bus<strong>in</strong>ess as Usual Projections<br />
There is now overwhelm<strong>in</strong>g evidence that our climate is chang<strong>in</strong>g due to <strong>in</strong>creas<strong>in</strong>g<br />
atmospheric concentrations of greenhouse gases. The combustion of fossil fuels accounts for<br />
nearly 60% of anthropogenic greenhouse gas emissions and 88% of the world’s primary<br />
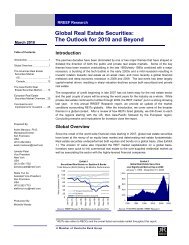
energy. 7 Accord<strong>in</strong>g to IEA’s reference scenarios and the US Department of <strong>Energy</strong> (DoE),<br />
world energy demand is expected to <strong>in</strong>crease significantly over the next 20 years, <strong>in</strong>creas<strong>in</strong>g<br />
by 45% between 2006 and 2030, with an average annual rate of growth of 1.7% which is<br />
slower than the average growth of 1.9% per year from 1980 to 2006 (see Exhibit 2). Much of<br />
the demand <strong>in</strong> energy will likely be supplied by fossil fuels, unless clean energy sources can<br />
scale up production rapidly.<br />
Billion tonnes of oil equivalent<br />
18<br />
16<br />
14<br />
12<br />
10<br />
8<br />
6<br />
4<br />
2<br />
- 0<br />
CAGR = 1.7%<br />
Exhibit 2<br />
World <strong>Energy</strong> Demand<br />
1980 2000 2006 2015 2030<br />
Source: OECD/IEA, World <strong>Energy</strong> Outlook 2008<br />
Other <strong>Renewable</strong>s<br />
Biomass and Waste<br />
� Coal: The demand for coal will <strong>in</strong>crease by 2% per year on average, its share <strong>in</strong> global<br />
energy mix climb<strong>in</strong>g from 26% <strong>in</strong> 2006 to 29% <strong>in</strong> 2030. Most of the <strong>in</strong>crease <strong>in</strong> demand for<br />
coal can be attributed to the power-generation sector. Ch<strong>in</strong>a and India together contribute<br />
nearly 85% to the <strong>in</strong>crease <strong>in</strong> world coal demand from 1980 to 2030. 8<br />
� Oil: Oil rema<strong>in</strong>s the dom<strong>in</strong>ant fuel <strong>in</strong> the primary energy mix, but its share drops to 30% <strong>in</strong><br />
2030, from 34% <strong>in</strong> 2006. Oil demand grows far more slowly than demand for other fossil<br />
fuels, ma<strong>in</strong>ly because of high f<strong>in</strong>al prices.<br />
� Gas: Gas demand is expected to <strong>in</strong>creases at 1.8% per year over the projected period<br />
and its share <strong>in</strong> world primary energy will grow to 22% by 2030. New power plants, us<strong>in</strong>g<br />
high-efficiency gas turb<strong>in</strong>e technology, meet the bulk of <strong>in</strong>cremental gas demand.<br />
� Nuclear: Conversely, the share of nuclear power is expected to decrease over the period,<br />
from 6% today to 5% <strong>in</strong> 2030, assum<strong>in</strong>g national policies towards nuclear power rema<strong>in</strong><br />
unchanged. Nuclear output nonetheless is anticipated to <strong>in</strong>creases <strong>in</strong> absolute terms <strong>in</strong><br />
most develop<strong>in</strong>g countries, with the largest growth tak<strong>in</strong>g place <strong>in</strong> develop<strong>in</strong>g Asia.<br />
6<br />
REN 21.2009. <strong>Renewable</strong>s Global Status Report: 2009 Update (Paris: REN 21 Secretariat)<br />
7<br />
DB Advisors, “Invest<strong>in</strong>g <strong>in</strong> Climate Change 2009 – Necessity and Opportunity <strong>in</strong> Turbulent Times”, Deutsche<br />
Bank Group, October 2008<br />
8<br />
OECD/IEA, World <strong>Energy</strong> Outlook 2008<br />
Alternative <strong>Investments</strong> 3<br />
Hydro<br />
Nuclear<br />
Gas<br />
Oil<br />
Coal
� Hydropower: Hydropower is an important source of electricity production and its share of<br />
primary demand is expected to rema<strong>in</strong> constant at 2%. Hydropower’s share <strong>in</strong> global<br />
electricity generation, however, drops two percentage po<strong>in</strong>ts to 14% <strong>in</strong> 2030.<br />
� Biomass: The use of biomass and waste for energy is expected to <strong>in</strong>crease by 1.4% per<br />
year. In OECD, the use of biomass for power generation is expected to grow at 5.4%<br />
annually.<br />
� Other <strong>Renewable</strong>s: Other renewables, a category which <strong>in</strong>cludes w<strong>in</strong>d, solar,<br />
geothermal, tidal and wave energy, is expected to grow faster than any other energy<br />
source, at an average rate of 7.2% per year over the projection period. However, the<br />
share of other renewables <strong>in</strong> total power generation only grows from 1% <strong>in</strong> 2006 to 4% <strong>in</strong><br />
2030. 9<br />
<strong>Energy</strong> demand <strong>in</strong> non-OECD countries exceeded that <strong>in</strong> OECD countries <strong>in</strong> 2005 for the first<br />
time. Non-OECD countries are expected to account for nearly 87% of the <strong>in</strong>crease <strong>in</strong> global<br />
demand between 2006 and 2030, driven ma<strong>in</strong>ly by brisk growth <strong>in</strong> Ch<strong>in</strong>a and India. As a result,<br />
the non-OECD share of world primary energy demand is projected to rise from 51% <strong>in</strong> 2006 to<br />
62% by 2030. OECD countries will account for approximately 46% of the global <strong>in</strong>crease <strong>in</strong> the<br />
use of renewables. Oil demand is expected to fall slightly for the region, while gas and nonhydro<br />
renewables are expected to make up most of the <strong>in</strong>crease <strong>in</strong> energy demand. Currently,<br />
the 61% contribution of biomass and other non-hydro renewables to <strong>in</strong>cremental energy<br />
demand <strong>in</strong> OECD countries is <strong>in</strong> the form of modern technologies, mostly w<strong>in</strong>d. 10<br />
In the absence of major regulatory changes, the IEA forecasts a 130% <strong>in</strong>crease <strong>in</strong> CO2<br />
emissions, compared to 2005 levels. This is partly because coal is considered to be plentiful <strong>in</strong><br />
the long-run and low coal prices can have serious implications for greenhouse gas mitigation.<br />
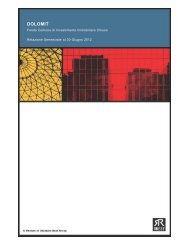
In order to reduce greenhouse gas emissions 50% below 2005 levels by 2050, the IEA<br />
estimates that an <strong>in</strong>cremental $45 trillion will need to be <strong>in</strong>vested <strong>in</strong> renewable energy. 11 This<br />
will, <strong>in</strong> turn, lead to a mean<strong>in</strong>gful scale-up of renewable power generation. <strong>Renewable</strong> energy<br />
sources have the potential to comprise 46% of total electricity supply by 2050 from 18% <strong>in</strong><br />
2006 (see Exhibit 3) accord<strong>in</strong>g to the IEA’s BLUE scenario.<br />
Exhibit 3<br />
Scenario Which Targets a 50% Reduction <strong>in</strong> Global CO2 Emissions from 2005 Level by 2030<br />
<strong>Renewable</strong> Power Generation (Twh/yr)<br />
20,000<br />
18,000<br />
16,000<br />
14,000<br />
12,000<br />
10,000<br />
8,000<br />
6,000<br />
4,000<br />
2,000<br />
2000 2005 2010 2015 2020 2025 2030 2035 2040 2050<br />
Source: OECD/IEA, 2008, Technology Perspectives<br />
The need to control greenhouse gas emissions, improve energy security, and reduce energy<br />
price <strong>in</strong>creases has led governments around the world to adopt regulatory mechanisms to<br />
9<br />
OECD/IEA, World <strong>Energy</strong> Outlook 2008<br />
10<br />
OECD/IEA, World <strong>Energy</strong> Outlook 2008<br />
11<br />
Economic Stimulus: The Case for Green <strong>Infrastructure</strong>, <strong>Energy</strong> Security and Green Jobs, DB Advisors,<br />
November 2008<br />
4 Alternative <strong>Investments</strong><br />
Other<br />
Tidal<br />
Geothermal<br />
Biomass, Waste<br />
Solar CSP<br />
Solar PV<br />
W<strong>in</strong>d<br />
Hydro
support the development of renewable-energy sources. Currently, governments use three<br />
ma<strong>in</strong> sets of regulatory tools to address climate change and the need for alternative sources of<br />
energy: 1) carbon pric<strong>in</strong>g 2) traditional regulation (mandates and standards) and 3) <strong>in</strong>novation<br />
policy (<strong>in</strong>centives and subsidies). 12 Among the three broad categories, we believe that carbon<br />
pric<strong>in</strong>g, used to <strong>in</strong>ternalize the external variable of climate change, is the most effective longterm<br />
policy. While traditional regulation corrects market failures and <strong>in</strong>novation policy can<br />
<strong>in</strong>centivize the development of new technologies, neither of those regulatory tools effectively<br />
prices the long-term externality associated with greenhouse gas emissions. 13<br />
Macroeconomic Trends<br />
As scientific evidence becomes more conclusive, policy makers globally are <strong>in</strong>creas<strong>in</strong>gly<br />
focused on the hazards of climate change and the need to develop non-exhaustible,<br />
susta<strong>in</strong>able, sources of energy. Alternative sources of energy which are typically carbon free<br />
have ga<strong>in</strong>ed prom<strong>in</strong>ence as a solution. As mentioned <strong>in</strong> the <strong>in</strong>troduction, such alternatives are<br />
renewable sources of energy generated from natural resources, <strong>in</strong>clud<strong>in</strong>g hydro, solar<br />
(photovoltaic and thermal), w<strong>in</strong>d, geothermal, tidal, biofuels, and waste-to-energy processes.<br />
This is <strong>in</strong> contrast to conventional sources of energy such as oil, gas, coal, and <strong>in</strong> some cases,<br />
nuclear. The majority of conventional sources of energy is “exhaustible” and will lead to<br />
greenhouse gases such as CO2 and methane as depicted <strong>in</strong> Exhibit 2.<br />
Analysts view today’s renewable energy <strong>in</strong>dustry as almost a guaranteed-growth sector,<br />
supported by three underly<strong>in</strong>g global mega-trends. These dynamic drivers <strong>in</strong>clude:<br />
1. More str<strong>in</strong>gent climate change agendas<br />
2. Dw<strong>in</strong>dl<strong>in</strong>g fossil fuel stocks<br />
3. Heightened concerns over the security of energy supplies<br />
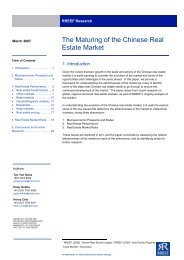
These drivers rema<strong>in</strong> valid<br />
today and have been<br />
responsible for the growth<br />
of the renewables market to<br />
$120 billion <strong>in</strong> 2008, despite<br />
the unfold<strong>in</strong>g of a major<br />
f<strong>in</strong>ancial crisis (see Exhibit<br />
4). High oil and natural gas<br />
prices <strong>in</strong> 2007 and 2008<br />
were a secondary factor,<br />
driv<strong>in</strong>g up <strong>in</strong>vestments <strong>in</strong><br />
renewables dur<strong>in</strong>g this<br />
period. Security concerns<br />
Exhibit 4<br />
Global Investment <strong>in</strong> <strong>Renewable</strong> <strong>Energy</strong>, 2004-2008*<br />
140<br />
120<br />
100<br />
80<br />
60<br />
40<br />
20<br />
0<br />
2004 2005 2006 2007 2008<br />
about energy supplies cont<strong>in</strong>ue to <strong>in</strong>tensify. Over 70% of the world’s oil reserves are held <strong>in</strong><br />
regions with significant geopolitical risk. This should drive oil-import<strong>in</strong>g countries to lower their<br />
dependence on oil by diversify<strong>in</strong>g <strong>in</strong>to domestic sources of renewable energy.<br />
Major shifts <strong>in</strong> the global economy and f<strong>in</strong>ancial landscape have impacted the renewables<br />
sector more recently, however. The decl<strong>in</strong>e <strong>in</strong> oil prices <strong>in</strong> the second half of 2008 and early<br />
2009 has curtailed <strong>in</strong>vestment activity <strong>in</strong> the sector. <strong>Renewable</strong>s have not been immune to the<br />
impact of the f<strong>in</strong>ancial crisis either, as a variety of f<strong>in</strong>anc<strong>in</strong>g sources have dried up.<br />
12<br />
DB Advisors, “Invest<strong>in</strong>g <strong>in</strong> Climate Change 2009 – Necessity and Opportunity <strong>in</strong> Turbulent Times”, Deutsche<br />
Bank Group, October 2008<br />
13<br />
DB Advisors, “Invest<strong>in</strong>g <strong>in</strong> Climate Change 2009 – Necessity and Opportunity <strong>in</strong> Turbulent Times”, Deutsche<br />
Bank Group, October 2008<br />
Alternative <strong>Investments</strong> 5<br />
US$ Billions<br />
*Figure <strong>in</strong>cludes project f<strong>in</strong>ance and non-project f<strong>in</strong>ance deals<br />
Source: REN 21.2009. <strong>Renewable</strong>s Global Status Report: 2009 Update (Paris: REN 21 Secretariat)
Economic Characteristics of <strong>Renewable</strong> <strong>Energy</strong> Assets<br />
The economic characteristics of renewable energy differentiate them significantly from fossil<br />
fuel energy assets. Much of the difference stems from the operational cost structure of each<br />
source of energy. <strong>Renewable</strong> energy assets are characterized by three key stylized economic<br />
facts.<br />
� Large fixed costs and low/no variable costs. These <strong>in</strong>vestments are characterized by<br />
very high upfront capital costs, similar to many types of <strong>in</strong>frastructure assets. <strong>Renewable</strong>s<br />
are characterized by a downward-slop<strong>in</strong>g average cost curve which implies that average<br />
costs are highly dependent on output level. With a decl<strong>in</strong><strong>in</strong>g cost structure, marg<strong>in</strong>al costs<br />
will be lower than average costs. This is a key characteristic of “natural monopolies”<br />
where economies of scale dom<strong>in</strong>ate the cost structure. Such large <strong>in</strong>itial fixed costs also<br />
act as a barrier to entry. In addition, <strong>in</strong> the case of w<strong>in</strong>d and solar energy <strong>in</strong>frastructure,<br />
the barriers to entry are more a result of plann<strong>in</strong>g/permitt<strong>in</strong>g restrictions. Individual<br />
w<strong>in</strong>d/solar projects can be relatively small as compared to conventional <strong>in</strong>frastructure<br />
assets.<br />
� Substantial upfront capital expenditures. The costs of renewables are almost entirely<br />
capital costs which are front-loaded. The <strong>in</strong>itial high capex is required prior to any<br />
generation of energy.<br />
� Low variable costs. <strong>Renewable</strong> energy assets have no fuel costs. The only ongo<strong>in</strong>g<br />
costs are ma<strong>in</strong>tenance and operations. This is <strong>in</strong> contrast to fossil fuel power stations<br />
which have significant fuel costs. These fuel costs are considered variable and rise<br />
significantly with output levels across traditional fossil fuel power stations.<br />
The cost structure of renewables has significant implications for f<strong>in</strong>anc<strong>in</strong>g decisions. When a<br />
renewable power station is constructed, the front-loaded fixed costs means that the electricity<br />
is effectively pre-paid for the life of the asset. In this case, long-term debt f<strong>in</strong>anc<strong>in</strong>g is<br />
appropriate and optimal.<br />
Economic Drivers of <strong>Renewable</strong>s<br />
There are four key factors that determ<strong>in</strong>e the attractiveness of <strong>in</strong>vestments <strong>in</strong> renewable<br />
energy <strong>in</strong>frastructure, 14 <strong>in</strong>clud<strong>in</strong>g:<br />
1. The cost of oil and other fossil fuels<br />
2. The cost of capital<br />
3. The cost of carbon emissions (to the extent that carbon costs are <strong>in</strong>ternalized through<br />
a system of cap and trade or a carbon tax)<br />
4. Government <strong>in</strong>centives/subsidies provided to producers of renewable energy<br />
In the next four sections, we look at the current market conditions surround<strong>in</strong>g each economic<br />
factor. We then follow this with projections of the likely trends for each driver <strong>in</strong> Exhibit 6.<br />
1. Oil and Fossil Fuel Prices<br />
<strong>Renewable</strong>s are an alternative or “substitute” source of energy to fossil fuels. The higher the<br />
price of fossil fuels, the more economically viable are renewable sources of energy. The price<br />
outlook for key fossil fuels such as oil and natural gas is critical to the long-term outlook for<br />
renewables. Exhibit 5 tracks the historic and projected movement <strong>in</strong> both oil and natural gas<br />
prices.<br />
14<br />
This section is largely adapted from Geoffrey Heal, “The Economics of <strong>Renewable</strong> <strong>Energy</strong>,” NBER, Work<strong>in</strong>g<br />
Paper 15081, June 2009<br />
6 Alternative <strong>Investments</strong>
US$ per barrel<br />
120<br />
100<br />
80<br />
60<br />
40<br />
20<br />
Oil<br />
2000 2004 2008 2012 2016 2019<br />
Source: Global Insight<br />
Exhibit 5<br />
The Trajectory of Oil and Natural Gas Prices, 2000-2019<br />
Forecast<br />
Natural Gas<br />
Forecast<br />
Alternative <strong>Investments</strong> 7<br />
$ per million BTUs<br />
12<br />
10<br />
8<br />
6<br />
4<br />
2<br />
2000 2004 2008 2012 2016 2019<br />
Crude oil and natural gas prices are highly volatile. This volatility characterizes both markets<br />
s<strong>in</strong>ce <strong>in</strong> each case supply and demand are highly <strong>in</strong>elastic with respect to price while demand<br />
is highly <strong>in</strong>come-elastic. This implies that changes <strong>in</strong> <strong>in</strong>come lead to changes <strong>in</strong> demand,<br />
where the new equilibrium requires a large movement <strong>in</strong> price.<br />
High oil and natural gas prices were factors driv<strong>in</strong>g the robust pace of <strong>in</strong>vestment <strong>in</strong><br />
renewables <strong>in</strong> 2007 and 2008. The fall <strong>in</strong> oil and natural gas prices <strong>in</strong> late 2008 and early<br />
2009 was also widely viewed as a factor driv<strong>in</strong>g down <strong>in</strong>vestments <strong>in</strong> renewables more<br />
recently.<br />
The projections for oil and natural gas prices are critical to the outlook for renewables. In the<br />
near term, the collapse <strong>in</strong> the global economy has led to weak demand for energy. Weak<br />
demand comb<strong>in</strong>ed with relatively high <strong>in</strong>ventories should weigh on oil and natural gas prices<br />
through 2010. As economic recovery ga<strong>in</strong>s traction by late 2010 and firms up even more by<br />
2011, especially among energy-importers, we expect a significant rebound <strong>in</strong> oil and natural<br />
gas prices. Follow<strong>in</strong>g a period of <strong>in</strong>tense concern around supply, the potential strength of the<br />
demand recovery should support much higher fuel prices <strong>in</strong> 2011 and beyond. We also expect<br />
a structural <strong>in</strong>crease <strong>in</strong> demand for energy, primarily from Asian emerg<strong>in</strong>g markets. This<br />
implies that oil and gas prices are likely to rema<strong>in</strong> at relatively high levels. This is also<br />
supported by our demand and supply analysis of the broader energy markets <strong>in</strong> the preced<strong>in</strong>g<br />
section.<br />
2. Capital Costs<br />
Given the large fixed-cost nature of renewable <strong>in</strong>frastructure assets, the cost of capital is<br />
critical to the economic feasibility of these projects. Effectively, the cost of renewables is<br />
almost entirely capital costs. The capital cost per megawatt of renewables capacity is often<br />
higher than that of power generated by fossil fuels. The higher cost of capital <strong>in</strong> the current<br />
environment has made renewables less economically viable. As a result of the current<br />
f<strong>in</strong>ancial crisis, it has become very difficult to f<strong>in</strong>ance large-scale, capital-<strong>in</strong>tensive renewable<br />
energy <strong>in</strong>frastructure projects. Many of the banks specializ<strong>in</strong>g <strong>in</strong> the underwrit<strong>in</strong>g of such<br />
projects have been hit hard by this crisis. In the current environment, it is hard to f<strong>in</strong>ance any<br />
project. Arguably, smaller ones are more difficult to obta<strong>in</strong> f<strong>in</strong>anc<strong>in</strong>g than larger ones. Our<br />
expectation, however, is that as the f<strong>in</strong>ancial crisis ends, as banks repair their impaired<br />
balance sheets and as banks become profitable, f<strong>in</strong>anc<strong>in</strong>g will become more readily available<br />
for such large-scale <strong>in</strong>frastructure assets.<br />
3. Carbon Pric<strong>in</strong>g<br />
At the center of climate policy is carbon pric<strong>in</strong>g. Pric<strong>in</strong>g greenhouse gas emissions <strong>in</strong>ternalizes<br />
the externality that is the cause of global warm<strong>in</strong>g. This pric<strong>in</strong>g can be accomplished either<br />
through a carbon tax or cap-and-trade.
A number of geographies have announced carbon taxes. A carbon tax establishes a price for<br />
carbon, aim<strong>in</strong>g to encourage a set amount of mitigation, or reduction <strong>in</strong> emissions when<br />
compared to bus<strong>in</strong>ess-as-usual levels. While “guess<strong>in</strong>g” the price of carbon to get to mitigation<br />
may be suboptimal, proponents of a carbon tax argue that its greater price stability reduces<br />
carbon price risk and encourages greater <strong>in</strong>vestment <strong>in</strong> alternative energy.<br />
Cap-and-trade sets a limit on emissions which is achieved when a central authority creates a<br />
limited number of tradable emissions credits, which emitters must hold <strong>in</strong> sufficient quantity to<br />
cover their emissions. Proponents of cap-and-trade, which is the system used <strong>in</strong> the EU-ETS,<br />
proposed under the American Clean <strong>Energy</strong> and Security Act of 2009 (Waxman-Markey), and<br />
proposed <strong>in</strong> Australia and New Zealand, argue it allows mitigation to be achieved <strong>in</strong> the most<br />
efficient way possible. This is because cap-and-trade sets a policy-driven cap, motivated by<br />
scientific evidence, and market mechanisms that allow those with the lowest cost of mitigation<br />
to reduce emissions, and to sell excess certificates to emitters with higher marg<strong>in</strong>al costs of<br />
mitigation. The argument aga<strong>in</strong>st cap-and-trade is that the variability of carbon prices <strong>in</strong>herent<br />
<strong>in</strong> such a system reduces <strong>in</strong>vestor certa<strong>in</strong>ty.<br />
4. Government Policy: Innovation, Incentives & Enabl<strong>in</strong>g policies<br />
Climate change is the result of a market failure because those who degrade the environment<br />
by emitt<strong>in</strong>g greenhouse gases generally do not bear the cost for the negative externalities<br />
related to their actions. There is no <strong>in</strong>herent price signal <strong>in</strong> markets about those costs.<br />
Government policy is therefore essential to tackle the recognition of externalities <strong>in</strong> markets <strong>in</strong><br />
order to combat climate change. However, this carries a short-term cost, to avoid risks of much<br />
greater costs <strong>in</strong> the long term. Some constituencies <strong>in</strong> society may question whether they wish<br />
to bear this cost. This is the key challenge to government policy <strong>in</strong> the long term bar<strong>in</strong>g a<br />
change <strong>in</strong> the scientific consensus.<br />
Many of the clean technologies required to combat climate change are not yet cost competitive<br />
with conventional technologies. Economic theory suggests that subsidiz<strong>in</strong>g new technologies<br />
directly, particularly dur<strong>in</strong>g their early stages, helps reduce their costs and br<strong>in</strong>gs them down<br />
their learn<strong>in</strong>g curve. Rely<strong>in</strong>g on carbon pric<strong>in</strong>g alone to encourage their development might<br />
well necessitate an extraord<strong>in</strong>arily high price <strong>in</strong> the short-term for emitt<strong>in</strong>g greenhouse gases.<br />
To avoid undesirable consequences, a number of targeted policy measures have been<br />
developed to spur <strong>in</strong>novation. These <strong>in</strong>clude a wide range of tools across geographies:<br />
� Feed-<strong>in</strong> tariffs set a premium price for the production of renewable electricity. Generators<br />
are paid a premium rate for each kWh of power fed onto the grid. There are two general<br />
ways <strong>in</strong> which feed-<strong>in</strong> tariffs can be structured: Either by sett<strong>in</strong>g a fixed price for power<br />
generated by eligible sources and fed onto the grid, or by sett<strong>in</strong>g a fixed premium rate,<br />
which is paid on top of the market price, for power generated by eligible sources and fed<br />
onto the grid. At a particular start<strong>in</strong>g year, payments are locked <strong>in</strong>, often for 20 years,<br />
improv<strong>in</strong>g the chances that renewable power generators can secure f<strong>in</strong>anc<strong>in</strong>g. Generally,<br />
the payments are reduced <strong>in</strong> successive start<strong>in</strong>g years to encourage <strong>in</strong>novation that<br />
br<strong>in</strong>gs the cost of technologies down. Spa<strong>in</strong> and Germany have both used feed-<strong>in</strong> tariffs to<br />
encourage wide-scale deployment of solar power. While Germany follows the fixed-price<br />
system, Spa<strong>in</strong> allows generators to choose between the fixed-price or the premium model.<br />
� <strong>Renewable</strong> tax <strong>in</strong>centives have been used to improve project economics for a number of<br />
renewable technologies. In the US, a multitude of these exist at federal, state and local<br />
levels. Around $21.6 billion of tax <strong>in</strong>centives for renewable energy were approved <strong>in</strong> the<br />
country’s recent economic stimulus package. Solar, w<strong>in</strong>d and geothermal will be the key<br />
beneficiaries of the extended tax credits, which <strong>in</strong>clude a three-year extension of the<br />
Production Tax Credit, which provides a $0.021/kWh benefit for the first ten years of a<br />
renewable energy facility’s operation. Various other tax <strong>in</strong>centives have been developed,<br />
<strong>in</strong>clud<strong>in</strong>g the repeal of subsidized energy f<strong>in</strong>anc<strong>in</strong>g limitations on the Investment Tax<br />
8 Alternative <strong>Investments</strong>
Cost<br />
Credit (mak<strong>in</strong>g it a 30% cash grant on capital <strong>in</strong>vested <strong>in</strong> renewable energy projects); and<br />
temporary election to claim the Investment Tax Credit <strong>in</strong> lieu of the Production Tax Credit.<br />
Additionally, the Obama adm<strong>in</strong>istration’s brand new federal program, which is pay<strong>in</strong>g<br />
substantial cash grants to help cover the cost of renewable energy <strong>in</strong>vestments, has<br />
recently led many banks to become actively <strong>in</strong>volved <strong>in</strong> f<strong>in</strong>anc<strong>in</strong>g new w<strong>in</strong>d farms. Wall<br />
Street bankers have been receptive to government policies and many believe that this<br />
may be the beg<strong>in</strong>n<strong>in</strong>g of an active pipel<strong>in</strong>e of new w<strong>in</strong>d farm f<strong>in</strong>anc<strong>in</strong>g, as well as<br />
<strong>in</strong>vestment <strong>in</strong> large solar <strong>in</strong>stallations and geothermal facilities. 15<br />
� <strong>Renewable</strong> standards and tradable certificates set a required proportion of energy that<br />
must be generated from eligible resources, and require utilities to produce a sufficient<br />
number of certificates at the end of each legal period to prove compliance. In the UK, the<br />
<strong>Renewable</strong>s Obligation places an obligation on licensed electricity suppliers to source an<br />
<strong>in</strong>creas<strong>in</strong>g proportion of electricity from renewable sources. Suppliers meet their obligation<br />
by present<strong>in</strong>g <strong>Renewable</strong> Obligation Certificates (ROCs). Where suppliers fail to supply<br />
enough ROCs to cover their obligation, a payment is made <strong>in</strong>to a buy-out fund. The buyout<br />
price is a fixed price per MWh shortfall adjusted annually. In the US, <strong>Renewable</strong><br />
Portfolio Standards at the state level are mostly used, but only a few states strictly enforce<br />
compliance through a penalty.<br />
Government loan guarantees are also prov<strong>in</strong>g important <strong>in</strong> the current economic environment,<br />
where debt markets are constra<strong>in</strong>ed. In the US, the DoE programs such as Section 1705 of<br />
American Recovery and Re<strong>in</strong>vestment Act are close to implementation. Look<strong>in</strong>g at how these<br />
policies might then <strong>in</strong>teract with a clean technology on its path to commercial breakeven, we<br />
can illustrate this graphically. See exhibit 6.<br />
Market<br />
Failure<br />
Identified<br />
1<br />
Source: DeAm analysis, 2008<br />
Cost of<br />
alternatives<br />
Exhibit 6<br />
Dynamics of Commercial Breakeven<br />
Carbon Pric<strong>in</strong>g Implemented<br />
Innovation policy used to br<strong>in</strong>g down costs of<br />
alternatives, and traditional regulation<br />
implemented to deal with other market failures<br />
Incentives to<br />
make<br />
technologies<br />
economically<br />
viable dim<strong>in</strong>ish<br />
over time<br />
Learn<strong>in</strong>g rate<br />
drives down<br />
costs over time<br />
Traditional regulation<br />
to deal with<br />
behavioral issues<br />
15<br />
Gold, Russell, “W<strong>in</strong>d Farms Set Wall Street Aflutter,” Wall Street Journal, September 1, 2009<br />
Alternative <strong>Investments</strong> 9<br />
Time<br />
2<br />
3<br />
Cost of fossil fuel<br />
production (oil,<br />
gas, coal prices)<br />
Carbon Pric<strong>in</strong>g Predom<strong>in</strong>ates<br />
Carbon<br />
price<br />
4<br />
5<br />
1<br />
2<br />
3<br />
4<br />
5<br />
Commercial breakeven<br />
with <strong>in</strong>centives without<br />
carbon pric<strong>in</strong>g e.g.<br />
some US states<br />
Commercial breakeven<br />
with carbon pric<strong>in</strong>g and<br />
<strong>in</strong>centives e.g. EU<br />
Commercial breakeven<br />
with carbon pric<strong>in</strong>g<br />
without <strong>in</strong>centives<br />
Commercial breakeven<br />
without carbon pric<strong>in</strong>g<br />
or <strong>in</strong>centives<br />
Beyond breakeven
Note that carbon pric<strong>in</strong>g acts as a “backstop” if the cost of conventional fuels fall unexpectedly<br />
on the right side of the diagram, ma<strong>in</strong>ta<strong>in</strong><strong>in</strong>g the externality pric<strong>in</strong>g signal when it is needed.<br />
When allocat<strong>in</strong>g capital, <strong>in</strong>vestors seek a regime that is certa<strong>in</strong>, transparent, and favorable.<br />
While some of these government <strong>in</strong>terventions, such as carbon pric<strong>in</strong>g, have simply improved<br />
the economics of low-carbon <strong>in</strong>dustries, others, <strong>in</strong>clud<strong>in</strong>g loan guarantees and feed-<strong>in</strong> tariffs,<br />
have de-risked low-carbon <strong>in</strong>vestments. We believe that governments will cont<strong>in</strong>ue to renew<br />
their commitment to climate change. So long as this is the case, <strong>in</strong>vest<strong>in</strong>g <strong>in</strong> climate change<br />
will rema<strong>in</strong> fundamentally attractive as technologies reach commercial break-even and grow to<br />
scale. We have summarized the current conditions and outlook for the economic factors<br />
driv<strong>in</strong>g the viability of renewable <strong>in</strong>vestments <strong>in</strong> Exhibit 7.<br />
Exhibit 7<br />
Economic Drivers of <strong>Renewable</strong>s<br />
Variable Current Conditions Outlook Trend<br />
Price of Fuel Unfavorable Favorable Longer term, we expect higher fossil fuel prices.<br />
Price of Carbon Unfavorable<br />
Favorable<br />
Governments worldwide are expected to enact<br />
policies to <strong>in</strong>ternalize carbon prices.<br />
Cost of Capital<br />
Unfavorable<br />
Favorable<br />
F<strong>in</strong>ancial conditions should improve and banks<br />
will provide f<strong>in</strong>anc<strong>in</strong>g to such long-lived assets.<br />
Regulatory<br />
Regime<br />
Favorable<br />
Favorable<br />
Grow<strong>in</strong>g awareness of the harmful effects of climate<br />
change and energy security concerns should lead<br />
governments to subsidize renewable sources of energy.<br />
Source: Largely adapted from Geoffrey Heal and the outlook of <strong>RREEF</strong> Research<br />
Based on our assessment of the longer-run future trends, we conclude that <strong>in</strong>vestments <strong>in</strong><br />
renewables will become <strong>in</strong>creas<strong>in</strong>gly attractive as the current f<strong>in</strong>ancial crisis ends.<br />
Additionally, the dynamic technological breakthroughs and <strong>in</strong>novations that will dom<strong>in</strong>ate the<br />
renewable space should render renewables <strong>in</strong>creas<strong>in</strong>gly affordable over time.<br />
Size of <strong>Renewable</strong>s by Region<br />
Many significant milestones were reached for the renewables sector <strong>in</strong> 2008. Last year, added<br />
power capacity from renewables <strong>in</strong> both the US and the European Union exceeded added<br />
power capacity from conventional power (<strong>in</strong>clud<strong>in</strong>g gas, coal, oil, and nuclear). Total<br />
renewable power capacity expanded to 280 GW <strong>in</strong> 2008, represent<strong>in</strong>g a 75% <strong>in</strong>crease from<br />
160 GW <strong>in</strong> 2004, exclud<strong>in</strong>g large hydropower. Includ<strong>in</strong>g large hydropower, global renewable<br />
power capacity reached an estimated 1,140 GW <strong>in</strong> 2008. The top six countries with the most<br />
renewable power capacity are Ch<strong>in</strong>a (76 GW), the US (40 GW), Germany (34 GW), Spa<strong>in</strong> (22<br />
GW), India (13 GW), and Japan (8 GW) (see Exhibit 8). The total capacity for develop<strong>in</strong>g<br />
countries grew to 119 GW, or 43% of the total, with Ch<strong>in</strong>a and India lead<strong>in</strong>g the <strong>in</strong>crease<br />
primarily through w<strong>in</strong>d and hydro development. 16<br />
16<br />
REN 21.2009. <strong>Renewable</strong>s Global Status Report: 2009 Update (Paris: REN 21 Secretariat)<br />
10 Alternative <strong>Investments</strong>
Gigawatts<br />
300<br />
250<br />
200<br />
150<br />
100<br />
50<br />
0<br />
Exhibit 8<br />
<strong>Renewable</strong> Power Capacities, Develop<strong>in</strong>g World<br />
European Union and Top Six Countries, 2008<br />
Geothermal<br />
Solar PV (grid)<br />
Biomass<br />
Small Hydro<br />
World Develop<strong>in</strong>g Dev EU-27 Ch<strong>in</strong>a United<br />
Germany Spa<strong>in</strong> India<br />
Japan<br />
Countries<br />
States<br />
Note: Excludes large hydropower<br />
Source: REN 21.2009. Renew ables Global Status Report: 2009 Update (Paris: REN 21 Secretariat)<br />
The renewable energy market boomed for most of 2008 despite the economic downturn. The<br />
US became the leader <strong>in</strong> new capacity <strong>in</strong>vestment with $24 billion <strong>in</strong>vested, or 20% of global<br />
total <strong>in</strong>vestment. The US surpassed Germany as the leader <strong>in</strong> total w<strong>in</strong>d power capacity. Last<br />
year Spa<strong>in</strong> saw a fivefold <strong>in</strong>crease over its’ 2007 additions by add<strong>in</strong>g 2.6 GW of solar<br />
photovoltaic (PV), represent<strong>in</strong>g half of global grid-tied <strong>in</strong>stallations. Over the last 5 years,<br />
subsides <strong>in</strong> Germany, Spa<strong>in</strong> and the UK have almost tripled. 17 Ch<strong>in</strong>a moved to fourth place<br />
worldwide for renewable power capacity after doubl<strong>in</strong>g its w<strong>in</strong>d power capacity for the fifth year<br />
<strong>in</strong> a row. Ch<strong>in</strong>a also usurped Japan to become the new world leader <strong>in</strong> PV cell production. The<br />
ethanol and biodiesel <strong>in</strong>dustries expanded rapidly <strong>in</strong> North America and Lat<strong>in</strong> America, and the<br />
cellulosic ethanol <strong>in</strong>dustry is grow<strong>in</strong>g, with 300 million liters per year of capacity under<br />
construction. 18<br />
In response to the f<strong>in</strong>ancial crisis, governments worldwide have announced plans to<br />
significantly <strong>in</strong>crease public support for renewable energy and other low-carbon technologies<br />
as part of their economic stimulus packages. In the Americas region, the US adm<strong>in</strong>istration<br />
stated a goal of $150 billion for renewables over 10 years (the American Clean <strong>Energy</strong> and<br />
Security Act earmarks up to $190 billion of potential auction credits to renewbles by 2025).<br />
Mexico’s new 2008 renewable energy law established an $800 million fund, partly to f<strong>in</strong>ance<br />
renewable energy projects. In Europe, the Netherlands announced €160 million ($200 million)<br />
per year for 15 years to support offshore w<strong>in</strong>d power. Ireland <strong>in</strong>cluded renewable energy<br />
lend<strong>in</strong>g provisions when it provided share capital to two of its biggest banks, while Hungary is<br />
provid<strong>in</strong>g €250 million ($330 million) over seven years.<br />
In Asia, Japan announced 1 trillion yen ($12.2 billion) over five years, while South Korea<br />
launched a $36 billion package over four years, and Australia aimed to accelerate an exist<strong>in</strong>g<br />
AUD$500 million ($370 million) renewable energy fund from the orig<strong>in</strong>al six years to just 18<br />
months. Ch<strong>in</strong>a has been provid<strong>in</strong>g grow<strong>in</strong>g amounts of public support to renewables <strong>in</strong> recent<br />
years—about $300 million equivalent for one period <strong>in</strong> 2007/2008, and at the end of 2008 it<br />
pledged $15 billion for renewable energy, much of it for w<strong>in</strong>d power. 19<br />
In the MENA region, Morocco announced a $1 billion fund for renewables and energy<br />
efficiency. By early 2009, policy targets existed <strong>in</strong> at least 73 countries globally, and at least 64<br />
countries had policies to promote renewable power generation, <strong>in</strong>clud<strong>in</strong>g 45 countries and 18<br />
states/prov<strong>in</strong>ces/territories with feed-<strong>in</strong> tariffs (many of these recently updated). The number of<br />
17<br />
McK<strong>in</strong>sey on Electric Power and Natural Gas, W<strong>in</strong>ter 2008<br />
18<br />
REN 21.2009. <strong>Renewable</strong>s Global Status Report: 2009 Update (Paris: REN 21 Secretariat)<br />
19<br />
REN 21.2009. <strong>Renewable</strong>s Global Status Report: 2009 Update (Paris: REN 21 Secretariat)<br />
Alternative <strong>Investments</strong> 11<br />
W<strong>in</strong>d
countries/states/ prov<strong>in</strong>ces with renewable portfolio standards <strong>in</strong>creased to 49. 20 Policy targets<br />
for renewable energy were added, supplemented, revised, or clarified <strong>in</strong> a large number of<br />
countries <strong>in</strong> 2008. New solar PV subsidy programs were adopted <strong>in</strong> Australia, Ch<strong>in</strong>a, Japan<br />
and the US; laws and policy provisions for renewables appeared <strong>in</strong> develop<strong>in</strong>g countries<br />
<strong>in</strong>clud<strong>in</strong>g Brazil, Chile, Egypt, South Africa and the Philipp<strong>in</strong>es.<br />
Size of <strong>Renewable</strong>s by Sector<br />
<strong>Renewable</strong> energy markets grew robustly <strong>in</strong> recent years and the trend is set to cont<strong>in</strong>ue.<br />
Despite the grow<strong>in</strong>g trend, barriers to growth such as the relatively high costs of some<br />
technologies <strong>in</strong> the absence of subsidies, limited research and development until recently,<br />
grow<strong>in</strong>g concerns about the impact on food available for the use of crops for energy, and a<br />
lack of skilled labor rema<strong>in</strong>. 21<br />
Accord<strong>in</strong>g to McK<strong>in</strong>sey, however, with<strong>in</strong> three to seven years, unsubsidized solar power could<br />
cost no more to end customers <strong>in</strong> markets such as California and Italy than electricity<br />
generated by burn<strong>in</strong>g fossil fuels. In the case of biomass and onshore w<strong>in</strong>d <strong>in</strong> Europe for<br />
example, they are <strong>in</strong> many <strong>in</strong>stances already cost competitive with conventional power<br />
generation. 22 Go<strong>in</strong>g forward, the growth of the renewables sector will largely depend on the<br />
level of regulatory support and the price of fossil fuels.<br />
In the four years from the end of 2004 to the end of 2008, solar PV capacity <strong>in</strong>creased sixfold<br />
to more than 16 gigawatts (GW), w<strong>in</strong>d power capacity <strong>in</strong>creased 250% to 121 GW. Total<br />
power capacity from new renewables <strong>in</strong>creased 75% to 280 GW, <strong>in</strong>clud<strong>in</strong>g significant ga<strong>in</strong>s <strong>in</strong><br />
small hydro, geothermal, and biomass power generation. As of the end of 2008, w<strong>in</strong>d power<br />
dom<strong>in</strong>ates power generation capacity by all renewables at 43%. This is followed by small<br />
hydropower at 30% (see Exhibit 9).<br />
Exhibit 9<br />
Power Generation Capacity (GW) by <strong>Renewable</strong>s Sector Exist<strong>in</strong>g<br />
at the end of 2008<br />
(Ocean (tidal) power and<br />
concentrat<strong>in</strong>g solar thermal<br />
power (CSP) less than 1%)<br />
W<strong>in</strong>d power, 43%<br />
Geothermal power, 4%<br />
Solar PV, grid-connected, 5%<br />
Biomass power, 18%<br />
Small hydropower, 30%<br />
Note: Exclud<strong>in</strong>g large hydropower<br />
Source: REN 21.2009. Renew ables Global Status Report: 2009 Update (Paris: REN 21 Secretariat)<br />
Dur<strong>in</strong>g the same period, solar heat<strong>in</strong>g capacity doubled to 145 gigawatts-thermal (GWth),<br />
while biodiesel production <strong>in</strong>creased sixfold to 12 billion liters per year and ethanol production<br />
doubled to 67 billion liters per year. Annual percentage ga<strong>in</strong>s for 2008 were even more<br />
dramatic. W<strong>in</strong>d power grew by 29% and grid-tied solar PV by 70%. The capacity of utility-scale<br />
solar PV plants that are larger than 200 kilowatts tripled dur<strong>in</strong>g 2008, to 3 GW. Solar hot water<br />
grew by 15%, and annual ethanol and biodiesel production both grew by 34%. Heat and power<br />
from biomass and geothermal sources cont<strong>in</strong>ued to grow, and small hydro <strong>in</strong>creased by about<br />
8% (see Exhibit 10). 23<br />
20<br />
REN 21.2009. <strong>Renewable</strong>s Global Status Report: 2009 Update (Paris: REN 21 Secretariat)<br />
21<br />
OECD/IEA, World <strong>Energy</strong> Outlook 2008<br />
22<br />
McK<strong>in</strong>sey on Electric Power and Natural Gas, W<strong>in</strong>ter 2008<br />
23<br />
REN 21.2009. <strong>Renewable</strong>s Global Status Report: 2009 Update (Paris: REN 21 Secretariat)<br />
12 Alternative <strong>Investments</strong>
Exhibit 10<br />
<strong>Renewable</strong> <strong>Energy</strong> Added and Exist<strong>in</strong>g Capabilities, 2008 (estimated)<br />
Added Dur<strong>in</strong>g 2008 Exist<strong>in</strong>g at End of 2008<br />
Power generation (GW)<br />
Large hydropower 25-30.00 860.0<br />
W<strong>in</strong>d power 27.00 121.0<br />
Small hydropower 6-8.00 85.0<br />
Biomass power 2.00 52.0<br />
Solar PV, grid-connected 5.40 13.0<br />
Geothermal power 0.40 10.0<br />
Concentrat<strong>in</strong>g solar thermal power (CSP) 0.06 0.5<br />
Ocean (tidal) power<br />
Hot water/heat<strong>in</strong>g (GWth)<br />
0.00 0.3<br />
Biomass heat<strong>in</strong>g N/A (250).0<br />
Solar collectors for hot water/space heat<strong>in</strong>g 19.00 145.0<br />
Geothermal heat<strong>in</strong>g<br />
Transport Fuels (billion liters/year)<br />
N/A (50).0<br />
Ethanol production 17.00 67.0<br />
Biodiesel production 3.00 12.0<br />
Source: REN 21.2009. Renew ables Global Status Report: 2009 Update (Paris: REN 21 Secretariat)<br />
� W<strong>in</strong>d: Among renewables (exclud<strong>in</strong>g large hydropower), w<strong>in</strong>d power made the largest<br />
contribution to renewable energy capacity. Exist<strong>in</strong>g w<strong>in</strong>d power capacity grew by 29% <strong>in</strong><br />
2008 to reach 121 GW, more than double the 48 GW that existed <strong>in</strong> 2004. The US<br />
overtook long-time w<strong>in</strong>d power leader Germany, end<strong>in</strong>g the year with 25 GW compared to<br />
Germany’s 24 GW. Ch<strong>in</strong>a’s total w<strong>in</strong>d power doubled for the fifth year <strong>in</strong> a row, end<strong>in</strong>g the<br />
year above 12 GW. More than 80 countries around the world had commercial w<strong>in</strong>d power<br />
<strong>in</strong>stallations by the end of 2008. Exist<strong>in</strong>g offshore w<strong>in</strong>d capacity reached nearly 1.5 GW <strong>in</strong><br />
2008, virtually all of it <strong>in</strong> Europe, with 200 MW added <strong>in</strong> 2007 and 360 MW added <strong>in</strong> 2008.<br />
The UK became the offshore w<strong>in</strong>d power leader <strong>in</strong> 2008. 24<br />
� Hydropower: Small hydropower <strong>in</strong>creased to an estimated 85 GW worldwide. Most of<br />
the small hydro is <strong>in</strong> Ch<strong>in</strong>a, where the small hydro sector has grown from 4 to 6 GW<br />
added annually from 2004 to 2008. Large hydropower <strong>in</strong>creased by an estimated 25 to 30<br />
GW <strong>in</strong> 2008 reach<strong>in</strong>g approximately 860 GW, significantly more than <strong>in</strong> previous years.<br />
This sector was also led by Ch<strong>in</strong>a, which added 12 to 15 GW, and India, which added<br />
more than 5 GW.<br />
� Biomass: Biomass power generation (and cogeneration) cont<strong>in</strong>ued to <strong>in</strong>crease, with an<br />
estimated 2 GW of power capacity added <strong>in</strong> 2008, br<strong>in</strong>g<strong>in</strong>g exist<strong>in</strong>g biomass power<br />
capacity to about 52 GW. Biomass power generation cont<strong>in</strong>ued to grow <strong>in</strong> several<br />
European Union countries over the past two years, specifically F<strong>in</strong>land, France, Germany,<br />
Italy, Poland, Sweden, and the UK. Ch<strong>in</strong>a cont<strong>in</strong>ued to <strong>in</strong>crease power generation from<br />
<strong>in</strong>dustrial- scale biogas (i.e. livestock farms) and from agricultural residues, ma<strong>in</strong>ly straw.<br />
The sugar <strong>in</strong>dustries <strong>in</strong> many develop<strong>in</strong>g countries cont<strong>in</strong>ued to br<strong>in</strong>g new bagasse power<br />
plants onl<strong>in</strong>e, <strong>in</strong>clud<strong>in</strong>g leaders Brazil and the Philipp<strong>in</strong>es, and others such as Argent<strong>in</strong>a,<br />
Columbia, India, Mexico, Nicaragua, Thailand, and Uruguay. 25<br />
� Solar PV: Grid-connected solar PV cont<strong>in</strong>ued to be the fastest grow<strong>in</strong>g power generation<br />
technology, with a 70% <strong>in</strong>crease <strong>in</strong> exist<strong>in</strong>g capacity to 13 GW <strong>in</strong> 2008. This represents a<br />
sixfold <strong>in</strong>crease <strong>in</strong> global capacity s<strong>in</strong>ce 2004. Spa<strong>in</strong> became the clear market leader <strong>in</strong><br />
2008 with 2.6 GW of new capacity <strong>in</strong>stalled, represent<strong>in</strong>g half of global <strong>in</strong>stallations and a<br />
fivefold <strong>in</strong>crease over the 550 MW added <strong>in</strong> 2007. The Spanish 60-MW Olmedilla de<br />
24<br />
REN 21.2009. <strong>Renewable</strong>s Global Status Report: 2009 Update (Paris: REN 21 Secretariat)<br />
25<br />
REN 21.2009. <strong>Renewable</strong>s Global Status Report: 2009 Update (Paris: REN 21 Secretariat)<br />
Alternative <strong>Investments</strong> 13
Alarcon plant, completed <strong>in</strong> 2008, became the largest solar PV plant <strong>in</strong> the world. Other<br />
lead<strong>in</strong>g markets <strong>in</strong> 2008 were the US (310 MW added), South Korea (200 to 270 MW),<br />
Japan (240 MW), and Italy (200 to 300 MW). Includ<strong>in</strong>g off-grid applications, total PV<br />
exist<strong>in</strong>g worldwide <strong>in</strong> 2008 <strong>in</strong>creased to more than 16 GW. Accord<strong>in</strong>g to the <strong>Renewable</strong><br />
<strong>Energy</strong> Policy Network, Solar PV markets showed three clear trends <strong>in</strong> 2008. The first was<br />
the grow<strong>in</strong>g attention to build<strong>in</strong>g-<strong>in</strong>tegrated PV (BIPV), which is a small but fast-grow<strong>in</strong>g<br />
segment of some markets, with more than 25 MW <strong>in</strong>stalled <strong>in</strong> Europe. Second, th<strong>in</strong>-film<br />
solar PV technologies became a larger share of total <strong>in</strong>stallations. And third, utility-scale<br />
solar PV power plants (def<strong>in</strong>ed as larger than 200 kilowatts, kW) emerged <strong>in</strong> large<br />
numbers <strong>in</strong> 2008.<br />
� Geothermal: Geothermal power capacity reached over 10 GW <strong>in</strong> 2008. The US rema<strong>in</strong>s<br />
the world development leader represent<strong>in</strong>g at least 5 GW per year. Other countries with<br />
significant recent growth <strong>in</strong> geothermal <strong>in</strong>clude Australia, Guatemala, Iceland, Indonesia,<br />
Mexico, Nicaragua, and Turkey. Geothermal development is under way <strong>in</strong> over 40<br />
countries, with at least 3 GW <strong>in</strong> the pipel<strong>in</strong>e beyond the US. 26<br />
Deal Flow – Closed Transactions<br />
Accord<strong>in</strong>g to Dealogic, global renewable energy project f<strong>in</strong>ance deals grew tremendously over<br />
the past few years with closed project f<strong>in</strong>ance deals for the renewables sector <strong>in</strong>creas<strong>in</strong>g by<br />
238% from 2005-2008 (see Exhibit 11). Outside of the US, renewables project f<strong>in</strong>ance has<br />
proven to be relatively resilient to the recent f<strong>in</strong>ancial crisis when compared to other sectors<br />
with<strong>in</strong> the <strong>in</strong>frastructure asset class. Globally, the sector bucked the general downturn <strong>in</strong> 2008<br />
and f<strong>in</strong>ished the year with a total project f<strong>in</strong>ance value of $47.6 billion, represent<strong>in</strong>g a 41%<br />
<strong>in</strong>crease from 2007 despite a severe shortage of debt f<strong>in</strong>ance. The average w<strong>in</strong>d project<br />
f<strong>in</strong>ance w<strong>in</strong>d deal <strong>in</strong>creased by 20% from 2007 to 2008. The renewables sector saw an<br />
<strong>in</strong>crease <strong>in</strong> volume of 15% to $16.4 billion from the first half of 2008 to the first half of 2009.<br />
� Europe: Historically, Western Europe has been the key region for renewables project<br />
f<strong>in</strong>ance deals. The brisk pace of renewables development <strong>in</strong> the Iberian Pen<strong>in</strong>sula has<br />
helped the Western European market grow by roughly 284% from 2005 to 2008. Among<br />
deals <strong>in</strong> Western Europe, the w<strong>in</strong>d sector dom<strong>in</strong>ated the renewables deal tables,<br />
account<strong>in</strong>g for 52% of total Western Europe deal volume <strong>in</strong> 2008. Babcock and Brown, a<br />
casualty of the f<strong>in</strong>ancial crisis, recently embarked on a series of European w<strong>in</strong>d farm<br />
disposals as the parent <strong>in</strong>vestment group sought to reduce debt. While the 2005 to 2008<br />
growth rate is not available for Eastern Europe, the market has <strong>in</strong>creased by roughly<br />
181% from 2007 to 2008. Accord<strong>in</strong>g to Dealogic, only w<strong>in</strong>d sector deals were project<br />
f<strong>in</strong>anced <strong>in</strong> Eastern Europe <strong>in</strong> 2008. The Eastern Europe region cont<strong>in</strong>ues to show<br />
promise, as witnessed <strong>in</strong> 2008 by the clos<strong>in</strong>g of the 156MW Kavarna w<strong>in</strong>d farm <strong>in</strong> Bulgaria<br />
for $341.9 million. Further projects <strong>in</strong> Bulgaria and Romania are expected to close <strong>in</strong> the<br />
com<strong>in</strong>g two years. 27<br />
26<br />
REN 21.2009. <strong>Renewable</strong>s Global Status Report: 2009 Update (Paris: REN 21 Secretariat)<br />
27<br />
Kjorstad, John and Rey, Yoann, “<strong>Renewable</strong>s Outlook 2009”, <strong>Infrastructure</strong> Journal, February 23, 2009<br />
14 Alternative <strong>Investments</strong>
US$ Billions<br />
50<br />
45<br />
40<br />
35<br />
30<br />
25<br />
20<br />
15<br />
10<br />
5<br />
0<br />
Exhibit 11<br />
Closed <strong>Renewable</strong>s Project F<strong>in</strong>ance Transactions from 2000-2008 by Region<br />
Asia-Pacific Americas Europe Global<br />
2000 2001 2002 2003 2004 2005 2006 2007 2008<br />
Source: Dealogic Projectw are June 2009 and <strong>RREEF</strong> Research<br />
Note: Global <strong>in</strong>cludes all regions <strong>in</strong>clud<strong>in</strong>g Africa and MENA<br />
� Americas: In the Americas, the market <strong>in</strong>creased by roughly 151% from 2005 to 2008.<br />
Among completed project f<strong>in</strong>ance deals <strong>in</strong> the region, the w<strong>in</strong>d sector by far exceeded all<br />
other renewables projects, account<strong>in</strong>g for 81% of the total 2008 renewables project<br />
f<strong>in</strong>ance deal volume <strong>in</strong> the region. The Americas region however, did not prove to be<br />
resilient to the global f<strong>in</strong>ance crisis as the total value of project f<strong>in</strong>ance renewables<br />
transactions decl<strong>in</strong>ed from an average of $303 million <strong>in</strong> 2007 to $243 million <strong>in</strong> 2008, by<br />
roughly 20%. This is partially due to liquidity problems <strong>in</strong> the US tax equity market as<br />
f<strong>in</strong>ancial service companies <strong>in</strong>vest<strong>in</strong>g <strong>in</strong> projects have been hit hard by the f<strong>in</strong>ancial crisis.<br />
With<strong>in</strong> the US, the state of California is a key area for renewable energy development,<br />
hav<strong>in</strong>g set a 20% requirement for renewable energy by 2010 and a recommended target<br />
of 33% by 2020.<br />
� Asia-Pacific: The Asia-Pacific market experienced a more mild growth of 46% from 2005<br />
to 2008. In contrast to Europe and Americas, Asia-Pacific renewable deals were spread<br />
more evenly across all segments of the renewables sector. Deals with<strong>in</strong> the w<strong>in</strong>d sector<br />
only accounted for 16% of total 2008 renewables project f<strong>in</strong>ance transactions. Average<br />
renewables deal value <strong>in</strong> the Asia-Pacific <strong>in</strong>creased by 13% from $160 million <strong>in</strong> 2007 to<br />
$180 million <strong>in</strong> 2008. The apparent hiatus <strong>in</strong> Asia-Pacific renewables deal value can be<br />
attributed to the f<strong>in</strong>ancial climate and the wait and see attitude as companies and<br />
<strong>in</strong>vestors paused to await the next moves <strong>in</strong> climate change regulation. 2008 renewables<br />
project f<strong>in</strong>anc<strong>in</strong>g deal volume shrunk <strong>in</strong> Australia as the <strong>in</strong>dustry sought greater clarity on<br />
the development of national <strong>in</strong>centive renewables scheme to replace state-level schemes<br />
and awaited the content of the Australian government’s proposed emissions trad<strong>in</strong>g<br />
scheme. 28 As the long-term regulatory outlook becomes clearer, the climate for<br />
renewables project f<strong>in</strong>ance market should improve. Generally speak<strong>in</strong>g, outside of<br />
Western Europe and North America, project f<strong>in</strong>ance <strong>in</strong> the renewables sector rema<strong>in</strong>s<br />
limited for now.<br />
Among project f<strong>in</strong>ance <strong>in</strong>frastructure deals completed <strong>in</strong> 2008, 15% were renewables projects<br />
(see Exhibit 12). <strong>Renewable</strong>s deals <strong>in</strong> Europe, Asia and the Americas constituted 28%, 4%,<br />
15% of total 2008 project f<strong>in</strong>ance <strong>in</strong>frastructure transactions <strong>in</strong> the regions respectively.<br />
28<br />
PricewaterhouseCoopers, <strong>Renewable</strong>s Deals 2008 Annual Review<br />
Alternative <strong>Investments</strong> 15
US$ Billions<br />
350<br />
300<br />
250<br />
200<br />
150<br />
100<br />
50<br />
0<br />
Exhibit 12<br />
Closed 2008 <strong>Infrastructure</strong> Project F<strong>in</strong>ance Transactions by Sector<br />
Global Europe Asia-Pacific Americas<br />
Note: Global <strong>in</strong>cludes all regions <strong>in</strong>clud<strong>in</strong>g Africa and MENA<br />
Source: Dealogic Projectw are June 2009 and <strong>RREEF</strong> Research<br />
<strong>Renewable</strong> fuel + W<strong>in</strong>d Farm<br />
From 2000 to 2008, the top ten countries with closed project f<strong>in</strong>anced renewables transactions<br />
by volume were primarily from Europe (see Exhibit 13). Of those, Spa<strong>in</strong>, Italy, Portugal and the<br />
UK led the pack. Over the past four years, Spa<strong>in</strong> witnessed an average annual growth of 81%.<br />
Much of the growth can be attributed to a lucrative tariff placed on thermal and PV solar<br />
<strong>in</strong>stallations. While the Spanish solar market is not expected to be as active <strong>in</strong> 2009 as it was<br />
<strong>in</strong> 2008, f<strong>in</strong>ancial activity <strong>in</strong> the sector should rema<strong>in</strong> strong and many of the deals that<br />
reached f<strong>in</strong>ancial close last year may seek to ref<strong>in</strong>ance once construction is completed <strong>in</strong> the<br />
next few years. 29 Spa<strong>in</strong>'s project f<strong>in</strong>ance w<strong>in</strong>d deal volume <strong>in</strong>creased 4% last year from $3.4<br />
billion <strong>in</strong> 2007 to $3.5 billion <strong>in</strong> 2008.<br />
The US averaged a 50% growth <strong>in</strong> project f<strong>in</strong>ance annually over the past four years as it<br />
rema<strong>in</strong>s one of the world’s most attractive countries to develop renewable power projects.<br />
Although the Americas renewables market slipped <strong>in</strong> 2008, it is expected to rebound over the<br />
next three years boosted by political support and the country’s abundant resource for w<strong>in</strong>d. A<br />
three year Production Tax Credit (PTC) extension through the end of 2012 was <strong>in</strong>cluded <strong>in</strong> the<br />
US’s economic stimulus package that was released earlier this year. This tax credit has been<br />
the primary driver support<strong>in</strong>g development <strong>in</strong> the w<strong>in</strong>d sector s<strong>in</strong>ce the early 1900s. The new<br />
legislation also gives the w<strong>in</strong>d, geothermal and biomass <strong>in</strong>dustry an option to elect an<br />
29<br />
Kjorstad, John and Rey, Yoann, “<strong>Renewable</strong>s Outlook 2009”, <strong>Infrastructure</strong> Journal, February 23, 2009<br />
16 Alternative <strong>Investments</strong><br />
Waste<br />
Water & sewage<br />
Telecoms<br />
Other <strong>Infrastructure</strong><br />
Industrial<br />
Social <strong>Infrastructure</strong><br />
Petrochemical<br />
Transport<br />
Power<br />
Oil & Gas<br />
Exhibit 13<br />
Top 10 Countries for Closed <strong>Renewable</strong>s Project F<strong>in</strong>anceTransactions by Volume, 2000-2008<br />
US$ Billions<br />
40<br />
35<br />
30<br />
25<br />
20<br />
15<br />
10<br />
5<br />
0<br />
Spa<strong>in</strong> United Italy Portugal United Brazil Australia Germany Turkey France<br />
States<br />
K<strong>in</strong>gdom<br />
Note: Data does not <strong>in</strong>clude renewable project f<strong>in</strong>ance deals that span multiple countries or regions<br />
Source: Dealogic Projectw are June 2009 and <strong>RREEF</strong> Research
Investment Tax Credit (ITC) <strong>in</strong> place of the PTC. 30 This could be significant encouragement<br />
for the renewables market <strong>in</strong> the US go<strong>in</strong>g forward. US DoE loan guarantee programs should<br />
also be helpful.<br />
Italy saw an astound<strong>in</strong>g average annual growth of 319% over the past four years. This is<br />
primarily a reflection of a boom <strong>in</strong> transactions from 2004-2005. The outlook for Italy <strong>in</strong> 2009<br />
rema<strong>in</strong>s positive as the country has recently amended its <strong>in</strong>centive structure and a strong<br />
pipel<strong>in</strong>e of deals. A decree issued <strong>in</strong> December of 2008 replaced the old structure of<br />
renewable energy <strong>in</strong>centives with the exception for photovoltaic grants which are still regulated<br />
under an old 2007 decree. 31 Portugal witnessed an average annual growth of 125% over the<br />
past four years and the UK saw an average annual growth of 24% for the same time period,<br />
reflect<strong>in</strong>g a -39% decl<strong>in</strong>e <strong>in</strong> renewables project f<strong>in</strong>ance transactions from 2006 to 2007. Brazil<br />
ranks sixth on the list although it observed an average annual growth rate of 42% over the past<br />
four years as a result of a sharp decl<strong>in</strong>e <strong>in</strong> project f<strong>in</strong>ance transactions <strong>in</strong> 2002 and 2003.<br />
Brazil is a strong market for biofuels, the scale of which has <strong>in</strong>creased significantly over the<br />
time period.<br />
A number of significant renewables project f<strong>in</strong>ance deals were completed <strong>in</strong> 2008 (see Exhibit<br />
14). W<strong>in</strong>d deals by far dom<strong>in</strong>ated the top 10 transactions list by volume. The average deal<br />
value was $1.1 billion for the top 10 renewables deals <strong>in</strong> 2008.<br />
Name Value (US$m) F<strong>in</strong>ancial Close Description Location<br />
IP Maestrale Ref<strong>in</strong>ance 3,054 3/10/08 648MW W<strong>in</strong>d Portfolio Italy, Germany<br />
Tu<strong>in</strong> Zonne 1,500 1/29/08 120MW Solar PV Portfolio Spa<strong>in</strong><br />
Noble W<strong>in</strong>d New York 2008 1,181 6/30/08 4 W<strong>in</strong>d Farms for a total of 351MW USA<br />
Martel II Ref<strong>in</strong>anc<strong>in</strong>g 998 11/14/08 W<strong>in</strong>d Portfolio Portugal<br />
SER API 887 11/17/08 342.4MW W<strong>in</strong>d Farm Portfolio Italy<br />
Generg Ref<strong>in</strong>anc<strong>in</strong>g 766 11/26/08 436.4MW W<strong>in</strong>d and 33.2MW Hydro Portugal<br />
EUFER 714 12/17/08 W<strong>in</strong>d Portfolio - 295.6MW through 12 projects Spa<strong>in</strong><br />
Kenedy W<strong>in</strong>d Farm 674 2/15/08 282.3MW W<strong>in</strong>d Farm <strong>in</strong> Texas USA<br />
Renovalia II 577 3/5/08 47.6MW Solar PV Portfolio Spa<strong>in</strong><br />
Manchasol I Termal Solar 547 10/24/08 50MW Parabolic Trough Plant <strong>in</strong> Ciudad <strong>Real</strong> Spa<strong>in</strong><br />
Source: <strong>Infrastructure</strong> Journal<br />
Exhibit 14<br />
Top 10 <strong>Renewable</strong>s Project F<strong>in</strong>ance Transactions <strong>in</strong> 2008<br />
While renewables have not been immune to the downturn, it is seen as a relatively resilient<br />
sector with<strong>in</strong> <strong>in</strong>frastructure portfolios due to the clear long-term rationale of the sector and<br />
<strong>in</strong>creas<strong>in</strong>g government support. Resilience of operat<strong>in</strong>g renewable assets comes from the<br />
reality that long-term returns are generally fixed at f<strong>in</strong>ancial close through locked-<strong>in</strong><br />
construction costs and feed-<strong>in</strong> tariffs or power purchase agreements to fix unit MWh revenues.<br />
W<strong>in</strong>d volumes and sunlight hours have no correlation to underly<strong>in</strong>g economic conditions.<br />
Project f<strong>in</strong>ance activity <strong>in</strong> the renewables sector rema<strong>in</strong>s relatively strong <strong>in</strong> the current market<br />
despite liquidity constra<strong>in</strong>ts <strong>in</strong> the debt market. Limited resources have forced banks to depend<br />
more on multilaterals such as the European Investment Bank and the Inter-American<br />
Development Bank <strong>in</strong> the near-term. Additionally, renewables projects are able to attract debt<br />
while f<strong>in</strong>anc<strong>in</strong>g for expensive traditional power plants may struggle because many renewables<br />
projects can be built <strong>in</strong> phases, with f<strong>in</strong>anc<strong>in</strong>g completed for each phase. The average debt to<br />
equity ratio for closed renewables deals was approximately 80:20 <strong>in</strong> 2008 (see Exhibit 15). 32<br />
The bond market for renewables project f<strong>in</strong>ance has never quite taken off. S<strong>in</strong>ce the f<strong>in</strong>ancial<br />
crisis, there has been more emphasis on the equity market, however, the actual amount of<br />
30<br />
Kjorstad, John and Rey, Yoann, “<strong>Renewable</strong>s Outlook 2009”, <strong>Infrastructure</strong> Journal, February 23, 2009<br />
31<br />
Kjorstad, John and Rey, Yoann, “<strong>Renewable</strong>s Outlook 2009”, <strong>Infrastructure</strong> Journal, February 23, 2009<br />
32<br />
Kjorstad, John and Rey, Yoann, “<strong>Renewable</strong>s Outlook 2009”, <strong>Infrastructure</strong> Journal, February 23, 2009<br />
Alternative <strong>Investments</strong> 17
Multilateral &<br />
Govt. Support, 1%<br />
Bond, 4%<br />
Equity, 11%<br />
Source: <strong>Infrastructure</strong> Journal<br />
2006<br />
Loan, 84%<br />
Exhibit 15<br />
<strong>Renewable</strong>s - Source of Fund<strong>in</strong>g<br />
(Percentage of Total per Year)<br />
Multilateral &<br />
Govt. Support, 1%<br />
Bond, 5%<br />
Equity, 16%<br />
equity <strong>in</strong>vested <strong>in</strong> renewables project f<strong>in</strong>ance deals <strong>in</strong> 2008 rema<strong>in</strong>ed the same. Our outlook<br />
for equity <strong>in</strong>vestments for renewables transactions rema<strong>in</strong>s positive for 2009.<br />
Deal Flow – Pipel<strong>in</strong>e Transactions<br />
Multilateral &<br />
Govt. Support, 1%<br />
Bond, 1%<br />
Equity, 14%<br />
Follow<strong>in</strong>g a strong performance <strong>in</strong> 2008, we rema<strong>in</strong> bullish on our global outlook for the<br />
renewables project f<strong>in</strong>ance sector despite the challeng<strong>in</strong>g year ahead. The IEA declared that<br />
total <strong>in</strong>vestment <strong>in</strong> renewables is a long way beh<strong>in</strong>d the average annual need that would be<br />
required by 2030 to prevent atmospheric concentrations of CO2 reach<strong>in</strong>g 450ppm and avoid<br />
the worst effects of climate change. 33 The renewables sector is well-positioned to handle the<br />
challenges currently fac<strong>in</strong>g developers and f<strong>in</strong>ancial markets as a result of strong government<br />
support, a need for energy security and grow<strong>in</strong>g consumer appetite for clean power. New<br />
developers seek<strong>in</strong>g seed money for development assets however, may have a hard time<br />
access<strong>in</strong>g credit than experienced developers with a proven track record and operat<strong>in</strong>g assets.<br />
In North America and Europe, tariffs, tax credit and green certificates will cont<strong>in</strong>ue to provide<br />
healthy <strong>in</strong>centives for new developments. In many countries, feed-<strong>in</strong> tariffs provide a strong<br />
<strong>in</strong>centive for the development of the sector as they provide more certa<strong>in</strong>ty and stability to<br />
project cash flows. In countries such as the US, Germany and Spa<strong>in</strong>, there has also been<br />
significant tax-driven impetus which has effectively encouraged the development of the<br />
sector. 34<br />
Governments <strong>in</strong> Europe cont<strong>in</strong>ue to show strong support for the development of domestic<br />
resources <strong>in</strong> their effort to <strong>in</strong>crease the share of renewables <strong>in</strong> the power mix and to improve<br />
energy security. The European Commission has recently set a target of 20% of f<strong>in</strong>al energy<br />
consumption to come from renewables by 2020. Meet<strong>in</strong>g these targets will require an even<br />
higher percentage of renewable generation <strong>in</strong> electricity. Earlier this year, President Obama<br />
pledged to double the production of alternative energy over the next three years to spark the<br />
creation of a clean energy economy. The American Recovery and Re<strong>in</strong>vestment Act of 2009<br />
<strong>in</strong>cludes several provisions aimed at encourag<strong>in</strong>g <strong>in</strong>vestment <strong>in</strong> the US renewables market.<br />
The bill underl<strong>in</strong>es changes to tax <strong>in</strong>centives, cash grants, federal loan guarantees and direct<br />
spend<strong>in</strong>g. These measures have been welcomed by US developers which have suffered <strong>in</strong><br />
recent months as a result of uncerta<strong>in</strong>ty regard<strong>in</strong>g the extension of production tax credits, a<br />
tight credit market and troubled tax equity players. 35<br />
Accord<strong>in</strong>g to Dealogic, the majority (47%) of the project f<strong>in</strong>ance renewables deals <strong>in</strong> the<br />
pipel<strong>in</strong>e are <strong>in</strong> the Americas region (see Exhibit 16). Approximately a quarter (23%) of the<br />
project f<strong>in</strong>ance renewables deals <strong>in</strong> the pipel<strong>in</strong>e are based <strong>in</strong> the Asia-Pacific region. Western<br />
Europe constitutes 15% of the pipel<strong>in</strong>e and Eastern Europe only comprises 3% of all project<br />
f<strong>in</strong>ance pipel<strong>in</strong>e deals. In the near-term, we believe that Western Europe will cont<strong>in</strong>ue to be the<br />
key region for w<strong>in</strong>d and solar renewables project f<strong>in</strong>ance, led by Spa<strong>in</strong> and Italy. A few projects<br />
<strong>in</strong> Turkey, Jordan and Poland may also grab headl<strong>in</strong>es this year. 36<br />
33<br />
IEA confirms renewables recession woes, Environmental F<strong>in</strong>ance, May 28, 2009<br />
34<br />
PricewaterhouseCoopers, <strong>Renewable</strong>s Deals 2008 Annual Review<br />
35<br />
Stimulat<strong>in</strong>g the US renewables market, <strong>Infrastructure</strong> Journal, March 4, 2009<br />
36<br />
Kjorstad, John and Rey, Yoann, “<strong>Renewable</strong>s Outlook 2009”, <strong>Infrastructure</strong> Journal, February 23, 2009<br />
18 Alternative <strong>Investments</strong><br />
2007<br />
Loan, 78%<br />
2008<br />
Loan, 84%
Eastern Europe,<br />
3%<br />
Sub-Saharan<br />
Africa, 9%<br />
(a) Total <strong>Renewable</strong>s Deals<br />
MENA, 2%<br />
Western Europe,<br />
16%<br />
Specifically, the renewable fuels project f<strong>in</strong>ance deals <strong>in</strong> the pipel<strong>in</strong>e total $119 billion, which<br />
<strong>in</strong>cludes Africa and MENA regions. For these projects, 49% of deals will orig<strong>in</strong>ate from the<br />
Americas and 28% from Asia-Pacific. Western Europe and Eastern Europe comb<strong>in</strong>ed only<br />
comprise 6% of the renewable fuels project f<strong>in</strong>ance pipel<strong>in</strong>e. The w<strong>in</strong>d farm project f<strong>in</strong>ance<br />
deals <strong>in</strong> the pipel<strong>in</strong>e total $77 billion, <strong>in</strong>clud<strong>in</strong>g Africa and MENA regions. The majority (45%) of<br />
the global w<strong>in</strong>d farm project f<strong>in</strong>ance pipel<strong>in</strong>e also stems from the Americas region followed<br />
closely by 34% from Western Europe and 15% from Asia-Pacific.<br />
The global <strong>in</strong>frastructure project f<strong>in</strong>ance pipel<strong>in</strong>e offers a strong deal flow with over $2.9 trillion<br />
<strong>in</strong> deal volume. The renewables sector currently comprises 7% of total <strong>in</strong>frastructure deal<br />
volume which is $196 million (see Exhibit 17). In Asia-Pacific, the renewables sector<br />
constitutes 6% of the regional pipel<strong>in</strong>e <strong>in</strong>frastructure deal volume which is equivalent to<br />
approximately $45 billion. India, Myanmar, Australia, Laos and New Zealand are the largest<br />
renewable markets <strong>in</strong> the region, total<strong>in</strong>g 65% of the regional renewables project f<strong>in</strong>ance<br />
pipel<strong>in</strong>e.<br />
US$ Trillions<br />
Americas, 47%<br />
Asia-Pac, 23%<br />
Source: Dealogic Projectw are June 2009 and <strong>RREEF</strong> Research<br />
3.5<br />
3<br />
2.5<br />
2<br />
1.5<br />
1<br />
0.5<br />
0<br />
Exhibit 16<br />
Project F<strong>in</strong>ance Pipel<strong>in</strong>e by Region<br />
MENA, 3%<br />
Eastern Europe,<br />
2%<br />
Sub-Saharan<br />
Africa, 14%<br />
Western Europe,<br />
4%<br />
(b) <strong>Renewable</strong> Fuels Deals<br />
Exhibit 17<br />
Pipel<strong>in</strong>e <strong>Infrastructure</strong> Project F<strong>in</strong>ance Deals by Sector<br />
Global Asia-Pacific Americas Europe<br />
Note: Global <strong>in</strong>cludes all regions <strong>in</strong>clud<strong>in</strong>g Africa and MENA<br />
Source: Dealogic Projectw are June 2009 and <strong>RREEF</strong> Research<br />
Americas, 49%<br />
MENA, 1%<br />
Eastern Europe,<br />
4%<br />
Sub-Saharan<br />
Africa, 1%<br />
Western Europe,<br />
Asia-Pac, 28%<br />
34%<br />
(c) W<strong>in</strong>d Farm Deals<br />
<strong>Renewable</strong> fuel + W<strong>in</strong>d Farm<br />
In the Americas, the renewables sector comprises 12% of the regional project f<strong>in</strong>ance pipel<strong>in</strong>e<br />
at $94 billion. The US, Canada, Chile, Brazil and Argent<strong>in</strong>a are the largest <strong>in</strong>frastructure<br />
<strong>in</strong>vestment markets <strong>in</strong> the Americas region (total<strong>in</strong>g 79%). We believe that the first year of the<br />
Obama presidency and the December 2009 UN Climate Change Conference <strong>in</strong> Copenhagen<br />
will set the context for the sector’s development for the next few years.<br />
Alternative <strong>Investments</strong> 19<br />
Waste<br />
Telecoms<br />
Water & sewage<br />
Industrial<br />
Other <strong>Infrastructure</strong><br />
Social <strong>Infrastructure</strong><br />
Petrochemical<br />
Power<br />
Oil & Gas<br />
Transport<br />
Americas, 45%<br />
As ia-Pac, 15%
In Europe, the renewables sector accounts for approximately 5% of the total <strong>in</strong>frastructure<br />
project f<strong>in</strong>ance regional deal volume which is equivalent to $35 billion. The UK, Germany,<br />
Belgium, Spa<strong>in</strong> and the Kyrgyz Republic are the largest renewables project f<strong>in</strong>ance markets <strong>in</strong><br />
the region, total<strong>in</strong>g 79% of the renewables project f<strong>in</strong>ance pipel<strong>in</strong>e. The collapse of Babcock &<br />
Brown earlier this year could generate a few large w<strong>in</strong>d and solar transactions <strong>in</strong> the nearterm.<br />
Look<strong>in</strong>g forward, the renewables energy sector has tremendous potential for growth<br />
globally as we expect <strong>in</strong>vestments to flow <strong>in</strong> from both the public and private sector.<br />
Comparative Performance: <strong>Renewable</strong> <strong>Energy</strong><br />
<strong>Investments</strong> and Traditional Asset Classes<br />
<strong>Investments</strong> <strong>in</strong> renewable energy are becom<strong>in</strong>g <strong>in</strong>creas<strong>in</strong>gly prom<strong>in</strong>ent <strong>in</strong> private <strong>in</strong>frastructure<br />
portfolios. <strong>Infrastructure</strong> <strong>in</strong>vestment managers, capitaliz<strong>in</strong>g on the <strong>in</strong>evitable transition to lowcarbon<br />
sources of electricity, have targeted renewable energy assets as a key sector across<br />
the various funds. But how do such assets fit <strong>in</strong> a private equity <strong>in</strong>frastructure portfolio and are<br />
their features comparable to the broader <strong>in</strong>frastructure class universe?<br />
The performance characteristics of <strong>in</strong>frastructure <strong>in</strong>vestments have been well-documented <strong>in</strong><br />
past <strong>RREEF</strong> Research reports. 37 <strong>Renewable</strong> assets share many of the unique features<br />
characteriz<strong>in</strong>g <strong>in</strong>frastructure assets <strong>in</strong> general, <strong>in</strong>clud<strong>in</strong>g “quasi-monopoly” cost structures, high<br />
barriers to entry, an essential service, steady cash stream profile and high <strong>in</strong>itial capital<br />
expenditures. The more specific characteristics of energy assets have also been documented<br />
<strong>in</strong> a follow up <strong>RREEF</strong> report as well. 38 <strong>Renewable</strong> energy also has the dist<strong>in</strong>ction of be<strong>in</strong>g part<br />
of the “regulated” <strong>in</strong>frastructure assets with a large degree of public oversight determ<strong>in</strong><strong>in</strong>g<br />
rates and concession terms.<br />
In this report, we focus on the performance of renewable energy <strong>in</strong>vestments <strong>in</strong> the context of<br />
the broader <strong>in</strong>frastructure asset class and as compared to other traditional asset classes. For<br />
this purpose, we are us<strong>in</strong>g the Wilder Hill Clean <strong>Energy</strong> Global Index (ticker: NEX) as a proxy<br />
for the renewable energy sector. The NEX represents a global <strong>in</strong>dex of all publicly-traded<br />
renewable energy companies. Data on privately-held renewable energy <strong>in</strong>frastructure<br />
<strong>in</strong>vestments is not publicly available. For this purpose, we use the NEX as a proxy. Exhibit 18<br />
provides 1, 3, and 5 year returns for the NEX and other broad <strong>in</strong>frastructure, equity, bond and<br />
fossil fuel <strong>in</strong>dices.<br />
Exhibit 18<br />
Comparative Asset Class Performance*<br />
(Percentage Returns)<br />
1 Year 3 Year 5 Year<br />
5 Year<br />
Volatility<br />
<strong>Renewable</strong>s Wilder Hill Clean <strong>Energy</strong> (NEX) (44.5) (5.2) 6.7 35.8<br />
<strong>Infrastructure</strong><br />
UBS <strong>Infrastructure</strong> & Utilities (30.1) (0.6) 9.1 23.6<br />
Dow Jones Brookfield Global<br />
<strong>Infrastructure</strong><br />
Equity MSCI World (31.2) (9.9) (1.9) 21.1<br />
Bonds Lehman (Barclays) Global Aggregate Bond Index 2.8 6.7 5.5 5.2<br />
Fossil Fuels<br />
*Data through June 30, 2009<br />
Source: Bloomberg and <strong>RREEF</strong> Research<br />
Oil (50.1) (1.9) 13.5 40.9<br />
Natural Gas (71.9) (14.1) (9.3) 53.6<br />
37 Please see “The Performance Characteristics of <strong>Infrastructure</strong> <strong>Investments</strong>”, August 2007<br />
(25.1) (1.6) 8.3 24.3<br />
20 Alternative <strong>Investments</strong>
Volatility measures are proxied by the first-order standard deviation. In each case, a five-year<br />
standard deviation is calculated s<strong>in</strong>ce the NEX does not go back further than five years.<br />
As is reflected <strong>in</strong> the first and third-year returns, all asset classes with the exception of bonds<br />
have been hit hard <strong>in</strong> this downturn. The highly volatile oil and natural gas markets were the<br />
worst hit on a one-year basis followed by the listed renewables NEX <strong>in</strong>dex. The NEX is a<br />
publicly-traded benchmark and is likely much more volatile than privately-held energy<br />
<strong>in</strong>frastructure assets. Listed <strong>in</strong>frastructure vehicles have also been hurt, <strong>in</strong> l<strong>in</strong>e with the<br />
broader equity market averages. A large number of <strong>in</strong>frastructure vehicles tend to now be<br />
traded at a discount to the values of the underly<strong>in</strong>g assets. In many <strong>in</strong>stances, renewables,<br />
such as solar and w<strong>in</strong>d, are suffer<strong>in</strong>g the same fate as the broader <strong>in</strong>frastructure asset class,<br />
trad<strong>in</strong>g at less than replacement cost of assets currently <strong>in</strong> production. Given the highly<br />
capital-<strong>in</strong>tensive nature of renewables, a lack of available f<strong>in</strong>anc<strong>in</strong>g and a pullback <strong>in</strong><br />
government subsidies, especially <strong>in</strong> Europe (Spa<strong>in</strong> and Germany) have hurt performance.<br />
Based on the economic drivers of renewables, we expect that demand should rebound dur<strong>in</strong>g<br />
the latter part of 2009 and early 2010 with improved f<strong>in</strong>anc<strong>in</strong>g conditions and the surge <strong>in</strong> the<br />
various government stimulus programs target<strong>in</strong>g alternative energy sources.<br />
Exhibit 19 shows the performance of renewables <strong>in</strong> comparison to equities, bonds, and oil<br />
s<strong>in</strong>ce 2003. The NEX <strong>in</strong>dex outperformed the broader market <strong>in</strong>dices and oil through year-end<br />
2007. Between 2003 to the end of 2007, the NEX <strong>in</strong>dex grew over 40% per year. By the<br />
second half of 2008, the NEX succumbed to the unfold<strong>in</strong>g credit crisis. Indeed, publicly listed<br />
renewable energy firms were not immune to the f<strong>in</strong>ancial crisis and NEX returns fell <strong>in</strong> l<strong>in</strong>e with<br />
the broader market through March 2009. Given the deterioration <strong>in</strong> f<strong>in</strong>ancial conditions and<br />
lower oil and natural gas prices, <strong>in</strong>vestments <strong>in</strong> publicly-listed renewable energy firms decl<strong>in</strong>ed<br />
significantly. Dur<strong>in</strong>g 2008 and early 2009, fewer renewable firms went public, add<strong>in</strong>g to the<br />
decl<strong>in</strong>e <strong>in</strong> market performance. The risk aversion that had gripped the market through the first<br />
quarter of 2009 also saw a rotation of capital away from any new high-technology sector,<br />
<strong>in</strong>clud<strong>in</strong>g renewable energy. Indeed, back test<strong>in</strong>g suggests a fairly high correlation between<br />
the NEX and NASDAQ between 2000 and 2003, when many renewable energy stocks were<br />
seen as technology plays. This clearly changed, however, as renewable energy <strong>in</strong>frastructure<br />
matured <strong>in</strong>to its own <strong>in</strong>vestment sector. More recently, the correlation of NEX is highest with oil<br />
prices and broader <strong>in</strong>frastructure assets.<br />
Exhibit 19<br />
NEX vs. Broader Equity Markets*<br />
500<br />
450<br />
Amex Oil (OXH Index)<br />
400<br />
Wilder Hill Clean <strong>Energy</strong> Index (NEX Index)<br />
350<br />
MSCI World Index (MXWO Index)<br />
300<br />
250<br />
200<br />
150<br />
100<br />
50<br />
0<br />
JPM Global Aggregate Bond Index (JGAGGUSD Index)<br />
Dec-02 Jun-03 Dec-03 Jun-04 Dec-04 Jun-05 Dec-05 Jun-06 Dec-06 Jun-07 Dec-07 Jun-08 Dec-08 Jun-09<br />
Source: Bloomberg and <strong>RREEF</strong> Research<br />
*All <strong>in</strong>dices <strong>in</strong>dexed at 100 as of year end 2002<br />
Over the past quarter, however, the NEX <strong>in</strong>dex has rebounded at a stronger pace than the<br />
broader market. Our expectation is that the structural and cyclical drivers of the renewables<br />
sector will be positive for the long-term outlook for <strong>in</strong>vestment returns garnered from such<br />
38<br />
Please see “<strong>Infrastructure</strong> Funds: The Role of <strong>Energy</strong> Assets”, October 2008<br />
Alternative <strong>Investments</strong> 21
Wilder Hill Clean <strong>Energy</strong><br />
Index (Global)<br />
assets. Although historically, the renewable energy stocks have been more volatile than other<br />
sectors, their returns have been higher, render<strong>in</strong>g them an attractive <strong>in</strong>vestment on a riskadjusted<br />
basis.<br />
Exhibit 20 presents the correlation coefficient matrix for the NEX, equities, bonds,<br />
<strong>in</strong>frastructure (both UBS and Brookfield <strong>in</strong>dices), <strong>in</strong>flation, oil and natural gas. We could only<br />
go back to October 2003 s<strong>in</strong>ce that is the <strong>in</strong>ception date for the NEX. The NEX is highly<br />
correlated to the broader equity and <strong>in</strong>frastructure <strong>in</strong>dices.<br />
UBS Developed<br />
<strong>Infrastructure</strong> & Utilities Index<br />
Dow Jones Brookfield<br />
Global <strong>Infrastructure</strong> Index<br />
Wilder Hill Clean<br />
<strong>Energy</strong> Index<br />
(Global)<br />
1<br />
0.90 1<br />
UBS Developed<br />
<strong>Infrastructure</strong> &<br />
Utilities Index<br />
0.86 0.99 1<br />
Dow Jones<br />
Brookfield Global<br />
<strong>Infrastructure</strong> Index<br />
MSCI World Index 0.93 0.95 0.94 1<br />
JPM Global Aggregate<br />
Bond Index<br />
It is also highly correlated to oil given that they are substitutes, the higher the price of oil, the<br />
greater the demand for oil substitutes such as renewable energy which drives up the NEX. It<br />
has a low correlation to <strong>in</strong>flation but this can be mislead<strong>in</strong>g. Inflation rates globally were very<br />
low dur<strong>in</strong>g the 2003 to 2009 period. Deflation was more of a concern, especially dur<strong>in</strong>g the<br />
unfold<strong>in</strong>g of the f<strong>in</strong>ancial crisis s<strong>in</strong>ce August of 2007. We do not have a long enough time<br />
series on the NEX to track its correlation to <strong>in</strong>flation dur<strong>in</strong>g high <strong>in</strong>flationary periods which<br />
would have been more conclusive. The NEX is least correlated to bonds and would thus<br />
provide an efficient diversifier to a bond portfolio.<br />
The <strong>in</strong>vestment horizons of renewable energy funds, similar to most economic <strong>in</strong>frastructure<br />
funds, are medium to long-term. We have also used standard deviations to measure volatility,<br />
but these measure the risk<strong>in</strong>ess of listed renewable energy companies and activities. The risk<br />
profile of privately-held renewable energy <strong>in</strong>frastructure assets is hard to determ<strong>in</strong>e at this<br />
stage due to the relative immaturity of this sector.<br />
22 Alternative <strong>Investments</strong><br />
MSCI World Index<br />
0.22 0.27 0.22 0.19 1<br />
JPM Global<br />
Aggregate Bond<br />
Index<br />
World CPI (0.84) (0.90) (0.91) (0.92) (0.06) 1<br />
Am ex Oil 0.81 0.79 0.76 0.76 0.06 (0.77) 1<br />
Henry Hub Natural Gas<br />
Spot Price<br />
Source: Bloomberg and <strong>RREEF</strong> Research<br />
Exhibit 20<br />
Correlations: October 1, 2003 to June 30, 2009<br />
(Roll<strong>in</strong>g 4-Quarter Basis)<br />
0.41 0.39 0.31 0.30 0.30 (0.28) 0.61 1<br />
World CPI<br />
Amex Oil<br />
Henry Hub Natural<br />
Gas Spot Price<br />
Strong Correlation<br />
Negative Correlation
<strong>Renewable</strong> <strong>Energy</strong> <strong>Infrastructure</strong> Sectors<br />
In this section, we focus on a subset of the full range of renewable energy opportunities.<br />
<strong>Infrastructure</strong> funds have predom<strong>in</strong>antly targeted three renewable subsectors <strong>in</strong>clud<strong>in</strong>g:<br />
� W<strong>in</strong>d<br />
– Onshore<br />
– Offshore<br />
� Solar<br />
– Photovoltaic (PV)<br />
– Solar Thermal Electricity Generation (STEG)<br />
� Biofuels<br />
– Ethanol<br />
– Cellulosic and Next Generation Biofuels<br />
Mature <strong>in</strong>frastructure funds primarily target onshore w<strong>in</strong>d, solar (PV and STEG), waste to<br />
energy and m<strong>in</strong>i hydro. Biofuels and offshore w<strong>in</strong>d haven not yet been targeted by such<br />
mature funds. Despite the unfold<strong>in</strong>g of a major f<strong>in</strong>ancial crisis, global <strong>in</strong>vestments <strong>in</strong> renewable<br />
energy cont<strong>in</strong>ued strongly through 2008. Yet the pace of growth has slowed more recently<br />
due to the dearth of f<strong>in</strong>anc<strong>in</strong>g <strong>in</strong> capital markets worldwide. Exhibit 21 illustrates the major<br />
susta<strong>in</strong>able energy sectors, <strong>in</strong>clud<strong>in</strong>g the top three which is the focus of our analysis <strong>in</strong> this<br />
section.<br />
Exhibit 21<br />
F<strong>in</strong>ancial New Investment by Technology, 2008 and Growth on 2007<br />
(US$ Billions)<br />
Growth:<br />
Among the major renewable energy sectors, w<strong>in</strong>d energy is be<strong>in</strong>g developed at the fastest<br />
pace, especially <strong>in</strong> the US and Ch<strong>in</strong>a. Over the past decade alone, globally <strong>in</strong>stalled capacity<br />
of w<strong>in</strong>d power (both onshore and offshore) has <strong>in</strong>creased to roughly 120 GW <strong>in</strong> 2008. W<strong>in</strong>d<br />
has also attracted the greatest amount <strong>in</strong> new <strong>in</strong>vestments, underscor<strong>in</strong>g its status as the most<br />
mature renewable energy generat<strong>in</strong>g technology. As <strong>in</strong>vestors have become <strong>in</strong>creas<strong>in</strong>gly risk<br />
averse, however, there is a clear shift from early to later stage development of w<strong>in</strong>d power, a<br />
reflection of where the market sees better value. Onshore w<strong>in</strong>d cont<strong>in</strong>ues to attract the highest<br />
volume of all f<strong>in</strong>anc<strong>in</strong>g as well s<strong>in</strong>ce it is perceived as less risky than offshore w<strong>in</strong>d.<br />
Most recently, solar, especially solar PV, has widened its lead over biofuels, especially as a<br />
share of public market <strong>in</strong>vestments. Solar has also become the fastest-grow<strong>in</strong>g sector among<br />
renewables, advanc<strong>in</strong>g 49% <strong>in</strong> 2008. Biofuels rema<strong>in</strong> a well-established source of renewable<br />
energy but have been hurt recently by ris<strong>in</strong>g food prices and the relatively low oil and natural<br />
gas prices. The reputation of biofuels has also been <strong>in</strong>creas<strong>in</strong>gly tarnished <strong>in</strong> the food versus<br />
fuel controversy.<br />
Alternative <strong>Investments</strong> 23<br />
W<strong>in</strong>d<br />
Solar<br />
Biofuels<br />
Biomass & waste-to-energy<br />
Mar<strong>in</strong>e & small-hydro<br />
Geothermal<br />
Efficiency<br />
Other low carbon tech/services<br />
2<br />
2<br />
2<br />
3<br />
Note: New <strong>in</strong>vestment volume adjusts for re-<strong>in</strong>vested equity. Total values <strong>in</strong>clude<br />
estimates for undisclosed deals.<br />
Source: New <strong>Energy</strong> F<strong>in</strong>ance, UNEP, SEFI<br />
8<br />
17<br />
34<br />
52<br />
1%<br />
49%<br />
(9%)<br />
(25%)<br />
(5%)<br />
149%<br />
(33%)<br />
(37%)
300<br />
250<br />
200<br />
150<br />
Exhibit 22 depicts the performance of the renewable energy sectors between September 2006<br />
and July 2009. In addition to the NEX <strong>in</strong>dex, we have charted the Bloomberg W<strong>in</strong>d Index<br />
(BWIND) and the MAC Global Solar <strong>Energy</strong> Index (SUNIDX).<br />
Exhibit 22<br />
Performance of <strong>Renewable</strong> <strong>Energy</strong> Sectors*<br />
100<br />
50<br />
0<br />
Wilder Hill Clean <strong>Energy</strong> Index (NEX Index)<br />
Bloomberg W<strong>in</strong>d Index (BWIND Index)<br />
MAC Global Solar <strong>Energy</strong> Index (SUNIDX Index)<br />
Sep-06 Dec-06 Mar-07 Jun-07 Sep-07 Dec-07 Mar-08 Jun-08 Sep-08 Dec-08 Mar-09 Jun-09<br />
Jul-09<br />
Source: Bloomberg and <strong>RREEF</strong> Research<br />
*All <strong>in</strong>dices <strong>in</strong>dexed at 100 as of September 8, 2006<br />
The BWIND Index is a multiple weighted <strong>in</strong>dex of the lead<strong>in</strong>g w<strong>in</strong>d power stocks <strong>in</strong> the world,<br />
<strong>in</strong>clud<strong>in</strong>g both manufacturers of w<strong>in</strong>d turb<strong>in</strong>es, operators and their suppliers. The SUNIDX<br />
<strong>in</strong>dex tracks listed public companies globally that specialize <strong>in</strong> provid<strong>in</strong>g solar energy products<br />
and services. We do not have a comparable <strong>in</strong>dex for biofuels as it rema<strong>in</strong>s a less mature and<br />
less transparent sector as compared to w<strong>in</strong>d and solar.<br />
All three <strong>in</strong>dices seem to have peaked around January 2008 before trend<strong>in</strong>g down with the<br />
broader markets. The returns for the solar sector have been more volatile than the more<br />
mature w<strong>in</strong>d sector. By July 2009, w<strong>in</strong>d had outperformed both the benchmark NEX <strong>in</strong>dex and<br />
the solar category. Indeed w<strong>in</strong>d is up roughly 15% over this time period whereas both the NEX<br />
and the solar category are down relative to the September 2006 normalized period.<br />
The performance characteristics of the renewable energy <strong>in</strong>frastructure sectors vary and each<br />
has a different risk/return profile. The risk/return profile is a function of project life cycle.<br />
<strong>Renewable</strong> projects typically go through various phases <strong>in</strong>clud<strong>in</strong>g plann<strong>in</strong>g, permitt<strong>in</strong>g,<br />
procurement, f<strong>in</strong>anc<strong>in</strong>g, construction and, f<strong>in</strong>ally, operation. At each phase, the risk/return<br />
profile is very different and attracts different sorts of capital. The very early stages are<br />
analogues to venture capital, multiples of <strong>in</strong>vested capital over a 2 to 3 year period. This is<br />
similar to private equity style risk with an expected 25% to 30% IRR over a 2 to 3 year period.<br />
Mature <strong>in</strong>frastructure funds, however, target the less risky/lower return construction/operation<br />
stage with an expected average IRR of 10%+ over a 20-year period.<br />
Any renewable company or <strong>in</strong>frastructure fund will target different proportions of assets at<br />
different stages of development. In general, the listed renewable companies have a large<br />
exposure to assets <strong>in</strong> the plann<strong>in</strong>g and permitt<strong>in</strong>g stages. 39<br />
39 Historically, the listed market had valued these projects <strong>in</strong> l<strong>in</strong>e with their operat<strong>in</strong>g counterparts, apply<strong>in</strong>g the<br />
10%+ discount rate less a probability discount for the chance of the project be<strong>in</strong>g developed. In common with their<br />
NASDAQ list<strong>in</strong>g, these listed renewable shares were valued as growth stocks. As f<strong>in</strong>anc<strong>in</strong>g has dried up, the<br />
growth potential has dim<strong>in</strong>ished. The underly<strong>in</strong>g value of the operat<strong>in</strong>g assets, by contrast, has rema<strong>in</strong>ed roughly<br />
the same, generally <strong>in</strong> l<strong>in</strong>e with the resilient characteristics of <strong>in</strong>frastructure assets.<br />
24 Alternative <strong>Investments</strong>
W<strong>in</strong>d<br />
Solar<br />
Biofuels<br />
Mature <strong>in</strong>frastructure funds, by contrast, do not <strong>in</strong>vest <strong>in</strong> the “pipel<strong>in</strong>e” assets, as the<br />
development, permitt<strong>in</strong>g, f<strong>in</strong>anc<strong>in</strong>g, and construction risks do not meet the profile of such<br />
funds. Mature funds only target those assets which are operat<strong>in</strong>g or where the f<strong>in</strong>anc<strong>in</strong>g is <strong>in</strong><br />
place. Such mature funds also pass off the construction risk through an Eng<strong>in</strong>eer<strong>in</strong>g,<br />
Procurement and Construction (EPC) contract. 40<br />
Exhibit 23 summarizes some of the key takeaways for <strong>in</strong>frastructure <strong>in</strong>vestors focus<strong>in</strong>g on the<br />
various renewable energy <strong>in</strong>frastructure assets and presents <strong>in</strong>dicative returns.<br />
Exhibit 23<br />
Target <strong>Renewable</strong> <strong>Energy</strong> <strong>Infrastructure</strong> Sectors*<br />
Sector Characteristics Top Markets Project Return<br />
Most mature. Germany, US, 10% - 14%**<br />
Onshore<br />
Most technologically advanced. Denmark, Spa<strong>in</strong>,<br />
India, Ch<strong>in</strong>a<br />
As onshore sites become scarce, offshore has<br />
become best sites for w<strong>in</strong>d energy. Advantages<br />
Germany, UK 14% - 16%**<br />
Offshore<br />
<strong>in</strong>clude predictable w<strong>in</strong>d patterns and almost<br />
unlimited space for turb<strong>in</strong>es. Need to develop<br />
storage/transmission facilities. More expensive<br />
than onshore.<br />
Fastest grow<strong>in</strong>g sector. Germany, Spa<strong>in</strong>, 10% - 12%<br />
Becom<strong>in</strong>g more cost-effective as the cost of US, Ch<strong>in</strong>a, Heavily dependent<br />
Photovoltaic (PV) crystall<strong>in</strong>e silicon (its ma<strong>in</strong> component) decl<strong>in</strong>es. Japan on <strong>in</strong>centive<br />
Best use <strong>in</strong> smaller projects and <strong>in</strong>tegrated <strong>in</strong>to<br />
residential/commercial build<strong>in</strong>gs.<br />
regime<br />
Solar Thermal<br />
Electricity<br />
Generation (STEG)<br />
Ethanol<br />
Cellulosic and Next<br />
Generation Biofuels<br />
Very large solar plants best <strong>in</strong> desert locations. US, Spa<strong>in</strong>, 12% - 15%<br />
Concentrates heat of sun to generate steam that Israel, Italy,<br />
can be used efficiently <strong>in</strong> turb<strong>in</strong>es. Rema<strong>in</strong>s a less Egypt, Morocco,<br />
mature segment of solar energy <strong>in</strong>frastructure. Mexico<br />
Increas<strong>in</strong>gly controversial s<strong>in</strong>ce its feedstock, Brazil, US Not considered<br />
<strong>in</strong>put <strong>in</strong>to energy production, is a food staple <strong>in</strong> mature<br />
(corn and wheat) around the world. Has seen<br />
growth but viewed as jeopardiz<strong>in</strong>g food production.<br />
<strong>in</strong>frastructure funds<br />
Bypasses the debate of food versus fuel. Newer Brazil, US Not considered<br />
technology that uses non-food sources to <strong>in</strong> mature<br />
generate fuel <strong>in</strong>clud<strong>in</strong>g agriculture waste and<br />
algae. Less mature.<br />
<strong>in</strong>frastructure funds<br />
* Mature <strong>in</strong>frastructure funds also target waste to energy (13% - 15%) and m<strong>in</strong>i hydro (12% - 14%)<br />
** Depend<strong>in</strong>g upon nature of government support, feed-<strong>in</strong> tariff, ROC, etc.<br />
Source: <strong>RREEF</strong> Research based on analysis of The World Economic Forum on Green Invest<strong>in</strong>g, January 2009.<br />
In the current market, the dist<strong>in</strong>ction between development and operational renewable assets,<br />
especially for w<strong>in</strong>d farm projects, has become more pronounced. Many developers are look<strong>in</strong>g<br />
to monetize exist<strong>in</strong>g assets to fund new developments. Due to a dist<strong>in</strong>ct shortage of capital <strong>in</strong><br />
the market, they are <strong>in</strong>creas<strong>in</strong>gly look<strong>in</strong>g for partners to acquire developed w<strong>in</strong>d farms. As<br />
such, some <strong>in</strong>vestment returns for operational w<strong>in</strong>d farms have <strong>in</strong>creased from high s<strong>in</strong>gle<br />
digits as observed <strong>in</strong> 2006-2007 to 12-14% <strong>in</strong> markets which now have greater regulatory<br />
support.<br />
40<br />
Under an EPC contract, the contractor will design the <strong>in</strong>stallation, procure the necessary materials and<br />
construct it either through own labor or by subcontract<strong>in</strong>g part of the work. The contractor carries the project risk<br />
for schedule as well as budget <strong>in</strong> return for a fixed price, called Lump Sum or LSTK depend<strong>in</strong>g on the agreed<br />
scope of work.<br />
Alternative <strong>Investments</strong> 25
• Project name: Società Energie<br />
R<strong>in</strong>novabili w<strong>in</strong>d portfolio<br />
• Location: Italy<br />
Onshore w<strong>in</strong>d rema<strong>in</strong>s the most mature renewable sector and has been targeted by mature<br />
<strong>in</strong>frastructure funds. As a result, the case study we have chosen is an onshore w<strong>in</strong>d farm<br />
portfolio (see Exhibit 24).<br />
Case Study<br />
• Description: 16 w<strong>in</strong>d farms with a<br />
total capacity of 350MW located <strong>in</strong><br />
southern Italy (280MW <strong>in</strong> Sicily<br />
and 70MW <strong>in</strong> Puglia)<br />
• Significance: Despite tight<br />
market conditions <strong>in</strong> the second<br />
half of 2008, a total of 11 banks<br />
came onboard for Italy's largest<br />
greenfield w<strong>in</strong>d farm portfolio to<br />
date<br />
• Comments: Italy is <strong>in</strong>creas<strong>in</strong>gly<br />
draw<strong>in</strong>g attention from renewables<br />
developers and f<strong>in</strong>anciers attracted<br />
by good w<strong>in</strong>d conditions and strong<br />
government support<br />
Source: <strong>Infrastructure</strong> Journal and <strong>RREEF</strong> Research<br />
Exhibit 24<br />
Italian W<strong>in</strong>d: Società Energie R<strong>in</strong>novabili Case Study<br />
Sponsors<br />
Total senior debt<br />
Senior debt breakdown<br />
Mandated lead<br />
arrangers<br />
Participant banks<br />
Date of f<strong>in</strong>ancial close<br />
Expected return<br />
50.1per cent - api nòva energia<br />
49.9 per cent - Iberdrola Renovables<br />
€603.9 million<br />
Facility A - SER 1 w<strong>in</strong>d farm non-eligible debt<br />
Bridge Facility<br />
Law 488 Bank Loan - commercial loan fronted by RBS<br />
Law 488 CDP - f<strong>in</strong>anced only by CDP<br />
Facility C - SER w<strong>in</strong>d farms<br />
Two Work<strong>in</strong>g Capital Facilities<br />
VAT Facility<br />
RBS - €84.9 million<br />
BBVA - €74 million<br />
BNP Paribas - €74 million<br />
Calyon - €40 million<br />
Fortis - €40 million<br />
ING - €74 million<br />
Intesa - €74 million<br />
UniCredit - €74 million<br />
Banca delle Marche - €30 million<br />
Banca Toscana - €25 million<br />
Centrobanca - €14 million<br />
17 November 2008<br />
10 – 15%<br />
Conclusion and Implications for Investors<br />
<strong>Renewable</strong> energy <strong>in</strong>vestments can play an important role <strong>in</strong> pension fund portfolios. The<br />
<strong>in</strong>vestment environment surround<strong>in</strong>g renewables is compell<strong>in</strong>g given the grow<strong>in</strong>g and<br />
cont<strong>in</strong>ued demand for energy, the projected rise <strong>in</strong> fossil fuel prices, concerns over traditional<br />
supplies of energy, and the global threat of climate change which should give rise to greater<br />
government <strong>in</strong>tervention and policies govern<strong>in</strong>g the emission of carbon and methane.<br />
Over time, given the unique features of such renewable <strong>in</strong>frastructure <strong>in</strong>vestments, we expect<br />
a lower correlation with traditional asset classes. As such, these <strong>in</strong>vestments can help<br />
diversify a broader, multi-asset portfolio. For <strong>in</strong>vestors that are also concerned with the carbon<br />
footpr<strong>in</strong>t of traditional fossil fuel sources of energy, socially responsible <strong>in</strong>vestments <strong>in</strong><br />
renewables are highly appeal<strong>in</strong>g.<br />
26 Alternative <strong>Investments</strong>
Important disclosure<br />
© 2009. All rights reserved.<br />
No further distribution is allowed without prior written consent of the Issuer.<br />
<strong>RREEF</strong> is the brand name of the real estate, <strong>in</strong>frastructure and private equity division for the asset management activities of<br />
Deutsche Bank AG. In the US this relates to the asset management activities of <strong>RREEF</strong> America L.L.C.; <strong>in</strong> Germany: <strong>RREEF</strong><br />
Investment GmbH, <strong>RREEF</strong> Management GmbH, and <strong>RREEF</strong> Spezial Invest GmbH; <strong>in</strong> Australia: Deutsche Asset Management<br />
(Australia) Limited (ABN 63 116 232 154) Australian f<strong>in</strong>ancial services license holder; <strong>in</strong> Hong Kong: Deutsche Asset Management<br />
(Hong Kong) Limited (“DeAMHK”); <strong>in</strong> Japan: Deutsche Securities Inc. (*); <strong>in</strong> S<strong>in</strong>gapore, Deutsche Asset Management (Asia)<br />
Limited (Company Reg. No. 198701485N) and <strong>in</strong> the United K<strong>in</strong>gdom, <strong>RREEF</strong> Limited, <strong>RREEF</strong> Global Advisers Limited, and<br />
Deutsche Asset Management (UK) Limited; <strong>in</strong> addition to other regional entities <strong>in</strong> the Deutsche Bank Group.<br />
(*) For DSI, f<strong>in</strong>ancial advisory (not <strong>in</strong>vestment advisory) and distribution services only.<br />
Key <strong>RREEF</strong> research personnel, <strong>in</strong>clud<strong>in</strong>g Asieh Mansour, Chief Economist and Strategist and Peter Hobbs, Head of <strong>Real</strong> <strong>Estate</strong><br />
Research are vot<strong>in</strong>g members of the <strong>in</strong>vestment committee of certa<strong>in</strong> of the <strong>RREEF</strong> Alternative Investment Funds. Members of the<br />
<strong>in</strong>vestment committees vote with respect to underly<strong>in</strong>g <strong>in</strong>vestments and/or transactions and certa<strong>in</strong> other matters subjected to a<br />
vote of such <strong>in</strong>vestment committee. Additionally, research personnel receive, and may <strong>in</strong> the future receive <strong>in</strong>centive compensation<br />
based on the performance of a certa<strong>in</strong> <strong>in</strong>vestment accounts and <strong>in</strong>vestment vehicles managed by <strong>RREEF</strong> and its affiliates.<br />
This material is <strong>in</strong>tended for <strong>in</strong>formational purposes only and it is not <strong>in</strong>tended that it be relied on to make any <strong>in</strong>vestment decision.<br />
It does not constitute <strong>in</strong>vestment advice or a recommendation or an offer or solicitation and is not the basis for any contract to<br />
purchase or sell any security or other <strong>in</strong>strument, or for Deutsche Bank AG and its affiliates to enter <strong>in</strong>to or arrange any type of<br />
transaction as a consequence of any <strong>in</strong>formation conta<strong>in</strong>ed here<strong>in</strong>. Neither Deutsche Bank AG nor any of its affiliates, gives any<br />
warranty as to the accuracy, reliability or completeness of <strong>in</strong>formation which is conta<strong>in</strong>ed <strong>in</strong> this document. Except <strong>in</strong>sofar as<br />
liability under any statute cannot be excluded, no member of the Deutsche Bank Group, the Issuer or any officer, employee or<br />
associate of them accepts any liability (whether aris<strong>in</strong>g <strong>in</strong> contract, <strong>in</strong> tort or negligence or otherwise) for any error or omission <strong>in</strong><br />
this document or for any result<strong>in</strong>g loss or damage whether direct, <strong>in</strong>direct, consequential or otherwise suffered by the recipient of<br />
this document or any other person.<br />
The views expressed <strong>in</strong> this document constitute Deutsche Bank AG or its affiliates’ judgment at the time of issue and are subject<br />
to change. This document is only for professional <strong>in</strong>vestors. This document was prepared without regard to the specific objectives,<br />
f<strong>in</strong>ancial situation or needs of any particular person who may receive it. No further distribution is allowed without prior written<br />
consent of the Issuer.<br />
An <strong>in</strong>vestment <strong>in</strong> real estate <strong>in</strong>volves a high degree of risk and is suitable only for sophisticated <strong>in</strong>vestors who can bear substantial<br />
<strong>in</strong>vestment losses. The value of shares/units and their derived <strong>in</strong>come may fall as well as rise. Past performance or any prediction<br />
or forecast is not <strong>in</strong>dicative of future results.<br />
The forecasts provided are based upon our op<strong>in</strong>ion of the market as at this date and are subject to change, dependent on future<br />
changes <strong>in</strong> the market. Any prediction, projection or forecast on the economy, stock market, bond market or the economic trends of<br />
the markets is not necessarily <strong>in</strong>dicative of the future or likely performance.<br />
For Investors <strong>in</strong> the United K<strong>in</strong>gdom:<br />
Issued <strong>in</strong> the United K<strong>in</strong>gdom by <strong>RREEF</strong> Limited or <strong>RREEF</strong> Global Advisers Limited of One Appold Street, London, EC2A 2UU.<br />
Authorised and regulated by the F<strong>in</strong>ancial Services Authority. This document is a “non-retail communication” with<strong>in</strong> the mean<strong>in</strong>g of<br />
the FSA’s Rules and is directed only at persons satisfy<strong>in</strong>g the FSA’s client categorisation criteria for an eligible counterparty or a<br />
professional client. This document is not <strong>in</strong>tended for and should not be relied upon by a retail client.<br />
When mak<strong>in</strong>g an <strong>in</strong>vestment decision, potential <strong>in</strong>vestors should rely solely on the f<strong>in</strong>al documentation relat<strong>in</strong>g to the <strong>in</strong>vestment or<br />
service and not the <strong>in</strong>formation conta<strong>in</strong>ed here<strong>in</strong>. The <strong>in</strong>vestments or services mentioned here<strong>in</strong> may not be appropriate for all<br />
<strong>in</strong>vestors and before enter<strong>in</strong>g <strong>in</strong>to any transaction you should take steps to ensure that you fully understand the transaction and<br />
have made an <strong>in</strong>dependent assessment of the appropriateness of the transaction <strong>in</strong> the light of your own objectives and<br />
circumstances, <strong>in</strong>clud<strong>in</strong>g the possible risks and benefits of enter<strong>in</strong>g <strong>in</strong>to such transaction. You should also consider seek<strong>in</strong>g advice<br />
from your own advisers <strong>in</strong> mak<strong>in</strong>g this assessment. If you decide to enter <strong>in</strong>to a transaction with us you do so <strong>in</strong> reliance on your<br />
own judgment.<br />
For Investors <strong>in</strong> Australia:<br />
In Australia, Issued by Deutsche Asset Management (Australia) Limited (ABN 63 116 232 154), holder of an Australian F<strong>in</strong>ancial<br />
Services License. An <strong>in</strong>vestment with Deutsche Asset Management is not a deposit with or any other type of liability of Deutsche<br />
Bank AG ARBN 064 165 162, Deutsche Asset Management (Australia) Limited or any other member of the Deutsche Bank AG<br />
Group. The capital value of and performance of an <strong>in</strong>vestment with Deutsche Asset Management is not guaranteed by Deutsche<br />
Bank AG, Deutsche Asset Management (Australia) Limited or any other member of the Deutsche Bank Group. <strong>Investments</strong> are<br />
subject to <strong>in</strong>vestment risk, <strong>in</strong>clud<strong>in</strong>g possible delays <strong>in</strong> repayment and loss of <strong>in</strong>come and pr<strong>in</strong>cipal <strong>in</strong>vested.<br />
For Investors <strong>in</strong> Hong Kong:<br />
Interests <strong>in</strong> the funds may not be offered or sold <strong>in</strong> Hong Kong or other jurisdictions, by means of an advertisement, <strong>in</strong>vitation or<br />
any other document, other than to Professional Investors or <strong>in</strong> circumstances that do not constitute an offer<strong>in</strong>g to the public. This<br />
document is therefore for the use of Professional Investors only and as such, is not approved under the Securities and Futures<br />
Ord<strong>in</strong>ance (SFO) or the Companies Ord<strong>in</strong>ance and shall not be distributed to non-Professional Investors <strong>in</strong> Hong Kong or to<br />
anyone <strong>in</strong> any other jurisdiction <strong>in</strong> which such distribution is not authorised. For the purposes of this statement, a Professional<br />
<strong>in</strong>vestor is def<strong>in</strong>ed under the SFO.<br />
For <strong>in</strong>vestors <strong>in</strong> MENA region:<br />
This <strong>in</strong>formation has been provided to you by Deutsche Bank AG Dubai (DIFC) branch, an Authorised Firm regulated by the Dubai<br />
F<strong>in</strong>ancial Services Authority. It is solely directed at Market Counterparties or Professional Clients of Deutsche Bank AG Dubai<br />
(DIFC) branch, which meets the regulatory criteria as established by the Dubai F<strong>in</strong>ancial Services Authority and may not be<br />
delivered to or acted upon by any other person.<br />
Alternative <strong>Investments</strong> 27
Ma<strong>in</strong> Offices<br />
Frankfurt<br />
Alfred-Herrhausen-Allee 16-24<br />
65760 Eschborn<br />
Tel: +49 69 71704 906<br />
Hong Kong<br />
48/F Cheung Kong Centre<br />
2 Queen’s Road Central<br />
Hong Kong<br />
Tel: +852 2203 8888<br />
London<br />
1 Appold Street<br />
Broadgate<br />
London<br />
EC2A 2UU<br />
United K<strong>in</strong>gdom<br />
Tel: +44 20 7545 8000<br />
New York<br />
280 Park Avenue<br />
23W Floor<br />
New York<br />
NY10017-1270<br />
United States<br />
Tel:+1 212 454 3900<br />
San Francisco<br />
101 California Street<br />
26 th Floor<br />
San Francisco<br />
CA 94111<br />
United States<br />
Tel:+1 415 781 3300<br />
Tokyo<br />
Floor 17<br />
Sanno Park Tower<br />
2-11-1 Nagata-cho<br />
Chiyoda-Ku<br />
Japan<br />
Tel:+81 3 5156 6000<br />
Publication Address:<br />
<strong>RREEF</strong><br />
101 California Street<br />
26 th Floor<br />
San Francisco, CA 94111<br />
USA<br />
Website:<br />
www.rreef.com<br />
Additional <strong>in</strong>formation is<br />
available upon request<br />
I-013568-2.0<br />
<strong>RREEF</strong> Research<br />
<strong>RREEF</strong> Research<br />
Peter Hobbs<br />
Head, Global <strong>Real</strong> <strong>Estate</strong> Research<br />
+44 20 7547 4855<br />
Europe<br />
Brenna O’Roarty<br />
Director<br />
+44 20 7545 6099<br />
Maren Väth<br />
Vice President<br />
+49 69 717 04 466<br />
Just<strong>in</strong> Curlow<br />
Assistant Vice President<br />
+44 20 7545 9682<br />
Jarek Morawski<br />
Assistant Vice President<br />
+49 69 717 04 204<br />
Asia Pacific<br />
Tan Yen Keng<br />
Vice President<br />
+852 2203 8062<br />
Koichiro Obu<br />
Vice President<br />
+81 3 5156 6522<br />
Henry (Wei) Ch<strong>in</strong><br />
Vice President<br />
+852 2203 7908<br />
Asieh Mansour<br />
Chief Economist and Strategist<br />
+1 415 262 2044<br />
North America<br />
Alan Bill<strong>in</strong>gsley<br />
Director<br />
+1 415 262 2017<br />
Brooks Wells<br />
Director<br />
+1 212 454 6437<br />
Andrew J. Nelson<br />
Vice President<br />
+1 415 262 7735<br />
Bill Hersler<br />
Vice President<br />
+1 415 262 2075<br />
Ross Adams<br />
Vice President<br />
+1 415 262 2097<br />
Jaimala Patel<br />
Vice President<br />
+1 212 454 1752<br />
Terence Callahan<br />
Assistant Vice President<br />
+1 415 262 6432<br />
Stella Yun Xu<br />
Assistant Vice President<br />
+1 415 262 7715