Infrastructure Investments in Renewable Energy - RREEF Real Estate
Infrastructure Investments in Renewable Energy - RREEF Real Estate
Infrastructure Investments in Renewable Energy - RREEF Real Estate

Create successful ePaper yourself
Turn your PDF publications into a flip-book with our unique Google optimized e-Paper software.
300<br />
250<br />
200<br />
150<br />
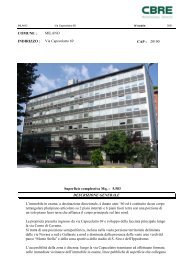
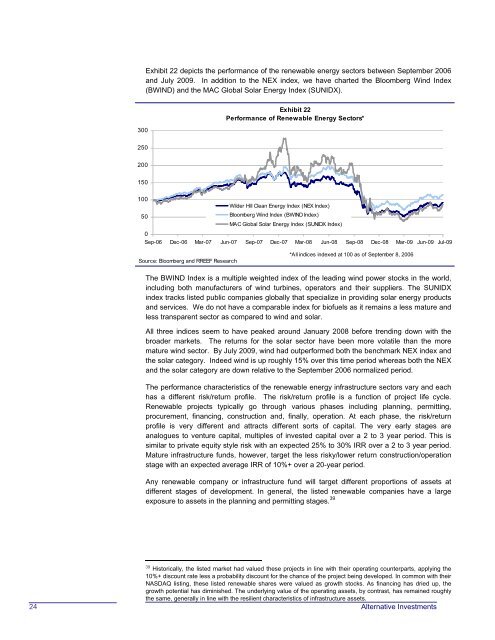
Exhibit 22 depicts the performance of the renewable energy sectors between September 2006<br />
and July 2009. In addition to the NEX <strong>in</strong>dex, we have charted the Bloomberg W<strong>in</strong>d Index<br />
(BWIND) and the MAC Global Solar <strong>Energy</strong> Index (SUNIDX).<br />
Exhibit 22<br />
Performance of <strong>Renewable</strong> <strong>Energy</strong> Sectors*<br />
100<br />
50<br />
0<br />
Wilder Hill Clean <strong>Energy</strong> Index (NEX Index)<br />
Bloomberg W<strong>in</strong>d Index (BWIND Index)<br />
MAC Global Solar <strong>Energy</strong> Index (SUNIDX Index)<br />
Sep-06 Dec-06 Mar-07 Jun-07 Sep-07 Dec-07 Mar-08 Jun-08 Sep-08 Dec-08 Mar-09 Jun-09<br />
Jul-09<br />
Source: Bloomberg and <strong>RREEF</strong> Research<br />
*All <strong>in</strong>dices <strong>in</strong>dexed at 100 as of September 8, 2006<br />
The BWIND Index is a multiple weighted <strong>in</strong>dex of the lead<strong>in</strong>g w<strong>in</strong>d power stocks <strong>in</strong> the world,<br />
<strong>in</strong>clud<strong>in</strong>g both manufacturers of w<strong>in</strong>d turb<strong>in</strong>es, operators and their suppliers. The SUNIDX<br />
<strong>in</strong>dex tracks listed public companies globally that specialize <strong>in</strong> provid<strong>in</strong>g solar energy products<br />
and services. We do not have a comparable <strong>in</strong>dex for biofuels as it rema<strong>in</strong>s a less mature and<br />
less transparent sector as compared to w<strong>in</strong>d and solar.<br />
All three <strong>in</strong>dices seem to have peaked around January 2008 before trend<strong>in</strong>g down with the<br />
broader markets. The returns for the solar sector have been more volatile than the more<br />
mature w<strong>in</strong>d sector. By July 2009, w<strong>in</strong>d had outperformed both the benchmark NEX <strong>in</strong>dex and<br />
the solar category. Indeed w<strong>in</strong>d is up roughly 15% over this time period whereas both the NEX<br />
and the solar category are down relative to the September 2006 normalized period.<br />
The performance characteristics of the renewable energy <strong>in</strong>frastructure sectors vary and each<br />
has a different risk/return profile. The risk/return profile is a function of project life cycle.<br />
<strong>Renewable</strong> projects typically go through various phases <strong>in</strong>clud<strong>in</strong>g plann<strong>in</strong>g, permitt<strong>in</strong>g,<br />
procurement, f<strong>in</strong>anc<strong>in</strong>g, construction and, f<strong>in</strong>ally, operation. At each phase, the risk/return<br />
profile is very different and attracts different sorts of capital. The very early stages are<br />
analogues to venture capital, multiples of <strong>in</strong>vested capital over a 2 to 3 year period. This is<br />
similar to private equity style risk with an expected 25% to 30% IRR over a 2 to 3 year period.<br />
Mature <strong>in</strong>frastructure funds, however, target the less risky/lower return construction/operation<br />
stage with an expected average IRR of 10%+ over a 20-year period.<br />
Any renewable company or <strong>in</strong>frastructure fund will target different proportions of assets at<br />
different stages of development. In general, the listed renewable companies have a large<br />
exposure to assets <strong>in</strong> the plann<strong>in</strong>g and permitt<strong>in</strong>g stages. 39<br />
39 Historically, the listed market had valued these projects <strong>in</strong> l<strong>in</strong>e with their operat<strong>in</strong>g counterparts, apply<strong>in</strong>g the<br />
10%+ discount rate less a probability discount for the chance of the project be<strong>in</strong>g developed. In common with their<br />
NASDAQ list<strong>in</strong>g, these listed renewable shares were valued as growth stocks. As f<strong>in</strong>anc<strong>in</strong>g has dried up, the<br />
growth potential has dim<strong>in</strong>ished. The underly<strong>in</strong>g value of the operat<strong>in</strong>g assets, by contrast, has rema<strong>in</strong>ed roughly<br />
the same, generally <strong>in</strong> l<strong>in</strong>e with the resilient characteristics of <strong>in</strong>frastructure assets.<br />
24 Alternative <strong>Investments</strong>