Infrastructure Investments in Renewable Energy - RREEF Real Estate
Infrastructure Investments in Renewable Energy - RREEF Real Estate
Infrastructure Investments in Renewable Energy - RREEF Real Estate

Create successful ePaper yourself
Turn your PDF publications into a flip-book with our unique Google optimized e-Paper software.
Volatility measures are proxied by the first-order standard deviation. In each case, a five-year<br />
standard deviation is calculated s<strong>in</strong>ce the NEX does not go back further than five years.<br />
As is reflected <strong>in</strong> the first and third-year returns, all asset classes with the exception of bonds<br />
have been hit hard <strong>in</strong> this downturn. The highly volatile oil and natural gas markets were the<br />
worst hit on a one-year basis followed by the listed renewables NEX <strong>in</strong>dex. The NEX is a<br />
publicly-traded benchmark and is likely much more volatile than privately-held energy<br />
<strong>in</strong>frastructure assets. Listed <strong>in</strong>frastructure vehicles have also been hurt, <strong>in</strong> l<strong>in</strong>e with the<br />
broader equity market averages. A large number of <strong>in</strong>frastructure vehicles tend to now be<br />
traded at a discount to the values of the underly<strong>in</strong>g assets. In many <strong>in</strong>stances, renewables,<br />
such as solar and w<strong>in</strong>d, are suffer<strong>in</strong>g the same fate as the broader <strong>in</strong>frastructure asset class,<br />
trad<strong>in</strong>g at less than replacement cost of assets currently <strong>in</strong> production. Given the highly<br />
capital-<strong>in</strong>tensive nature of renewables, a lack of available f<strong>in</strong>anc<strong>in</strong>g and a pullback <strong>in</strong><br />
government subsidies, especially <strong>in</strong> Europe (Spa<strong>in</strong> and Germany) have hurt performance.<br />
Based on the economic drivers of renewables, we expect that demand should rebound dur<strong>in</strong>g<br />
the latter part of 2009 and early 2010 with improved f<strong>in</strong>anc<strong>in</strong>g conditions and the surge <strong>in</strong> the<br />
various government stimulus programs target<strong>in</strong>g alternative energy sources.<br />
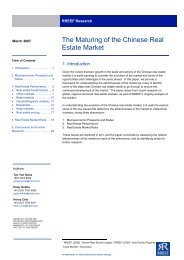
Exhibit 19 shows the performance of renewables <strong>in</strong> comparison to equities, bonds, and oil<br />
s<strong>in</strong>ce 2003. The NEX <strong>in</strong>dex outperformed the broader market <strong>in</strong>dices and oil through year-end<br />
2007. Between 2003 to the end of 2007, the NEX <strong>in</strong>dex grew over 40% per year. By the<br />
second half of 2008, the NEX succumbed to the unfold<strong>in</strong>g credit crisis. Indeed, publicly listed<br />
renewable energy firms were not immune to the f<strong>in</strong>ancial crisis and NEX returns fell <strong>in</strong> l<strong>in</strong>e with<br />
the broader market through March 2009. Given the deterioration <strong>in</strong> f<strong>in</strong>ancial conditions and<br />
lower oil and natural gas prices, <strong>in</strong>vestments <strong>in</strong> publicly-listed renewable energy firms decl<strong>in</strong>ed<br />
significantly. Dur<strong>in</strong>g 2008 and early 2009, fewer renewable firms went public, add<strong>in</strong>g to the<br />
decl<strong>in</strong>e <strong>in</strong> market performance. The risk aversion that had gripped the market through the first<br />
quarter of 2009 also saw a rotation of capital away from any new high-technology sector,<br />
<strong>in</strong>clud<strong>in</strong>g renewable energy. Indeed, back test<strong>in</strong>g suggests a fairly high correlation between<br />
the NEX and NASDAQ between 2000 and 2003, when many renewable energy stocks were<br />
seen as technology plays. This clearly changed, however, as renewable energy <strong>in</strong>frastructure<br />
matured <strong>in</strong>to its own <strong>in</strong>vestment sector. More recently, the correlation of NEX is highest with oil<br />
prices and broader <strong>in</strong>frastructure assets.<br />
Exhibit 19<br />
NEX vs. Broader Equity Markets*<br />
500<br />
450<br />
Amex Oil (OXH Index)<br />
400<br />
Wilder Hill Clean <strong>Energy</strong> Index (NEX Index)<br />
350<br />
MSCI World Index (MXWO Index)<br />
300<br />
250<br />
200<br />
150<br />
100<br />
50<br />
0<br />
JPM Global Aggregate Bond Index (JGAGGUSD Index)<br />
Dec-02 Jun-03 Dec-03 Jun-04 Dec-04 Jun-05 Dec-05 Jun-06 Dec-06 Jun-07 Dec-07 Jun-08 Dec-08 Jun-09<br />
Source: Bloomberg and <strong>RREEF</strong> Research<br />
*All <strong>in</strong>dices <strong>in</strong>dexed at 100 as of year end 2002<br />
Over the past quarter, however, the NEX <strong>in</strong>dex has rebounded at a stronger pace than the<br />
broader market. Our expectation is that the structural and cyclical drivers of the renewables<br />
sector will be positive for the long-term outlook for <strong>in</strong>vestment returns garnered from such<br />
38<br />
Please see “<strong>Infrastructure</strong> Funds: The Role of <strong>Energy</strong> Assets”, October 2008<br />
Alternative <strong>Investments</strong> 21