


You also want an ePaper? Increase the reach of your titles
YUMPU automatically turns print PDFs into web optimized ePapers that Google loves.
Ocean Health Index - <strong>Kenya</strong> <strong>2018</strong> 12<br />
1. To avoid sensitivities on demarcating ocean boundaries between counties, report from point samples<br />
within each county.<br />
2. Consider using ecological or geomorphological units, such as Tudor Creek, Ungwana bay etc. provided<br />
relevant information is available<br />
3. Consider other offshore boundaries for county zones, such as 5nM to match artisanal fishing practices,<br />
the contiguous boundary of 24nM (recognized under UNCLOS).<br />
4. Results<br />
A complete analysis of all 10 goals was neither targeted nor possible during this project. The priority goals<br />
were assessed through a series of focused <strong>Technical</strong> Team meetings and consultations with Advisory Team<br />
members to discuss data availability, reference points, targets, goal models etc.<br />
4.1. Food provision: Fisheries<br />
The Fisheries sub-goal aims to describe the amount of wild-caught seafood harvested and its sustainability<br />
for human consumption. The model used in the OHI global assessment compares fish catch landings with<br />
Maximum Sustainable Yield. A score of 100 means the country or region is harvesting seafood to the<br />
ecosystem’s optimum production potential in a sustainable manner.<br />
For this assessment, only artisanal fisheries and the semi-industrial prawn-trawling fishery were assessed<br />
for the 5 coastal counties within the territorial waters.<br />
Data<br />
4.1.1. Methods<br />
Long time-series catch, effort and length-based fish species data was the ideal data required, from which<br />
fisheries assessment models could be calculated to assess the status and sustainability at a county-scale.<br />
<strong>Kenya</strong> has a consistent long-term catch monitoring system recording only total catches for certain taxa<br />
implemented by <strong>Kenya</strong> Fisheries Service (KeFS). More detailed information (effort, length-based<br />
estimates) has been collected by various institutions at specific landing sites, however this is generally<br />
project based and only runs for a few years. Detailed stock assessments of <strong>Kenya</strong>n coastal fisheries is still<br />
fairly scanty (Table 2).<br />
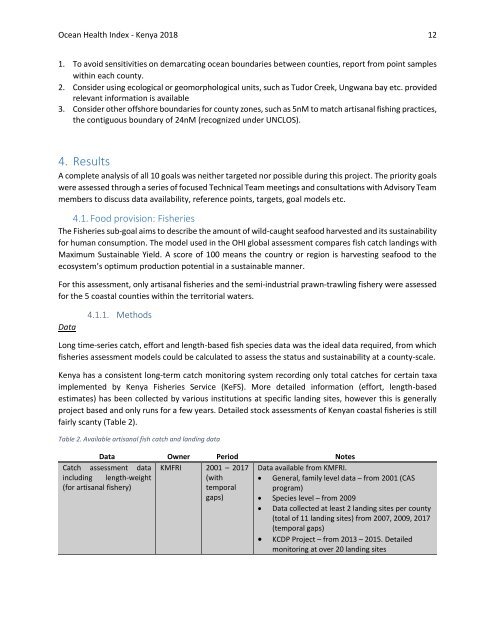
Table 2. Available artisanal fish catch and landing data<br />
Data Owner Period Notes<br />
Catch assessment data KMFRI 2001 – 2017 Data available from KMFRI.<br />
including length-weight<br />
(with • General, family level data – from 2001 (CAS<br />
(for artisanal fishery)<br />
temporal program)<br />
gaps) • Species level – from 2009<br />
• Data collected at least 2 landing sites per county<br />
(total of 11 landing sites) from 2007, 2009, 2017<br />
(temporal gaps)<br />
• KCDP Project – from 2013 – 2015. Detailed<br />
monitoring at over 20 landing sites


