


You also want an ePaper? Increase the reach of your titles
YUMPU automatically turns print PDFs into web optimized ePapers that Google loves.
Ocean Health Index - <strong>Kenya</strong> <strong>2018</strong> 35<br />
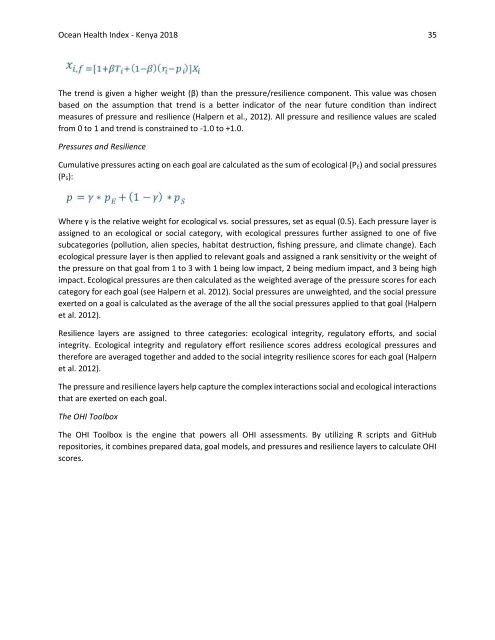
The trend is given a higher weight (β) than the pressure/resilience component. This value was chosen<br />
based on the assumption that trend is a better indicator of the near future condition than indirect<br />
measures of pressure and resilience (Halpern et al., 2012). All pressure and resilience values are scaled<br />
from 0 to 1 and trend is constrained to -1.0 to +1.0.<br />
Pressures and Resilience<br />
Cumulative pressures acting on each goal are calculated as the sum of ecological (P E ) and social pressures<br />
(P S ):<br />
Where γ is the relative weight for ecological vs. social pressures, set as equal (0.5). Each pressure layer is<br />
assigned to an ecological or social category, with ecological pressures further assigned to one of five<br />
subcategories (pollution, alien species, habitat destruction, fishing pressure, and climate change). Each<br />
ecological pressure layer is then applied to relevant goals and assigned a rank sensitivity or the weight of<br />
the pressure on that goal from 1 to 3 with 1 being low impact, 2 being medium impact, and 3 being high<br />
impact. Ecological pressures are then calculated as the weighted average of the pressure scores for each<br />
category for each goal (see Halpern et al. 2012). Social pressures are unweighted, and the social pressure<br />
exerted on a goal is calculated as the average of the all the social pressures applied to that goal (Halpern<br />
et al. 2012).<br />
Resilience layers are assigned to three categories: ecological integrity, regulatory efforts, and social<br />
integrity. Ecological integrity and regulatory effort resilience scores address ecological pressures and<br />
therefore are averaged together and added to the social integrity resilience scores for each goal (Halpern<br />
et al. 2012).<br />
The pressure and resilience layers help capture the complex interactions social and ecological interactions<br />
that are exerted on each goal.<br />
The OHI Toolbox<br />
The OHI Toolbox is the engine that powers all OHI assessments. By utilizing R scripts and GitHub<br />
repositories, it combines prepared data, goal models, and pressures and resilience layers to calculate OHI<br />
scores.


