


You also want an ePaper? Increase the reach of your titles
YUMPU automatically turns print PDFs into web optimized ePapers that Google loves.
Ocean Health Index - <strong>Kenya</strong> <strong>2018</strong> 36<br />
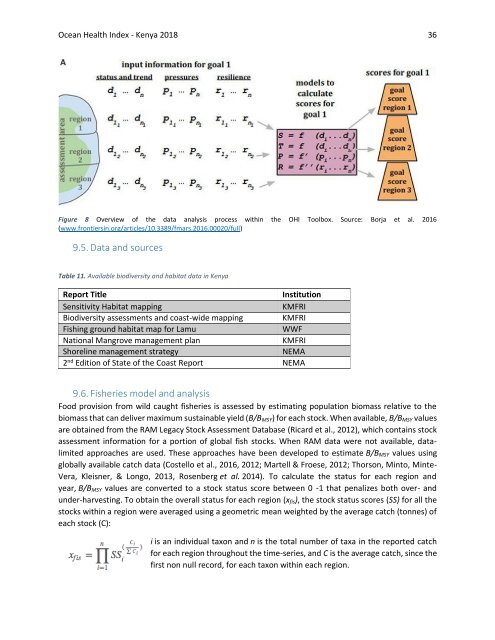
Figure 8 Overview of the data analysis process within the OHI Toolbox. Source: Borja et al. 2016<br />
(www.frontiersin.org/articles/10.3389/fmars.2016.00020/full)<br />
9.5. Data and sources<br />
Table 11. Available biodiversity and habitat data in <strong>Kenya</strong><br />
<strong>Report</strong> Title<br />
Institution<br />
Sensitivity Habitat mapping<br />
KMFRI<br />
Biodiversity assessments and coast-wide mapping KMFRI<br />
Fishing ground habitat map for Lamu<br />
WWF<br />
National Mangrove management plan<br />
KMFRI<br />
Shoreline management strategy<br />
NEMA<br />
2 nd Edition of State of the Coast <strong>Report</strong> NEMA<br />
9.6. Fisheries model and analysis<br />
Food provision from wild caught fisheries is assessed by estimating population biomass relative to the<br />
biomass that can deliver maximum sustainable yield (B/B MSY ) for each stock. When available, B/B MSY values<br />
are obtained from the RAM Legacy Stock Assessment Database (Ricard et al., 2012), which contains stock<br />
assessment information for a portion of global fish stocks. When RAM data were not available, datalimited<br />
approaches are used. These approaches have been developed to estimate B/B MSY values using<br />
globally available catch data (Costello et al., 2016, 2012; Martell & Froese, 2012; Thorson, Minto, Minte-<br />
Vera, Kleisner, & Longo, 2013, Rosenberg et al. 2014). To calculate the status for each region and<br />
year, B/B MSY values are converted to a stock status score between 0 -1 that penalizes both over- and<br />
under-harvesting. To obtain the overall status for each region (x fis ), the stock status scores (SS) for all the<br />
stocks within a region were averaged using a geometric mean weighted by the average catch (tonnes) of<br />
each stock (C):<br />
i is an individual taxon and n is the total number of taxa in the reported catch<br />
for each region throughout the time-series, and C is the average catch, since the<br />
first non null record, for each taxon within each region.


