


You also want an ePaper? Increase the reach of your titles
YUMPU automatically turns print PDFs into web optimized ePapers that Google loves.
Ocean Health Index - <strong>Kenya</strong> <strong>2018</strong> 13<br />
Marine Fish Production<br />
data<br />
Fisheries Frame Survey KeFs 2012, 2014,<br />
2016<br />
CAS data (artisanal) CORDIO 1999-2006,<br />
2009-2010,<br />
2015-2016<br />
KCDP stock assessment<br />
technical reports<br />
Catch assessment data KeFS 2013-2017 Data has information on fishing grounds, landing<br />
(CAS) including lengthweight<br />
sites, effort and gear. Some vessels record data at<br />
the species level.<br />
Catch and effort data KeFS 2013 – 2015 Data contains artisanal landings; Shallow and deepwater<br />
trawl data, long line fisheries data.<br />
KeFS 2002 – 2016 Data is at the family level and is not linked to gears,<br />
or Fisheries grounds.<br />
Data is reported at county level; previously recorded<br />
at district level under the old governance structure.<br />
Survey reports are produced after every 2 years<br />
outlining information on fish production factors e.g.<br />
fishing effort.<br />
Data is collected up to species level, from Diani-<br />
Chale (5-6 landing sites), Msambweni (5 landing sites<br />
from Gazi, Mkunguni, Mwandamo, Mwaembe,<br />
Munje). Data includes Fish Aggregating Devices<br />
(FADs) data<br />
KMFRI 2013 - 2015 Small and medium pelagics, Siganus sutor, Malindi-<br />
Ungwana Bay small-scale prawn fishery<br />
Reference point<br />
The global assessment uses the Maximum Sustainable Yield (MSY) as a reference point to assess<br />
sustainability. For tropical fisheries which are multi-gear and multi-species, alternative models were<br />
considered such as Maximum Economic Yield, Spawning Potential Ratio (Spawning stock biomass) and<br />
Production-Biomass (area-based productivity measure for different habitats). In the end, MSY was<br />
selected to maintain consistency with the models developed for the global OHI analysis, and because the<br />
quality and availability of data limited use of other models.<br />
Taxa selection<br />
Fish taxa were selected on the basis that they contribute to food provision in the country. 25 fish taxa at<br />
various identification levels (species, genus, family) were used in the analysis, filtered from a more<br />
extensive list used in the global analysis through expert judgment (Table 3). Out of these, 6 taxa had longterm<br />
catch data at a county resolution, and for the other stocks, catch data were acquired from the global<br />
OHI dataset (detailed explanation in Appendix section 9.5. Fisheries model and analysis).<br />
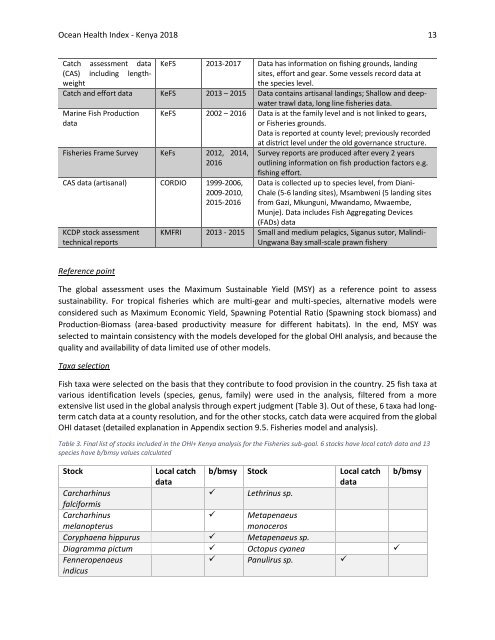
Table 3. Final list of stocks included in the <strong>OHI+</strong> <strong>Kenya</strong> analysis for the Fisheries sub-goal. 6 stocks have local catch data and 13<br />
species have b/bmsy values calculated<br />
Stock<br />
Local catch b/bmsy Stock Local catch b/bmsy<br />
data<br />
data<br />
Carcharhinus<br />
✓ Lethrinus sp.<br />
falciformis<br />
Carcharhinus<br />
melanopterus<br />
✓ Metapenaeus<br />
monoceros<br />
Coryphaena hippurus ✓ Metapenaeus sp.<br />
Diagramma pictum ✓ Octopus cyanea ✓<br />
Fenneropenaeus<br />
indicus<br />
✓ Panulirus sp. ✓


