Numerical simulations of SFRC precast tunnel segments
Numerical simulations of SFRC precast tunnel segments
Numerical simulations of SFRC precast tunnel segments

Create successful ePaper yourself
Turn your PDF publications into a flip-book with our unique Google optimized e-Paper software.
Table 1. Concrete composition (quantities refer to 1 m 3 ).<br />
2 MATERIALS<br />
Weight [Kg] Volume [l]<br />
Cement Portland 52,5R 425 134,92<br />
Water 142 142<br />
Superplasticiser – 3,20<br />
Aggregates 1885 699,88<br />
Air assumed – 20,00<br />
Water/cement ratio 0,33 –<br />
Table 2. Geometrical characteristic <strong>of</strong> the fibers.<br />
Fiber L f � f L f/� f<br />
code [mm] [mm] [-] Fiber shape<br />
Wirand 50.0 1.00 50.0<br />
FF1<br />
Wirand 50.0 0.75 67.0<br />
FF3<br />
The concrete matrix was made with cement CEM I<br />
52.5R (UNI-ENV 197) and a natural river gravel with<br />
a rounded shape and a maximum diameter <strong>of</strong> 15 mm;<br />
its composition is summarized in Table 1. The grain<br />
size distribution <strong>of</strong> aggregates was chosen very close<br />
to the Bolomey curve by using nine classes <strong>of</strong> aggregates.<br />
An acrylic based super-plasticizer was used.<br />
The two different types <strong>of</strong> fibers that were considered<br />
in this research are reported in Table 2 where<br />
the fiber length (L f), the fiber diameter (� f) and the<br />
aspect ratio (L f/� f) are shown. All the fibers are cold<br />
drawn, have a hooked shape, a rounded shaft and a<br />
tensile strength higher than 1100 MPa.<br />
Fibers with an aspect ratio equal to 50 (FF1) were<br />
used with two different volume fractions (V f), equal<br />
to 0.45% (35 kg/m 3 ) and to 0.58% (45 kg/m 3 ). Fibers<br />
with a higher aspect ratio (FF3) were used with a<br />
lower dosage, equal to 25 kg/m 3 (V f � 0.32%) and to<br />
35 kg/m 3 (V f � 0.45%).<br />
Eight beam specimens were made for each type <strong>of</strong><br />
<strong>SFRC</strong>; in addition, 8 beams <strong>of</strong> plain concrete were<br />
used as reference specimens.<br />
The slump(s) <strong>of</strong> the fresh concrete was always<br />
greater than 150 mm.<br />
Specimens were stored in a fog room (R.H. � 95%;<br />
T � 20 � 2°C) until 24 hours before testing.<br />
Table 3 reports the mechanical properties <strong>of</strong> concrete<br />
(average values), as determined after about<br />
60 days <strong>of</strong> curing; in particular, tensile strength (f ct)<br />
from cylinders (� �80 mm, L � 240 mm), compressive<br />
strength from cubes (f c,cube) having 150 mm side<br />
and Young’s modulus (E c) from compression tests on<br />
cylinders (� �80 mm, L � 240 mm), are reported.<br />
1106<br />
Table 3. Mechanical properties <strong>of</strong> concrete (average values).<br />
f c,cube [MPa] f ct [MPa] E c [GPa]<br />
FF1 64.7 64.1 4.11 4.07 38.8 38.1<br />
FF3 63.5 4.04 37,4<br />
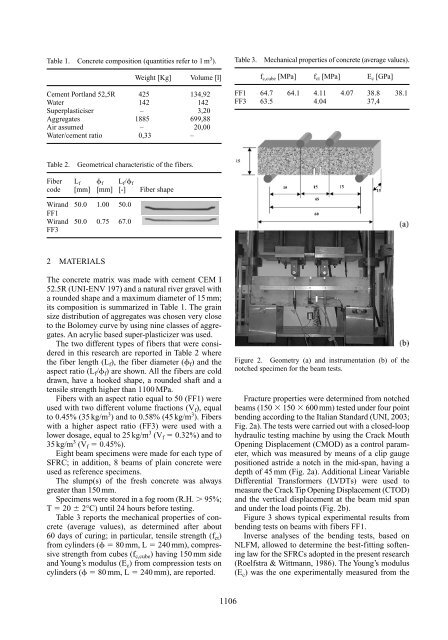
Figure 2. Geometry (a) and instrumentation (b) <strong>of</strong> the<br />
notched specimen for the beam tests.<br />
Fracture properties were determined from notched<br />
beams (150 � 150 � 600 mm) tested under four point<br />
bending according to the Italian Standard (UNI, 2003;<br />
Fig. 2a). The tests were carried out with a closed-loop<br />
hydraulic testing machine by using the Crack Mouth<br />
Opening Displacement (CMOD) as a control parameter,<br />
which was measured by means <strong>of</strong> a clip gauge<br />
positioned astride a notch in the mid-span, having a<br />
depth <strong>of</strong> 45 mm (Fig. 2a). Additional Linear Variable<br />
Differential Transformers (LVDTs) were used to<br />
measure the Crack Tip Opening Displacement (CTOD)<br />
and the vertical displacement at the beam mid span<br />
and under the load points (Fig. 2b).<br />
Figure 3 shows typical experimental results from<br />
bending tests on beams with fibers FF1.<br />
Inverse analyses <strong>of</strong> the bending tests, based on<br />
NLFM, allowed to determine the best-fitting s<strong>of</strong>tening<br />
law for the <strong>SFRC</strong>s adopted in the present research<br />
(Roelfstra & Wittmann, 1986). The Young’s modulus<br />
(E c) was the one experimentally measured from the