- Page 1:
Thomas Kurz, Ulrich Parlitz, and Ud
- Page 4 and 5:
erschienen im Universitätsverlag G
- Page 6 and 7:
Bibliographische Information der De
- Page 8 and 9:
iv Contents Laser speckle metrology
- Page 11 and 12:
Oscillations, Waves and Interaction
- Page 13 and 14:
Applied physics at the “Dritte”
- Page 15 and 16:
Applied physics at the “Dritte”
- Page 17 and 18:
Applied physics at the “Dritte”
- Page 19 and 20:
Applied physics at the “Dritte”
- Page 21 and 22:
Applied physics at the “Dritte”
- Page 23 and 24:
Applied physics at the “Dritte”
- Page 25 and 26:
Applied physics at the “Dritte”
- Page 27 and 28:
Applied physics at the “Dritte”
- Page 29 and 30:
Applied physics at the “Dritte”
- Page 31 and 32:
Applied physics at the “Dritte”
- Page 33 and 34:
Applied physics at the “Dritte”
- Page 35 and 36:
Oscillations, Waves and Interaction
- Page 37 and 38:
noise component [GNE] 5 4 3 2 1 can
- Page 39 and 40:
3.4 Transfer to running speech Spee
- Page 41 and 42:
3.4.2 Analysis of running speech Sp
- Page 43 and 44:
Speech research 33 Area [Pixels] 60
- Page 45 and 46:
Speech research 35 [13] D. Michaeli
- Page 47 and 48:
Oscillations, Waves and Interaction
- Page 49 and 50:
Specific signal types in hearing re
- Page 51 and 52:
Specific signal types in hearing re
- Page 53 and 54:
Specific signal types in hearing re
- Page 55 and 56:
Specific signal types in hearing re
- Page 57 and 58:
Specific signal types in hearing re
- Page 59 and 60:
Specific signal types in hearing re
- Page 61 and 62:
Specific signal types in hearing re
- Page 63 and 64:
Specific signal types in hearing re
- Page 65 and 66:
Specific signal types in hearing re
- Page 67 and 68:
Specific signal types in hearing re
- Page 69 and 70:
Specific signal types in hearing re
- Page 71 and 72:
Specific signal types in hearing re
- Page 73 and 74:
Specific signal types in hearing re
- Page 75 and 76:
Specific signal types in hearing re
- Page 77 and 78:
Specific signal types in hearing re
- Page 79 and 80:
Specific signal types in hearing re
- Page 81:
Specific signal types in hearing re
- Page 84 and 85:
74 D. Ronneberger et al. Mechel fou
- Page 86 and 87:
76 D. Ronneberger et al. (flow velo
- Page 88 and 89:
78 D. Ronneberger et al. |t + acous
- Page 90 and 91:
80 D. Ronneberger et al. Figure 6.
- Page 92 and 93:
82 D. Ronneberger et al. Figure 8.
- Page 94 and 95:
84 D. Ronneberger et al. (flow velo
- Page 96 and 97:
86 D. Ronneberger et al. R / L ⋅
- Page 98 and 99:
88 D. Ronneberger et al. e. g. temp
- Page 100 and 101:
90 D. Ronneberger et al. 3.2 Qualit
- Page 102 and 103:
92 D. Ronneberger et al. As usual t
- Page 104 and 105:
94 D. Ronneberger et al. (wavenumbe
- Page 106 and 107:
96 D. Ronneberger et al. powers of
- Page 108 and 109:
98 D. Ronneberger et al. an increas
- Page 110 and 111:
100 D. Ronneberger et al. The term
- Page 112 and 113:
102 D. Ronneberger et al. Neverthel
- Page 114 and 115:
104 D. Ronneberger et al. [4] J. Br
- Page 116 and 117:
106 D. Ronneberger et al. strömung
- Page 118 and 119:
108 D. Guicking synchronised tuning
- Page 120 and 121:
110 D. Guicking primary noise micro
- Page 122 and 123:
112 D. Guicking primary sensor desi
- Page 124 and 125:
114 D. Guicking by an antiphase sou
- Page 126 and 127:
116 D. Guicking R L C C + + 1 1−C
- Page 128 and 129:
118 D. Guicking More involved than
- Page 130 and 131:
120 D. Guicking In the 1980s, longi
- Page 132 and 133:
122 D. Guicking with electrodynamic
- Page 134 and 135:
124 D. Guicking 3.6 Noise reduction
- Page 136 and 137:
126 D. Guicking the turbulence of a
- Page 138 and 139:
128 D. Guicking References [1] Lord
- Page 140 and 141:
130 D. Guicking [44] Falcke, H.,
- Page 142 and 143:
132 D. Guicking [84] J. Melcher,
- Page 144 and 145:
134 D. Guicking [125] D. Heyland et
- Page 146 and 147:
136 D. Guicking [166] S. Zommer et
- Page 148 and 149:
138 D. Guicking [212] M. L. Post an
- Page 150 and 151:
140 W. Lauterborn et al. liquid κ
- Page 152 and 153:
142 W. Lauterborn et al. Figure 2.
- Page 154 and 155:
144 W. Lauterborn et al. nator, and
- Page 156 and 157:
146 W. Lauterborn et al. by types a
- Page 158 and 159:
148 W. Lauterborn et al. bubble rad
- Page 160 and 161:
150 W. Lauterborn et al. Figure 10.
- Page 162 and 163:
152 W. Lauterborn et al. Figure 13.
- Page 164 and 165:
154 W. Lauterborn et al. P koll [kb
- Page 166 and 167:
156 W. Lauterborn et al. Pulse widt
- Page 168 and 169:
158 W. Lauterborn et al. laser puls
- Page 170 and 171:
160 W. Lauterborn et al. Figure 24.
- Page 172 and 173:
162 W. Lauterborn et al. Figure 26.
- Page 174 and 175:
164 W. Lauterborn et al. Figure 28.
- Page 176 and 177:
166 W. Lauterborn et al. Figure 29.
- Page 178 and 179:
168 W. Lauterborn et al. R [µ m] 1
- Page 180 and 181:
170 W. Lauterborn et al. [17] M. P.
- Page 182 and 183:
172 R. Mettin (a) (b) Figure 1. Bub
- Page 184 and 185:
174 R. Mettin 0 ms 2 mm 1 ms 2 ms 3
- Page 186 and 187:
176 R. Mettin important quantity ch
- Page 188 and 189:
178 R. Mettin 100 kPa 200 kPa | | F
- Page 190 and 191:
180 R. Mettin Figure 7. Trapped sin
- Page 192 and 193:
182 R. Mettin concentration of spec
- Page 194 and 195:
184 R. Mettin which is called the p
- Page 196 and 197:
186 R. Mettin R 02 [µm] R 02 [µm]
- Page 198 and 199:
188 R. Mettin constant to M a = 2π
- Page 200 and 201:
190 R. Mettin (a) p a [Pa] 140 120
- Page 202 and 203:
192 R. Mettin z [mm] 5 4 3 2 1 0 -1
- Page 204 and 205:
194 R. Mettin Figure 17. Left: Expe
- Page 206 and 207:
196 R. Mettin - a hot microlaborato
- Page 208 and 209:
198 R. Mettin [52] R. Mettin, C.-D.
- Page 210 and 211:
200 W. Eisenmenger and U. Kaatze Th
- Page 212 and 213:
202 W. Eisenmenger and U. Kaatze Fi
- Page 214 and 215:
204 W. Eisenmenger and U. Kaatze Fi
- Page 216 and 217:
206 W. Eisenmenger and U. Kaatze Fi
- Page 218 and 219:
208 W. Eisenmenger and U. Kaatze Fi
- Page 220 and 221:
210 W. Eisenmenger and U. Kaatze Fi
- Page 222 and 223:
212 W. Eisenmenger and U. Kaatze Fi
- Page 224 and 225:
214 W. Eisenmenger and U. Kaatze 6
- Page 226 and 227:
216 W. Eisenmenger and U. Kaatze Pr
- Page 228 and 229:
218 A. Vogel, I. Apitz, V. Venugopa
- Page 230 and 231:
220 A. Vogel, I. Apitz, V. Venugopa
- Page 232 and 233:
222 A. Vogel, I. Apitz, V. Venugopa
- Page 234 and 235:
224 A. Vogel, I. Apitz, V. Venugopa
- Page 236 and 237:
226 A. Vogel, I. Apitz, V. Venugopa
- Page 238 and 239:
228 A. Vogel, I. Apitz, V. Venugopa
- Page 240 and 241:
230 A. Vogel, I. Apitz, V. Venugopa
- Page 242 and 243:
232 A. Vogel, I. Apitz, V. Venugopa
- Page 244 and 245:
234 A. Vogel, I. Apitz, V. Venugopa
- Page 246 and 247:
236 A. Vogel, I. Apitz, V. Venugopa
- Page 248 and 249:
238 A. Vogel, I. Apitz, V. Venugopa
- Page 250 and 251:
240 A. Vogel, I. Apitz, V. Venugopa
- Page 252 and 253:
242 A. Vogel, I. Apitz, V. Venugopa
- Page 254 and 255:
244 A. Vogel, I. Apitz, V. Venugopa
- Page 256 and 257:
246 A. Vogel, I. Apitz, V. Venugopa
- Page 258 and 259:
248 A. Vogel, I. Apitz, V. Venugopa
- Page 260 and 261:
250 A. Vogel, I. Apitz, V. Venugopa
- Page 262 and 263:
252 A. Vogel, I. Apitz, V. Venugopa
- Page 264 and 265:
254 A. Vogel, I. Apitz, V. Venugopa
- Page 266 and 267:
256 A. Vogel, I. Apitz, V. Venugopa
- Page 268 and 269:
258 A. Vogel, I. Apitz, V. Venugopa
- Page 270 and 271:
260 K. D. Hinsch Generally, any of
- Page 272 and 273:
262 K. D. Hinsch Figure 1. Monitori
- Page 274 and 275:
264 K. D. Hinsch Figure 3. ESPI stu
- Page 276 and 277:
266 K. D. Hinsch Figure 4. Deterior
- Page 278 and 279:
268 K. D. Hinsch Often, in-plane mo
- Page 280 and 281:
270 K. D. Hinsch Figure 7. Optical
- Page 282 and 283:
272 K. D. Hinsch Figure 9. Humidity
- Page 284 and 285:
274 K. D. Hinsch locations that tak
- Page 286 and 287:
276 K. D. Hinsch Figure 13. Map of
- Page 288 and 289:
278 K. D. Hinsch References [1] D.
- Page 290 and 291:
280 Schreiber not moving along with
- Page 292 and 293:
282 Schreiber These properties made
- Page 294 and 295:
284 Schreiber Figure 3. The G ring
- Page 296 and 297:
286 Schreiber Rotation Rate [rad/s]
- Page 298 and 299:
288 Schreiber and it is currently b
- Page 300 and 301:
290 Schreiber n1 D A B n Figure 8.
- Page 302 and 303:
292 Schreiber Beamwalk [µm] 80.0 7
- Page 304 and 305:
294 Schreiber ∆ Perimeter [*10e12
- Page 306 and 307:
296 Schreiber and the last term acc
- Page 308 and 309:
298 Schreiber Δf [µHz] 100 50 0 -
- Page 310 and 311:
300 Schreiber formation of a new wo
- Page 312 and 313:
302 Schreiber PSD [*10 16 (rad/s) 2
- Page 314 and 315:
304 Schreiber 7.2 The ring laser co
- Page 316 and 317:
306 Schreiber Demodulator Signal [V
- Page 318 and 319:
308 Schreiber Est. Phase Vel. (m/s)
- Page 320 and 321:
310 Schreiber [18] V. Frede and V.
- Page 322 and 323:
312 Martin Dressel tice is reduced
- Page 324 and 325:
314 Martin Dressel Metallic whisker
- Page 326 and 327:
316 Martin Dressel (a) (b) (c) CH 3
- Page 328 and 329:
318 Martin Dressel 3.1 Charge densi
- Page 330 and 331:
320 Martin Dressel Absorptivity σ
- Page 332 and 333:
322 Martin Dressel brought a confir
- Page 334 and 335:
324 Martin Dressel a charge disprop
- Page 336 and 337:
326 Martin Dressel Conductivity 70
- Page 338 and 339:
328 Martin Dressel Reflectivity Con
- Page 340 and 341:
330 Martin Dressel References [1] M
- Page 342 and 343:
332 Martin Dressel and L. Montgomer
- Page 344 and 345:
334 R. Pottel, J. Haller and U. Kaa
- Page 346 and 347:
336 R. Pottel, J. Haller and U. Kaa
- Page 348 and 349:
338 R. Pottel, J. Haller and U. Kaa
- Page 350 and 351:
340 R. Pottel, J. Haller and U. Kaa
- Page 352 and 353:
342 R. Pottel, J. Haller and U. Kaa
- Page 354 and 355:
344 R. Pottel, J. Haller and U. Kaa
- Page 356 and 357:
346 R. Pottel, J. Haller and U. Kaa
- Page 358 and 359:
348 R. Pottel, J. Haller and U. Kaa
- Page 360 and 361:
350 R. Pottel, J. Haller and U. Kaa
- Page 362 and 363:
352 R. Pottel, J. Haller and U. Kaa
- Page 364 and 365:
354 R. Pottel, J. Haller and U. Kaa
- Page 366 and 367:
356 R. Pottel, J. Haller and U. Kaa
- Page 368 and 369:
358 R. Pottel, J. Haller and U. Kaa
- Page 370 and 371:
360 R. Pottel, J. Haller and U. Kaa
- Page 372 and 373:
362 R. Pottel, J. Haller and U. Kaa
- Page 374 and 375:
364 R. Pottel, J. Haller and U. Kaa
- Page 376 and 377:
366 R. Pottel, J. Haller and U. Kaa
- Page 378 and 379:
368 U. Kaatze and R. Behrends with
- Page 380 and 381:
370 U. Kaatze and R. Behrends Figur
- Page 382 and 383:
372 U. Kaatze and R. Behrends Figur
- Page 384 and 385: 374 U. Kaatze and R. Behrends Figur
- Page 386 and 387: 376 U. Kaatze and R. Behrends Figur
- Page 388 and 389: 378 U. Kaatze and R. Behrends Figur
- Page 390 and 391: 380 U. Kaatze and R. Behrends Figur
- Page 392 and 393: 382 U. Kaatze and R. Behrends Figur
- Page 394 and 395: 384 U. Kaatze and R. Behrends Figur
- Page 396 and 397: 386 U. Kaatze and R. Behrends of th
- Page 398 and 399: 388 U. Kaatze and R. Behrends Figur
- Page 400 and 401: 390 U. Kaatze and R. Behrends Figur
- Page 402 and 403: 392 U. Kaatze and R. Behrends Figur
- Page 404 and 405: 394 U. Kaatze and R. Behrends Figur
- Page 406 and 407: 396 U. Kaatze and R. Behrends Figur
- Page 408 and 409: 398 U. Kaatze and R. Behrends [6] M
- Page 410 and 411: 400 U. Kaatze and R. Behrends [49]
- Page 412 and 413: 402 U. Kaatze and R. Behrends (2002
- Page 414 and 415: 404 U. Kaatze and R. Behrends Copyr
- Page 416 and 417: 406 U. Parlitz here chaos control m
- Page 418 and 419: 408 U. Parlitz Figure 2. Amplitude
- Page 420 and 421: 410 U. Parlitz 4 10 5 5 (a) (b) (c)
- Page 422 and 423: 412 U. Parlitz two-parameter studie
- Page 424 and 425: 414 U. Parlitz GN differential opti
- Page 426 and 427: 416 U. Parlitz P 1 P 2 P 3 S P 1 P
- Page 428 and 429: 418 U. Parlitz Figure 9. Correlatio
- Page 430 and 431: 420 U. Parlitz series” where for
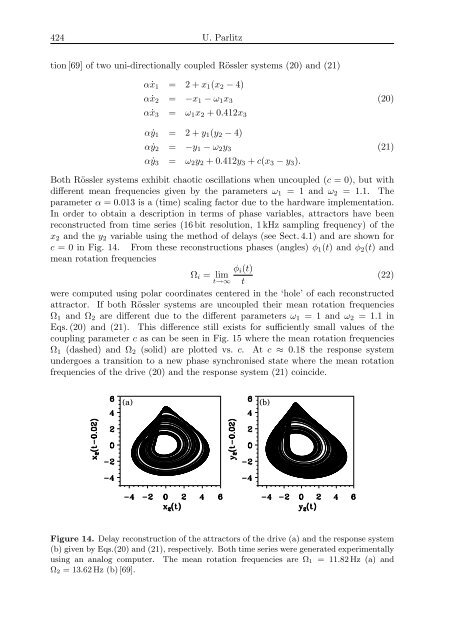
- Page 432 and 433: 422 U. Parlitz current state future
- Page 436 and 437: 426 U. Parlitz LD1 LD2 M BS1 BS2 OD
- Page 438 and 439: 428 U. Parlitz with a clear tendenc
- Page 440 and 441: 430 U. Parlitz (a) y (c) y 40 20 È
- Page 442 and 443: 432 U. Parlitz [29] P. Grassberger,
- Page 444 and 445: 434 U. Parlitz [76] H. D. I. Abarba
- Page 446 and 447: 436 S. Lakämper and C. F. Schmidt
- Page 448 and 449: 438 S. Lakämper and C. F. Schmidt
- Page 450 and 451: 440 S. Lakämper and C. F. Schmidt
- Page 452 and 453: 442 S. Lakämper and C. F. Schmidt
- Page 454 and 455: 444 S. Lakämper and C. F. Schmidt
- Page 456 and 457: 446 S. Lakämper and C. F. Schmidt
- Page 458 and 459: 448 S. Lakämper and C. F. Schmidt
- Page 460 and 461: 450 S. Lakämper and C. F. Schmidt
- Page 462 and 463: 452 S. Lakämper and C. F. Schmidt
- Page 464 and 465: 454 S. Lakämper and C. F. Schmidt
- Page 466 and 467: 456 S. Lakämper and C. F. Schmidt
- Page 468 and 469: 458 S. Lakämper and C. F. Schmidt
- Page 470 and 471: 460 S. Lakämper and C. F. Schmidt
- Page 472 and 473: 462 Index basin of attraction, 144
- Page 474 and 475: 464 Index cone bubble structure, 19
- Page 476 and 477: 466 Index turbulent, 111, 126 fluct
- Page 478 and 479: 468 Index LPC, 29 luminescence of b
- Page 480 and 481: 470 Index peak factor, 38, 43 Peier
- Page 482 and 483: 472 Index laser-induced bubble, 152
- Page 484 and 485:
474 Index ultraharmonic resonance,