Optical Absorption Spectra of Nanocrystal Gold Molecules
Optical Absorption Spectra of Nanocrystal Gold Molecules
Optical Absorption Spectra of Nanocrystal Gold Molecules

Create successful ePaper yourself
Turn your PDF publications into a flip-book with our unique Google optimized e-Paper software.
3706 J. Phys. Chem. B 1997, 101, 3706-3712<br />
<strong>Optical</strong> <strong>Absorption</strong> <strong>Spectra</strong> <strong>of</strong> <strong>Nanocrystal</strong> <strong>Gold</strong> <strong>Molecules</strong><br />
I. Introduction<br />
Marcos M. Alvarez, Joseph T. Khoury, T. Gregory Schaaff, Marat N. Shafigullin,<br />
Igor Vezmar, and Robert L. Whetten*<br />
Schools <strong>of</strong> Physics and Chemistry and Microelectronics Research Center, Georgia Institute <strong>of</strong> Technology,<br />
Atlanta, Georgia 30332-0430<br />
ReceiVed: September 23, 1996; In Final Form: March 4, 1997X The optical absorption spectra <strong>of</strong> a series <strong>of</strong> nanocrystal gold moleculesslarger, crystalline Au clusters that<br />
are passivated by a compact monolayer <strong>of</strong> n-alkylthiol(ate)sshave been measured across the electronic range<br />
(1.1-4.0 eV) in dilute solution at ordinary temperature. Each <strong>of</strong> the ∼20 samples, ranging in effective core<br />
diameter from 1.4 to 3.2 nm (∼70 to ∼800 Au atoms), has been purified by fractional crystallization and has<br />
undergone a separate compositional and structural characterization by mass spectrometry and X-ray diffraction.<br />
With decreasing core mass (crystallite size) the spectra uniformly show a systematic evolution, specifically<br />
(i) a broadening <strong>of</strong> the so-called surface-plasmon band until it is essentially unidentifiable for crystallites <strong>of</strong><br />
less than 2.0 nm effective diameter, (ii) the emergence <strong>of</strong> a distinct onset for strong absorption near the<br />
energy (∼1.7 eV) <strong>of</strong> the interbandgap (5d f 6sp), and (iii) the appearance in the smallest crystallites <strong>of</strong> a<br />
weak steplike structure above this onset, which is interpreted as arising from a series <strong>of</strong> transitions from the<br />
continuum d-band to the discrete level structure <strong>of</strong> the conduction band just above the Fermi level. The<br />
classical electrodynamic (Mie) theory, based on bulk optical properties, can reproduce this spectral<br />
evolutionsand thereby yield a consistent core-sizingsonly by making a strong assumption about the surface<br />
chemical interaction. Quantitative agreement with the spectral line shape requires a size-dependent <strong>of</strong>fset <strong>of</strong><br />
the frequency-dependent dielectric function, which may be explained by a transition in electronic structure<br />
just below 2.0 nm (∼200 atoms), as proposed earlier.<br />
Nanometer-scale metal particles exhibit optical properties <strong>of</strong><br />
great aesthetic, technological, and intellectual value. These<br />
properties are conveniently elucidated through conventional<br />
optical spectroscopic methods. 1 At a fundamental level, optical<br />
absorption spectra provide information on the electronic structure<br />
<strong>of</strong> small metallic particles. To understand how these and<br />
other properties evolve from an atomic to a macroscopic state<br />
continues to be the most emotive cry in research on metal<br />
clusters and small particles. 2 On a more practical level, the<br />
unique optical properties <strong>of</strong> small metallic particles are exploited<br />
in the manufacturing <strong>of</strong> optical filters as labels for biomacromolecules,<br />
in reversible photosensitive monochromatic glasses, 3<br />
for intensity enhancement in Raman spectroscopy (SER effect), 4<br />
for optical switching based on their large, ultrafast nonlinear<br />
optical response, 5 and for optical trapping (or “tweezers”), based<br />
on their high polarizability. 6 For their beauty and resilience,<br />
colloidal gold suspensions have found numerous decorative<br />
applications, such as in purple <strong>of</strong> Cassius and in the ruby glasses<br />
dating to the Middle Ages. 7 In fact, it was the color variation<br />
<strong>of</strong> colloidal gold with size that motivated Mie to apply the<br />
general theory <strong>of</strong> light extinction to small particles. 8<br />
The absorption spectra <strong>of</strong> many metallic nanoparticles are<br />
characterized by a strong broad absorption band that is absent<br />
in the bulk spectra. Classically, this giant dipole (or surfaceplasmon)<br />
band is ascribed to a collective oscillation <strong>of</strong> the<br />
conduction electrons in response to optical excitation. 9 The<br />
presence <strong>of</strong> this band in the visible region <strong>of</strong> the spectrum is<br />
responsible for the striking colors <strong>of</strong> dilute colloidal solutions<br />
<strong>of</strong> noble, alkali, alkaline earth (Ca, Sr, Ba) and rare-earth (Eu,<br />
Yb) nanoparticles. 10 Mie’s theory predicts that below a certain<br />
size, less than one-tenth <strong>of</strong> the optical wavelength, the position<br />
and width <strong>of</strong> this band should remain constant, independent <strong>of</strong><br />
X Abstract published in AdVance ACS Abstracts, April 15, 1997.<br />
size. 7 Experimental evidence, however, indicates a slight but<br />
significant shift to lower energy accompanied by a dramatic<br />
increase in width with decreasing size. 11 For free-electron<br />
metals, Fragstein and Kreibig and others 12-14 advanced the<br />
theory that when the particle diameter becomes smaller than<br />
the electronic mean-free path in the bulk metal (ca. 20 nm for<br />
gold), the scattering <strong>of</strong> free electrons with the particle surface<br />
begins to affect their response to optical excitation. Such a<br />
simple and practical theory succeeds in explaining spectra <strong>of</strong><br />
relatively large particles (>3 nm for gold) but stands on loose<br />
ground when applied to the smaller sizes. It is anticipated that<br />
at one point the phenomenological description <strong>of</strong> free electrons,<br />
as well as inherent fundamental assumptions <strong>of</strong> infinite lattice<br />
periodicity and a continuous energy-level spectrum, must fail.<br />
Thus far, however, it has not been possible to unequivocally<br />
identify quantum size effects in the optical spectra <strong>of</strong> metal<br />
nanoparticles prepared in macroscopic quantities, although such<br />
effects are well-known from experiments on metal-cluster<br />
beams 2 and from conductance measurements on single-metal<br />
nanostructures. 15 One problem has been that experimental<br />
measurements for the small nanoparticles are <strong>of</strong>ten degraded<br />
by a lack <strong>of</strong> size and shape uniformity that renders comparison<br />
with theory questionable. 16<br />
This obstacle has been largely overcome by the discovery <strong>of</strong><br />
methods for preparing gold:alkylthiolate assemblies that are the<br />
nanometer-scale analogue to the well-studied surface system.<br />
Specifically, on extended Au surfaces, one finds an extraordinary<br />
example 17 <strong>of</strong> the uniform protection <strong>of</strong> a surface without<br />
modification <strong>of</strong> its essential structural and electronic properties.<br />
n-Alkylthiolates and their derivatives form compact, ordered<br />
monolayers in which thiolates (RS-) or dialkyl disulfides<br />
(RSSR) reversibly attach to various Au surfaces. Their<br />
spontaneous assembly is driven by favorable (van der Waals)<br />
interactions among the long, ordered alkane chains in concert<br />
with a weak chemisorption <strong>of</strong> the sulfur head group to the metal<br />
S1089-5647(96)02922-7 CCC: $14.00 © 1997 American Chemical Society
<strong>Nanocrystal</strong> <strong>Gold</strong> <strong>Molecules</strong> J. Phys. Chem. B, Vol. 101, No. 19, 1997 3707<br />
surface (∼1.2 eV per RSSR unit desorbed versus ∼10 eV<br />
surface energy per six Au atoms covered by this unit). These<br />
extensively studied systems have recently begun to be well<br />
understood. For example, a surface structure implicating<br />
interactions between Au surface atoms and the nonbonding S<br />
orbitals <strong>of</strong> an intact RSSR molecule has been identified. 18<br />
The subsequent discovery and increasingly wide exploration<br />
<strong>of</strong> the highly stable Au:SR nanocrystal systems over the past<br />
three years has established the stable existence and many<br />
properties <strong>of</strong> these systems; namely, they are charge-neutral<br />
entities comprised <strong>of</strong> a compact crystalline core <strong>of</strong> close-packed<br />
metal atoms and a dense mantle <strong>of</strong> straight-chain groups, which<br />
can be prepared quantitatively by at least two distinct methods<br />
19,20 effective across the ∼1.4-3.5 nm core diameter range<br />
(∼70-1000 atoms). Their surface properties are dictated by<br />
the surfactant tail-group (usually methyl, -CH3), resulting in<br />
weak interactions with external agents (e.g., solvents, strong<br />
acids, or bases) and with each other; the surfactant groups (RS)<br />
initially adsorbed can later be exchanged with excess thiol<br />
(R′SH) in solution. 21-23 Their electronic properties are those<br />
characteristic <strong>of</strong> a small metal particle surrounded by a<br />
condensed dielectric medium. 24 Most remarkably, the raw<br />
samples as prepared have been shown by mass spectrometry to<br />
contain enhanced abundances at certain sizes, presumably<br />
resulting from filled structural shells <strong>of</strong> Au atoms. The<br />
components <strong>of</strong> these mixtures can be fractionated from one<br />
another according to size and then handled as purified molecular<br />
substances in various ordered (thin films, molecular crystals)<br />
and dispersed phases. 22,25 Considerable insight into the structure<br />
<strong>of</strong> these assemblies and their interactions has recently been<br />
provided by realistic simulations 26 and by X-ray diffraction<br />
patterns obtained on selected samples that are matched to<br />
patterns calculated from theoretically generated structures. 27 We<br />
have recently 28 found methods to produce and isolate smaller<br />
nanocrystals (1.4-1.7 nm) in large quantities, enabling one to<br />
obtain a rather complete picture <strong>of</strong> the evolution <strong>of</strong> the optical<br />
properties <strong>of</strong> gold.<br />
II. Experimental Methods and Results<br />
Examples <strong>of</strong> optical spectra obtained on samples <strong>of</strong> nanocrystal<br />
gold molecules are shown in Figures 1 and 2. These<br />
are purified fractions <strong>of</strong> materials prepared using hexyl- (denoted<br />
by SC6), dodecyl- (SC12), and octadecyl- (SC18) thiol(ate)<br />
surfactants and separated by methods described in refs 25 and<br />
29, and each has undergone a separate characterization involving<br />
mass spectrometry, large-angle X-ray diffraction (core structure),<br />
and small-angle X-ray diffraction on crystalline films or<br />
powders. Relevant mass-spectra are shown in Figure 3, and<br />
information extracted from XRD is shown in Figure 4. To<br />
obtain the optical spectra shown, toluene solutions <strong>of</strong> each<br />
fraction were prepared at dilutions such that the optical<br />
absorbance near 4 eV was approximately unity. In practice,<br />
this involved a greater than 1000-fold dilution from the<br />
saturation limit. The absorption spectrum <strong>of</strong> each fraction was<br />
recorded from 1100 to 290 nm at normal temperatures using a<br />
Beckman DU 650 single-beam spectrometer (A290 ≈ 1 through<br />
a 1 cm quartz cell), and the solvent background is subtracted.<br />
The spectra shown in Figure 1 are arbitrarily normalized at<br />
the high-energy end and are presented superimposed, without<br />
risk <strong>of</strong> confusion, because the relative spectral intensity at 2.5<br />
eV decreases monotonically with mass (core size) for each series<br />
shown. Furthermore, Figure 2 illustrates that the spectra are<br />
largely independent <strong>of</strong> chain length for a given core mass,<br />
although at smaller sizes (∼1.7 nm) they can be quite sensitive<br />
to sample purity (Figure 2b).<br />
The optical spectra are correlated with other characterization<br />
as follows. The mass spectral characterization shown in Figure<br />
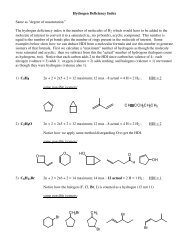
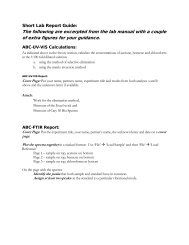
Figure 1. <strong>Optical</strong> absorption spectra (absorbance vs photon energy)<br />
for dilute solutions <strong>of</strong> several purified fractions <strong>of</strong> nanocrystal gold<br />
molecules passivated by (a) hexyl-, (b) dodecyl-, and (c) octadecylthiol-<br />
(ates). The spectra are scaled to unity at 4 eV and are compared to an<br />
aqueous solution <strong>of</strong> commercial colloidal Au particles (dotted lines)<br />
<strong>of</strong> 9 nm mean size. The peak amplitude (near 2.5 eV) descends with<br />
the metallic core diameters: (a) 3.2, 2.5, 2.4, 2.2, 2.0, and 1.7 nm (SC6<br />
passivant); (b) 2.5, 2.4, 2.2, 2.1, 2.0, and 1.7 nm (SC12 passivant); (c)<br />
1.7 and 1.4 nm (SC18 passivant).<br />
Figure 2. <strong>Optical</strong> spectra, as in Figure 1, comparing nanocrystals <strong>of</strong><br />
like metallic cores. The upper frame contains spectra (normalized at 4<br />
eV) from 2.5 nm diameter clusters passivated with hexyl (solid line)<br />
and dodecyl (dashed). In the lower frame, several spectra <strong>of</strong> differently<br />
obtained 1.7 nm clusters are <strong>of</strong>fset from each other: (top to bottom)<br />
passivated by SC6, SC12, and SC18.<br />
3 has been used to extract a single quantity, the core mass, or<br />
approximate number <strong>of</strong> Au atoms, NAu, that can be converted<br />
into an effective core diameter DMS using the density (59 atoms/<br />
nm 3 ) <strong>of</strong> bulk fcc-Au: NAu ) (59 nm -3 )(π/6)(DMS) 3 . For<br />
convenience, this conversion is presented in graphical form in<br />
Figure 4a. Figure 4b demonstrates the correlation between the<br />
effective core diameter and the nearest-neighbor distance in the<br />
solid state, which is the most direct measure <strong>of</strong> the size <strong>of</strong> the<br />
overall assembly. The essence <strong>of</strong> the size-specific results shown<br />
in Figures 1-4, along with structural trends revealed by LA-
3708 J. Phys. Chem. B, Vol. 101, No. 19, 1997 Alvarez et al.<br />
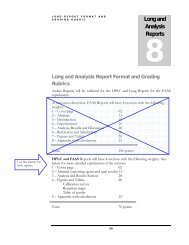
Figure 3. Sizing <strong>of</strong> the nanocrystal gold molecule fractions by mass<br />
spectrometry where the principal peaks from the mass spectra (compare<br />
to Figure 1) are displayed versus mass (in k ) 1000 amu units, lower<br />
axis, cube-root scale) and versus equivalent diameter (DMS, upper axis,<br />
linear scale): (a) 3.2, 2.7, 2.5, 2.4, 2.2, 2.1, 2.0, and 1.7 nm (SC6<br />
passivant); (b) 2.5, 2.4, 2.2, 2.1, 2.0, and 1.7 nm (SC12 passivant); (c)<br />
1.7 and 1.4 nm (SC18 passivant).<br />
XRD, 27 and the high crystallinity <strong>of</strong> condensed arrays formed<br />
from these samples 31 are consistent with a uniformity <strong>of</strong><br />
nanocrystallite structure that is seldom, if ever, attained in a<br />
series <strong>of</strong> macroscopically prepared materials.<br />
Figures 5 and 6 present a diverse selection <strong>of</strong> the optical<br />
spectra replotted on a semilogarithmic scale (Figure 5) and in<br />
differential form (Figure 6). These bring out certain features<br />
to be discussed in the next section.<br />
III. Analysis and Discussion<br />
A. Qualitative Interpretation. In this section, we give a<br />
qualitative analysis and interpretation <strong>of</strong> the observed spectra,<br />
employing established facts concerning bulk fcc-Au, surfaces,<br />
and clusters. In the next section, the Mie theory and variants<br />
are applied in an attempt to gain a quantitative understanding<br />
<strong>of</strong> the spectra.<br />
Superficially, the evolution <strong>of</strong> the optical spectrum <strong>of</strong> Au<br />
particles in the 1.4-3.2 nm size range (∼70-800 atoms) is a<br />
very simple one and could even be described as consistent with<br />
what is already known about Au from spectroscopic investigations<br />
<strong>of</strong> unfractionated samples <strong>of</strong> nanometer-scale particles in<br />
glasses, in solution, and from the smaller cluster compounds. 32,33<br />
Generally, these trends include the diminution, with decreasing<br />
cluster size, <strong>of</strong> the broad absorption band centered at 2.4 eV<br />
until the spectrum is a nearly featureless straight line stretching<br />
from the near-infrared through the near-ultraviolet. However,<br />
the use <strong>of</strong> well-fractionated samples <strong>of</strong> gold nanocrystals, grown<br />
in a strongly etching environment, 25 allows one to distinguish<br />
certain features that had not been noticed previously. These<br />
are the following.<br />
(i) There is an onset to strong absorption located near 1.7<br />
eV that becomes increasingly distinct at smaller nanocrystal<br />
sizes. (The same value can also be obtained, using the spectra<br />
Figure 4. (a) Conversion <strong>of</strong> the approximate number <strong>of</strong> Au atoms,<br />
NAu, into an effective core diameter DMS using the density (59 atoms/<br />
nm 3 ) <strong>of</strong> bulk fcc-Au: NAu ) (59 nm -3 )(π/6)(DMS) 3 presented in<br />
graphical form. (b) Correlation between the structural parameters,<br />
effective core diameter (DMS) and nearest-neighbor center-to-center<br />
distance (DXRD) for (2)SC12,([)SC6, and (b)SC4passivated samples<br />
<strong>of</strong> gold nanocrystals.<br />
Figure 5. <strong>Optical</strong> spectra <strong>of</strong> diverse selected fractions replotted on a<br />
semilograthmic scale (<strong>of</strong>fset for viewing): (from top to bottom) 9 nm<br />
colloidal gold and 3.2, 2.5, 1.7, and 1.4 nm nanocrystal gold molecules.<br />
The vertical dashed line marks the onset <strong>of</strong> the interband absorption<br />
just above 1.6 eV.<br />
<strong>of</strong> larger-sized clusters, by extrapolating the linear region down<br />
to zero absorbance.) This can be seen even in the composite<br />
diagrams <strong>of</strong> Figures 1c and 2b but is brought out particularly<br />
clearly by the spectra plotted semilogarithmically in Figure 5.<br />
These show a clean break from the preonset behavior (dotted<br />
tangent lines) occurring at the energy (∼1.6 eV, as marked by
<strong>Nanocrystal</strong> <strong>Gold</strong> <strong>Molecules</strong> J. Phys. Chem. B, Vol. 101, No. 19, 1997 3709<br />
Figure 6. Derivative (with respect to wavelength λ, dA/dλ) <strong>of</strong>the<br />
optical absorption <strong>of</strong> diverse selected fractions: (from top to bottom)<br />
2.6, 2.4, 2.2, 2.0, 1.7, and 1.4 nm diameter nanocrystal gold molecules.<br />
The inset shows the logarithmic derivative (A -1 dA/dλ) for the smallest<br />
<strong>of</strong> these. See text for discussion <strong>of</strong> the fine-structure appearing at smaller<br />
sizes.<br />
the vertical dashed line) <strong>of</strong> the interband (d f sp) absorption<br />
edge (see below).<br />
(ii) A weak, steplike structure appears, starting from the onset<br />
just described, in the spectra <strong>of</strong> all the smallest clusters studied<br />
(
3710 J. Phys. Chem. B, Vol. 101, No. 19, 1997 Alvarez et al.<br />
Figure 7. Decomposition <strong>of</strong> the experimental dielectric functions (solid<br />
lines) <strong>of</strong> bulk fcc-Au into free-electron (Drude) and interband (5d f<br />
6sp) contributions: (a) real part; (b) imaginary part. The onset <strong>of</strong><br />
significant interband absorption (dotted curve in lower frame) can be<br />
seen near 1.8 eV.<br />
dielectric constant <strong>of</strong> the absorbing solid. [For a sample <strong>of</strong> dilute<br />
(noninteracting) absorbers <strong>of</strong> number density n and path length<br />
l0, σ(ω) is related to the conventional absorbance through the<br />
proportionality A(ω) ) nσ(ω)l0/ln(10).] The solid lines in<br />
Figures 7 and 8 give, respectively, the bulk dielectric function<br />
for Au and the corresponding absorption spectrum, calculated<br />
from eq 1, based on the bulk optical constants 39 extracted by a<br />
cubic spline fit. The spectrum (Figure 8), calculated assuming<br />
ɛm ) 1, shows a giant dipole resonance peaking near 2.3 eV,<br />
coinciding with the vanishing <strong>of</strong> ɛ1(ω) + 2ɛm.<br />
The spectral features predicted by eq 1 are size-independent,<br />
the particle dimension appearing only as a volumetric scaling<br />
factor. The first step in obtaining a size dependence for metal<br />
particles is the decomposition <strong>of</strong> the dielectric function into two<br />
terms: an interband contribution (IB), accounting for the<br />
response <strong>of</strong> 5d-electrons, and a free-electron contribution<br />
(Drude, D) 38 from the electrodynamics <strong>of</strong> the nearly free<br />
conduction electrons: 12<br />
ɛ 1 (ω) ) ɛ 1IB (ω) + ɛ 1D (ω), ɛ 2 (ω) ) ɛ 2IB (ω) + ɛ 2D (ω) (2)<br />
where<br />
ɛ1D (ω) ) 1 - ω 2<br />
p<br />
ω 2 2<br />
+ ω0 , ɛ2D (ω) )<br />
2<br />
ωp ω0<br />
ω(ω 2 2<br />
+ ω0 )<br />
Here, ωp is the frequency <strong>of</strong> the plasma oscillation <strong>of</strong> free<br />
electrons expressed in terms <strong>of</strong> the free electron density N, the<br />
electron charge e, and effective mass m:<br />
which corresponds energetically to 8.89 eV for gold and 9.08<br />
eV for silver. 39 The term ω0, usually on the order <strong>of</strong> hundredths<br />
<strong>of</strong> an electronvolt, stands for the frequency <strong>of</strong> inelastic collisions<br />
(3)<br />
2 2<br />
ωp ) πNe /m (4)<br />
Figure 8. <strong>Absorption</strong> spectra predicted by Mie theory for particles <strong>of</strong><br />
decreasing diameter: (from top to bottom) 40 (bulk), 3, 2, 1 nm. All<br />
curves were normalized to unity at 4.1 eV. The size dependence results<br />
entirely from mean-free path corrections to both real and imaginary<br />
dielectric functions.<br />
(electron-phonon coupling, defects, impurities) <strong>of</strong> free electrons<br />
within the metal. The separation <strong>of</strong> susceptibilities <strong>of</strong> bulk fcc-<br />
Au is shown in Figure 7. The variation in the ɛ1(ω) is free<br />
electron in nature below 2.4 eV, although <strong>of</strong>fset by the large,<br />
positive, and near-constant interband contribution. A significant<br />
inflection appears near 2.4 eV. The ɛ2(ω) function is dominated<br />
by the free electron term below 1.7 eV and by the interband<br />
contribution above 2.4 eV.<br />
To introduce size effects, one assumes that as the size <strong>of</strong> the<br />
particle diminishes, the rate <strong>of</strong> scattering from the particle<br />
surface (ωs) begins to greatly exceed the bulk scattering rate<br />
ω0. 12 The surface scattering rate is expressed in terms <strong>of</strong> the<br />
Fermi velocity (VF ) 1.4 × 10 8 cm/s for gold and silver) and<br />
particle radius: 12<br />
ω s ) AV F /R (5)<br />
This expression can be interpreted as a limitation on the meanfree<br />
path <strong>of</strong> the free electrons by the particle dimensions. The<br />
proportionality factor, A, is <strong>of</strong> the order <strong>of</strong> unity and its meaning<br />
is not free <strong>of</strong> controversy. 40 It takes the value unity if the<br />
scattering is assumed isotropic, 3/4 if diffusive, zero if elastic.<br />
Values from 0.1 to above 2 have been deduced and theoretically<br />
justified 11 as other factors are incorporated into the theory<br />
(electron density at the surface, effect <strong>of</strong> the interface, anisotropy<br />
<strong>of</strong> particle, quantum mechanical computations). To obtain<br />
dielectric functions <strong>of</strong> the particles, it is assumed that the<br />
interband contribution (Figure 7) is unchanged from the bulk<br />
but that free-electron contributions for small particles use ωs in<br />
place <strong>of</strong> ω0 in eq 3.<br />
The predicted size-evolution <strong>of</strong> the optical absorption spectrum<br />
obtained using this mean-free path correction (A ) 1) is<br />
shown in Figure 8 for Au spheres in the size range 1-3 nm<br />
and is compared with the spectrum calculated assuming only<br />
the bulk scattering rate. The damping and red-shift <strong>of</strong> the giant<br />
dipole band are clearly evident. The red-shift in the position<br />
<strong>of</strong> the plasmon band arises from the correction to ɛ1, which is<br />
not negligible at smallest sizes. 12 The rising slope <strong>of</strong> the
<strong>Nanocrystal</strong> <strong>Gold</strong> <strong>Molecules</strong> J. Phys. Chem. B, Vol. 101, No. 19, 1997 3711<br />
Figure 9. Comparison <strong>of</strong> experimental absorption spectra (solid lines)<br />
<strong>of</strong> seven SC12 gold fractions in hexane with predictions <strong>of</strong> the Mie<br />
theory (dotted lines). (a) The optical constants are modified by the meanfree<br />
path correction. Mass-derived diameters in nanometers are 1.7,<br />
1.9, 2.0, 2.1, 2.3, and 2.5. All spectra are normalized to unity at 4.1<br />
eV and displaced vertically. Optimal fits give extracted diameters, in<br />
nanometers, <strong>of</strong> 1.94, 2.2, 2.4, 2.58, 2.82, 3.02 for fractions A-F<br />
respectively. (b) Optimal fits are shown incorporating the effect <strong>of</strong><br />
electron donation from surfactant groups (dotted lines), as in (a). <strong>Optical</strong><br />
constants were corrected with the mean-free path approximation.<br />
Extracted diameters are, in nanometers, 1.82, 1.74, 2.0, 2.22, 2.38, 2.64,<br />
and 2.84 for fractions A-G, respectively. Extracted Au/S ratios are<br />
4.0, 3.6, 3.3, 3.0, 2.8, and 2.1.<br />
plasmon band decreases with decreasing size so that the onset<br />
<strong>of</strong> absorption is sharper for the largest particles.<br />
In Figure 9, the predictions <strong>of</strong> the mean-free path correction<br />
are compared with the spectra obtained using SC12 surfactant<br />
groups (cf. Figure 1b), using the core radius as a fitting<br />
parameter (the extracted diameters are given in the caption).<br />
All curves have been arbitrarily normalized to unity at 4.1 eV<br />
and displaced vertically for ease <strong>of</strong> comparison. Attempts to<br />
fit the measured absorption coefficients with Mie theory and a<br />
simple MFP correction (eq 5) to the Drude terms in the dielectric<br />
function are presented in Figure 9a. The fits are poor, failing<br />
to describe the broadening <strong>of</strong> the surface plasmons and their<br />
position. The functional behavior in the mean-free path model<br />
(Figure 8) demands a relative increase in low-energy absorption,<br />
accompanying the quenching <strong>of</strong> the surface plasmon, that is<br />
not observed.<br />
A second correction takes into account that absorbates can<br />
significantly affect the metal’s electronic properties, both for<br />
bulk surfaces and in small particles. 41 The dependence in eq 4<br />
<strong>of</strong> the plasmon frequency (ωp) on the free-electron density N<br />
allows for a simple phenomenological description <strong>of</strong> the<br />
adsorbate effect. Since thiol(ate)s are intimately bound to the<br />
particle surface, it is possible that they provide or withdraw<br />
additional electron density at the interface. For self-assembled<br />
thiol monolayers on flat gold surfaces, one thiol occupies<br />
approximately 0.2 nm 2 <strong>of</strong> surface, 42 and the coverage density<br />
is increased in small particles because <strong>of</strong> curvature introduced<br />
by edges and vertices. 26 We have implemented this correction,<br />
taking as adjustable parameters the number <strong>of</strong> electrons donated<br />
(or withdrawn), the core size, and thiol surface coverage density.<br />
An improved fit can be obtained only by assuming that the<br />
surfactant groups donate electrons. In fact, if one electron is<br />
donated per RS chain adsorbed, then the extracted core<br />
dimensions and surfactant packing densities take on reasonable<br />
values, and the fits shown in Figure 9b are obtained. [To obtain<br />
these fits, the experimental absorption spectra for each mass<br />
fraction were fitted by those calculated using eq 1, with the<br />
core diameter and electron density as parameters, using the<br />
general curve-fitting feature <strong>of</strong> a commercial graphics program<br />
(Kaleidagraph). The medium was assumed to be dodecylthiol<br />
with an index <strong>of</strong> refraction <strong>of</strong> 1.4, and a thiol coverage density<br />
(electron donation density) <strong>of</strong> 0.25/nm 2 <strong>of</strong> surface was assumed<br />
as an initial guess in the iterations.] The best-fit cluster<br />
diameters are consistently 10-15% larger than the values<br />
obtained from mass spectrometry. Optimal packing densities<br />
correspond to one RS group (one donated electron) per 4.0 Au<br />
atoms at the surface <strong>of</strong> a 2.5 nm diameter particle and 1 per 2.1<br />
Au surface atoms for a 1.8 nm radius particle, in reasonable<br />
agreement with recent realistic simulations <strong>of</strong> the structure <strong>of</strong><br />
Au:alkylthiolate assemblies. 26<br />
These modifications fail to explain the abnormally wide or<br />
depressed collective oscillation band, which resists to be fitted<br />
with simple corrections even after introducing hypothetical<br />
cluster-size distributions, incorporating a Lorentz term for outer<br />
core electrons or invoking Kubo’s quantum mechanical correction<br />
to the relaxation time. 43 Physically, the passivating layer<br />
provides a dielectric coating on the surface <strong>of</strong> the sphere,<br />
amounting to a change with the dielectric constant <strong>of</strong> the<br />
medium. 9,44 However, for the surfactants studied here, the<br />
effective index <strong>of</strong> refraction is that <strong>of</strong> the thiol layer (1.45 versus<br />
1.37 for toluene). Chemical interface effects have sometimes<br />
been phenomenologically incorporated into the proportionality<br />
constant, A, to the surface scattering rate, 40 but such a correction<br />
merely preserves the same functional form as the mean-free path<br />
correction. Another proposed modification does no better.<br />
Suppose that the outer surface gold atoms bound to the thiol-<br />
(ate) lose their metallic character and are effectively removed<br />
from the metallic core, leaving its electron density unchanged.<br />
Such effect amounts to a reduction in the particle’s radius by<br />
one gold lattice constant (0.25 nm), but sizes predicted by the<br />
theory are too large already.<br />
Although lacking a specific theoretical foundation, it is<br />
possible mathematically to reproduce the spectra by modifying<br />
the dielectric functions, although this must be done in a way<br />
that satisfies certain constraints (sum rule and Kramers-Kronig<br />
relations). For example, a much improved fit is obtained simply<br />
by adding an energy-independent (<strong>of</strong>fset) correction to the<br />
optical constants 20 and suggests a transition in the electronic<br />
structure <strong>of</strong> Au at a size just below 2.0 nm. Earlier, Kreibig 45<br />
has suggested that an abrupt change in the experimentally<br />
determined dielectric constants for small gold particles takes<br />
place at approximately 3 nm diameter. Our results place this<br />
change in the electronic structure <strong>of</strong> thiol-passivated gold<br />
particles precisely where a transition in the atom-packing<br />
structure has recently been found, 27 suggesting that these may<br />
be interrelated.<br />
We conclude that the optical spectra <strong>of</strong> passivated gold<br />
nanocrystals in the 1.4-3.2 nm diameter range cannot be<br />
explained in all detail with a mean-free path correction to gold’s
3712 J. Phys. Chem. B, Vol. 101, No. 19, 1997 Alvarez et al.<br />
bulk dielectric constants. A simple model accounting for the<br />
effect <strong>of</strong> the passivating layer on the particle’s electronic density,<br />
however, brings Mie theory into better agreement by assuming<br />
that thiolate adsorption increases the free-electron density <strong>of</strong><br />
the particle in a proportion consistent with the manner in which<br />
alkane thiols are known to interact with bulk gold surfaces. The<br />
methodology employed here further allows the estimation <strong>of</strong><br />
particle sizes within 20% accuracy. However, the breakdown<br />
<strong>of</strong> the model for the smallest sizes (1.4 nm diameter) and its<br />
failure to for the fine-structure (Figure 6) indicate that pronounced<br />
quantum size effects are operative. The implied<br />
corrections needed in the optical constants suggests the presence<br />
<strong>of</strong> a critical size around 2 nm for which the electronic structure<br />
changes dramatically.<br />
IV. Concluding Remarks<br />
The evolution <strong>of</strong> the optical spectrum <strong>of</strong> passivated gold<br />
clusters in the 1.4-3.2 nm range (∼70 to ∼900 atoms) is a<br />
significant (strong) and systematic function <strong>of</strong> size. Because<br />
<strong>of</strong> this, the spectral pr<strong>of</strong>iles provide an independent, calibrated<br />
means <strong>of</strong> size determination useful for samples with narrow<br />
size distributions. Furthermore, the findings <strong>of</strong> an onset <strong>of</strong><br />
interband absorption and the steplike structure beyond are<br />
indications that optical spectroscopy at high-frequency (>1 eV<br />
energies) may provide some precise information on the electronic<br />
structure <strong>of</strong> rather large metal clusters, a conclusion that<br />
runs against the conventional experience. 1 Clearly, one requires<br />
measurements at cryogenic temperatures to remove thermal<br />
broadening effects, as well as continued efforts to improve the<br />
quality (molecular purity) and variety <strong>of</strong> materials investigated.<br />
The existence <strong>of</strong> these new materials <strong>of</strong> high stability and<br />
molecular quality suggests other spectroscopic avenues, including<br />
time-domain spectroscopy (see the accompanying article46 )<br />
and measurements on thin crystalline films <strong>of</strong> condensed<br />
nanocrystal assemblies.<br />
The quantitative analysis <strong>of</strong> the optical spectra <strong>of</strong> various<br />
samples <strong>of</strong> nanocrystal gold molecules, fractionated by size and<br />
separately characterized, confirms that their electronic and optical<br />
properties cannot be understood by any simple extrapolation<br />
from the bulk electronic properties <strong>of</strong> fcc-Au but rather require<br />
new concepts that may not yet have been clearly identified.<br />
Whether the evolution <strong>of</strong> the intensity pr<strong>of</strong>ile and its substructure<br />
can yet be explained by a combination <strong>of</strong> quantum size effects<br />
(discrete level structure), changes in internal structure, and<br />
surface electronic characteristics remains to be seen.<br />
Notes Added in Pro<strong>of</strong>. Since this paper has been submitted,<br />
the smaller sizes (below 1.7 nm) have been separated in<br />
sufficient quantities and their optical and electronic properties<br />
are discussed in a paper to be submitted.<br />
Acknowledgment. This research has been supported by the<br />
Office <strong>of</strong> Naval Research, the Packard Foundation, and the<br />
Georgia Tech Research Research Foundation. The loan <strong>of</strong> the<br />
optical spectrometer by M. A. El-Sayed is gratefully acknowledged,<br />
as are helpful discussions with D. M. Chautz.<br />
References and Notes<br />
(1) Kreibig, U.; Vollmer, M. <strong>Optical</strong> Properties <strong>of</strong> Metal Clusters;<br />
Springer: Berlin, 1995.<br />
(2) de Heer, W. A. ReV. Mod. Phys. 1993, 65, 612. Brack, M. ReV.<br />
Mod. Phys. 1993, 65, 677.<br />
(3) Encyclopedia <strong>of</strong> Chemical Technology, 4th ed.; Wiley: New York,<br />
1994; Vol. 12, pp 569-571.<br />
(4) Freeman, R. G.; et al. Science 1995, 267, 1629.<br />
(5) Fukumi, K.; Chayahara, A.; Kadono, K.; Sakaguchi, T.; Horino,<br />
Y.; Miya, M.; Fujii, K.; Hayakawa, J.; Satou, M. J. Appl. Phys. 1994, 75,<br />
3075-80, and references therein.<br />
(6) Svoboda, K.; Block, S. M. Opt. Lett. 1994, 19, 930-2.<br />
(7) Read, for instance, the following. Ostwald, W. Theoretical and<br />
Applied Colloid Chemisty; Wiley: New, York, 1922; p 200. Zsigmondy,<br />
R. The Chemisty <strong>of</strong> Colloids; Wiley: New York, 1917; p 156.<br />
(8) Mie, G. Ann. Phys. 1908, 25, 377.<br />
(9) Bohren, C. F.; Huffman, D. R. <strong>Absorption</strong> and Scattering <strong>of</strong> Light<br />
by Small Particles; Wiley: New York, 1983.<br />
(10) Creighton, J. A.; Eadon, D. G. J. Chem. Soc., Faraday Trans. 1991,<br />
87, 3881.<br />
(11) Kreibig, U.; Genzel, L. Surf. Sci. 1985, 156, 678.<br />
(12) Fragstein, C. V.; Kreibig, U. Z. Phys. 1969, 224, 306.<br />
(13) Doremus, R. H. J. Chem. Phys. 1965, 42, 414.<br />
(14) Doyle, W. T. Phys. ReV. 1958, B111, 1067.<br />
(15) Ralph, D. C.; Black, C. T.; Tinkham, M. Phys. ReV. Lett. 1995,<br />
74, 3241-44. Black, C. T.; Ralph, D. C.; Tinkham, M. Phys. ReV. Lett.<br />
1996, 76, 688-91.<br />
(16) Huffman, D. R. In An Introduction to Physiscs and Technology <strong>of</strong><br />
Thin Films; Wagendristerl, A., Wang, Y., Eds.; World Scientific: New<br />
Jersey, 1988.<br />
(17) Dubois, L. H.; Nuzzo, R. G. Annu. ReV. Phys. Chem. 1992, 43,<br />
437-463.<br />
(18) Fenter, P.; Eberhardt, A.; Eisenberger, P. Science 1994, 266, 1216.<br />
(19) Brust, M.; Walker, M.; Bethell, D.; Schiffrin, D. J.; Whyman, R.<br />
J. Chem. Soc., Chem. Commun. 1994, 801.<br />
(20) Alvarez, M. M. Ph.D. Dissertation, UCLA, 1995. Alvarez, M. M.;<br />
Vezmar, I.; Whetten, R. L., submitted for publication. See also the following.<br />
Osifchin, R. G.; Mahoney, W. J.; Bielefeld, J. D.; Andres, R. P. Superlattices<br />
Microstruct., in press.<br />
(21) Terrill, R. H.; Postlethwaite, T. A.; Chen, C.-H.; Poon, C.-D.; Terzis,<br />
A.; Chen, A.; Hutchison, J. E.; Clark, M. R.; Wignall, G.; Londono, J. D.;<br />
Superfine, R.; Falvo, M.; Johnson, C. S.; Samulski, E. T.; Murray, R. W.<br />
J. Am. Chem. Soc. 1995, 117, 12537.<br />
(22) Whetten, R. L.; Khoury, J. T.; Alvarez, M. M.; Murthy, S.; Vezmar,<br />
I.; Wang, Z. L.; Cleveland, C. L.; Luedtke, W. D.; Landman, U. In Chemical<br />
Physics <strong>of</strong> Fullerenes 5 and 10 Years Later; Andreoni, W., Ed.; Kluwer:<br />
Dordrecht, 1996; pp 475-490. See also the following. Harfenist, S. A.;<br />
Wang, Z. L.; Alvarez, M. M.; Vezmar, I.; Whetten, R. L. J. Phys. Chem.<br />
1996, 100, 13904-10.<br />
(23) Badia, A.; Singh, S.; Demers, L.; Cuccia, L.; Brown, G. R.; Lennox,<br />
R. B. Chem.sEur. J. 1996, 2, 205. Badia, A.; Gao, W.; Singh, S.; Demers,<br />
L.; Cuccia, L.; Reven, L. Langmuir 1996, 12, 1262-1269.<br />
(24) Brust, M.; Bethell, D.; Schriffin, D. J.; Kiely, C. J. AdV. Mater.<br />
1995, 7, 795-7.<br />
(25) Whetten, R. L.; Khoury, J. T.; Alvarez, M. M.; Murthy, S.; Vezmar,<br />
I.; Wang, Z. L.; Stephens, P. W.; Cleveland, C. L.; Luedtke, W. D.;<br />
Landman, U. AdV. Mater. 1995, 8, 428-433.<br />
(26) Luedtke, W. D.; Landman, U. J. Phys. Chem. 1996, 100, 13323-<br />
29.<br />
(27) Cleveland, C. L.; Landman, U.; Shafigullin, M. N.; Stephens, P.<br />
W.; Whetten, R. L. Structural evolution <strong>of</strong> larger gold clusters. Z. Phys. D,<br />
in press.<br />
(28) Alvarez, M. M.; Khoury, J. T.; Schaaff, T. G.; Shafigullin, M. N.;<br />
Vezmar, I.; Whetten, R. L. Chem. Phys. Lett. 1997, 266, 91-8.<br />
(29) Khoury, J. T.; et al. Rapid and quantitative sizing <strong>of</strong> passivated<br />
nanocrystals, submitted for publication.<br />
(30) Vezmar, I.; Alvarez, M. M.; Khoury, J. T.; Salisbury, B. E.; Cluster<br />
beams from passivated nanocrystals. Z. Phys. D, in press.<br />
(31) Shafigullin, M. N.; Alvarez, M. M.; Harfenist, S. A.; Khoury, J.<br />
T.; Schaaff, T. G.; Stephens, P. W.; Vezmar, I.; Wang, Z. L.; Wilkinson,<br />
A.; Whetten, R. L. The crystal structure <strong>of</strong> passivated-nanocrystal arrays,<br />
submitted for publication.<br />
(32) Duff, D. G.; Baiker, A.; Edwards, P. P. J. Chem. Soc., Chem.<br />
Commun. 1993, 96-8.<br />
(33) Fauth, K.; Kreibig, U.; Schmid, G. Z. Phys. D 1991, 20, 297.<br />
(34) Taylor, K. J.; Pettiette-Hall, C. L.; Cheshnovsky, O.; Smalley, R.<br />
E. J. Chem. Phys. 1992, 96, 3319.<br />
(35) Devaty, R. P.; Sievers, A. J. Phys. ReV. 1985, B32, 1951.<br />
(36) Li, X.; Whetten, R. L. J. Chem. Phys. 1993, 98, 6170.<br />
(37) For review, see the following. Alivisatos, A. P. J. Phys. Chem.<br />
1996, 100, 13226.<br />
(38) Ziman, J. M. Theory <strong>of</strong> Solids; University Press: Camobridge, 1979;<br />
p 278.<br />
(39) Johnson, P. B.; Christy, R. W. Phys. ReV. 1972, B6, 4370-79.<br />
(40) Hovel, H. S.; Fritz, A. H.; Kreibig, U.; Vollmer, M. Phys. ReV.<br />
1993, B48, 18178.<br />
(41) Henglein, A. J. Phys. Chem. 1993, 97, 5457.<br />
(42) Camillone, N., III; Chidsey, C. E. D.; Liu, G.; Scoles, G. J. Chem.<br />
Phys. 1993, 98, 4234.<br />
(43) Kawabata, A.; Kubo, R. J. Phys. Soc. Jpn. 1966, 21, 1765.<br />
(44) Linnert, T.; Mulvaney, P.; Henglein, A. J. Phys. Chem. 1993, 97,<br />
679.<br />
(45) Kreibig, U.; Hilger, A.; Hövel, H.; Quiten, M. In Large clusters <strong>of</strong><br />
atoms and molecules; Martin, T. P., Ed.; Kluwer: Dordrecht, 1996; pp 477-<br />
9.<br />
(46) Logunov, S.; Ahmadi, T. S.; El-Sayed, M. A.; Khoury, J. T.;<br />
Whetten, R. L. Electron dynamics <strong>of</strong> passivated gold nanocrystals probed<br />
by subpicosecond transient absorption spectroscopy. J. Phys. Chem. 1997,<br />
101, 3713.