NAPENews Magazine June 2023 Edition
NAPENews Magazine June 2023 Edition
NAPENews Magazine June 2023 Edition

Create successful ePaper yourself
Turn your PDF publications into a flip-book with our unique Google optimized e-Paper software.
and exploration, appraisal and development costs. Subsequently, the unit-development cost at a discount rate of 0% (UDC0) was<br />
calculated for each case. A probabilistic portfolio volume distribution was also generated at this stage to demonstrate cumulative risked low-<br />
, mid- and high-case volume scenarios to complement the scenario-based approach modeled in PetroVR.<br />
Figure 4: Selected case map model outputs based on scenarios described in the case map.<br />
Case I is the extreme high case and represents the best possible subsurface outcome<br />
considered, which translates to the simplest and lowest cost notional development plan.<br />
Case VI is an example of a mixed success-failure case requiring relatively higher effort to<br />
develop. Case XIV is the extreme low case where volumes are small and distributed<br />
throughout a large area, requiring very high effort and cost to develop.<br />
Insights<br />
In a cash-constrained exploration business<br />
with a finite portfolio of opportunities, gas<br />
backfill planning must address three<br />
fundamental questions, namely, (1) How<br />
many exploration wells must be drilled to find<br />
the required gas volume, (2) What is the<br />
probability of finding enough gas to close the<br />
supply gap, and (3) Given the inherent<br />
uncertainty around pre-exploration gas<br />
volume ranges, what combinations of portfolio<br />
success and failure will close the supply gap,<br />
and at what cost? Using the Case Map in<br />
conjunction with the modeling capabilities of<br />
PetroVR, and a probabilistic portfolio volume<br />
model, we can now address these questions.<br />
The number of wells required to find the<br />
required gas volume to close the supply gap is<br />
a function of the overall outcome from drilling<br />
the exploration portfolio. Figure 5a illustrates<br />
these outcomes via a series of cumulative<br />
volume curves representing a low-, mid- and<br />
high case for the portfolio, assuming we drill<br />
prospects A through H in order. If the volume<br />
results are trending along the cumulative highcase<br />
curve, after 4 wells the minimum volume<br />
threshold to close the supply gap will have<br />
been met and the exploration campaign can<br />
be stopped. Conversely, if the volume results<br />
are trending along the cumulative low-case curve, after 6 wells it will be clear that there is no possibility of meeting the required volume, and<br />
therefore the exploration campaign should be stopped. If volume results trend along the cumulative mid-case curve, then all 8 prospects in<br />
the portfolio must be drilled to surpass the minimum volume threshold.<br />
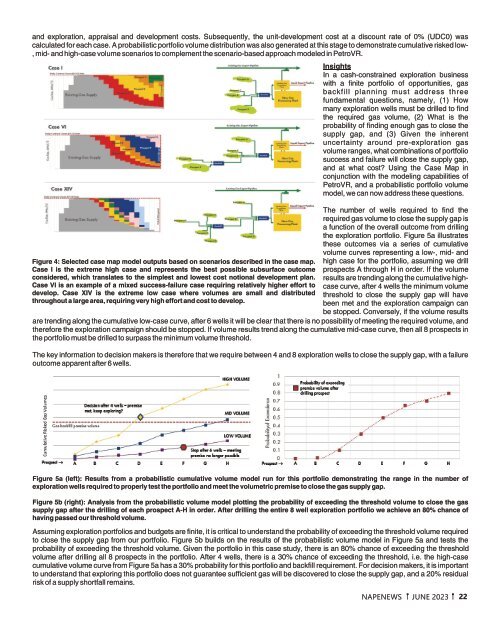
The key information to decision makers is therefore that we require between 4 and 8 exploration wells to close the supply gap, with a failure<br />
outcome apparent after 6 wells.<br />
Figure 5a (left): Results from a probabilistic cumulative volume model run for this portfolio demonstrating the range in the number of<br />
exploration wells required to properly test the portfolio and meet the volumetric premise to close the gas supply gap.<br />
Figure 5b (right): Analysis from the probabilistic volume model plotting the probability of exceeding the threshold volume to close the gas<br />
supply gap after the drilling of each prospect A-H in order. After drilling the entire 8 well exploration portfolio we achieve an 80% chance of<br />
having passed our threshold volume.<br />
Assuming exploration portfolios and budgets are finite, it is critical to understand the probability of exceeding the threshold volume required<br />
to close the supply gap from our portfolio. Figure 5b builds on the results of the probabilistic volume model in Figure 5a and tests the<br />
probability of exceeding the threshold volume. Given the portfolio in this case study, there is an 80% chance of exceeding the threshold<br />
volume after drilling all 8 prospects in the portfolio. After 4 wells, there is a 30% chance of exceeding the threshold, i.e. the high-case<br />
cumulative volume curve from Figure 5a has a 30% probability for this portfolio and backfill requirement. For decision makers, it is important<br />
to understand that exploring this portfolio does not guarantee sufficient gas will be discovered to close the supply gap, and a 20% residual<br />
risk of a supply shortfall remains.<br />
NAPENEWS JUNE <strong>2023</strong> 22