Green Economy Journal Issue 60

You also want an ePaper? Increase the reach of your titles
YUMPU automatically turns print PDFs into web optimized ePapers that Google loves.
THOUGHT LEADERSHIP<br />
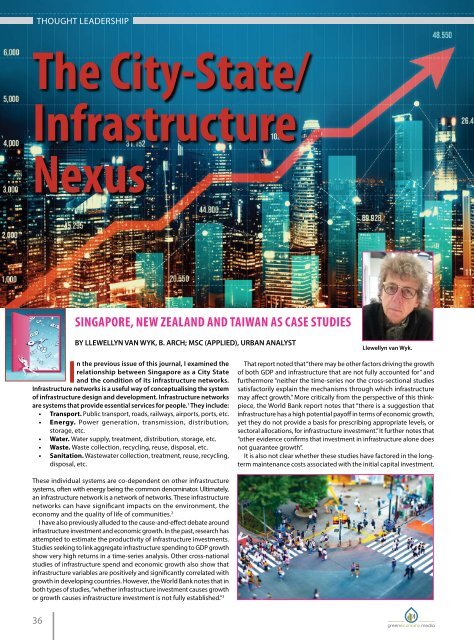
The City-State/<br />
THOUGHT LEADERSHIP<br />
Compactness and strategic<br />
investment decision-making<br />
are key factors in Taiwan<br />
and Singapore’s success.<br />
Infrastructure<br />
Nexus<br />
SINGAPORE, NEW ZEALAND AND TAIWAN AS CASE STUDIES<br />
BY LLEWELLYN VAN WYK, B. ARCH; MSC (APPLIED), URBAN ANALYST<br />
In the previous issue of this journal, I examined the<br />
relationship between Singapore as a City State<br />
and the condition of its infrastructure networks.<br />
Infrastructure networks is a useful way of conceptualising the system<br />
of infrastructure design and development. Infrastructure networks<br />
are systems that provide essential services for people. 1 They include:<br />
• Transport. Public transport, roads, railways, airports, ports, etc.<br />
• Energy. Power generation, transmission, distribution,<br />
storage, etc.<br />
• Water. Water supply, treatment, distribution, storage, etc.<br />
• Waste. Waste collection, recycling, reuse, disposal, etc.<br />
• Sanitation. Wastewater collection, treatment, reuse, recycling,<br />
disposal, etc.<br />
These individual systems are co-dependent on other infrastructure<br />
systems, often with energy being the common denominator. Ultimately,<br />
an infrastructure network is a network of networks. These infrastructure<br />
networks can have significant impacts on the environment, the<br />
economy and the quality of life of communities. 2<br />
I have also previously alluded to the cause-and-effect debate around<br />
infrastructure investment and economic growth. In the past, research has<br />
attempted to estimate the productivity of infrastructure investments.<br />
Studies seeking to link aggregate infrastructure spending to GDP growth<br />
show very high returns in a time-series analysis. Other cross-national<br />
studies of infrastructure spend and economic growth also show that<br />
infrastructure variables are positively and significantly correlated with<br />
growth in developing countries. However, the World Bank notes that in<br />
both types of studies, “whether infrastructure investment causes growth<br />
or growth causes infrastructure investment is not fully established.” 3<br />
36<br />
Llewellyn van Wyk.<br />
That report noted that “there may be other factors driving the growth<br />
of both GDP and infrastructure that are not fully accounted for” and<br />
furthermore “neither the time-series nor the cross-sectional studies<br />
satisfactorily explain the mechanisms through which infrastructure<br />
may affect growth.” More critically from the perspective of this thinkpiece,<br />
the World Bank report notes that “there is a suggestion that<br />
infrastructure has a high potential payoff in terms of economic growth,<br />
yet they do not provide a basis for prescribing appropriate levels, or<br />
sectoral allocations, for infrastructure investment.” It further notes that<br />
“other evidence confirms that investment in infrastructure alone does<br />
not guarantee growth”.<br />
It is also not clear whether these studies have factored in the longterm<br />
maintenance costs associated with the initial capital investment.<br />
CASE STUDY<br />
When discussing infrastructure networks, it is quite useful to<br />
compare Singapore to New Zealand and Taiwan. They are all island<br />
states with both Taiwan and Singapore being small countries, and<br />
they all have highly-developed economies.<br />
Singapore<br />
The land size of Singapore is 728.6 square kilometres with a population<br />
of 5.454-million resulting in a population density of 8.019.<br />
The World Economic Forum’s Global Competitiveness Report 2019<br />
ranked Singapore at 1 overall. Its infrastructure quality was also<br />
rated at 1 overall. Road connectivity was not ranked as data was<br />
not available for the report, but the quality of road infrastructure<br />
was rated at 1, railroad density at 1, efficiency of train services at<br />
5, electricity access at 2, electricity supply quality at 2, exposure<br />
to unsafe drinking water at 25 and reliability of water supply at 7.<br />
New Zealand<br />
The land size of New Zealand is 268 021 square kilometres with a<br />
population in December 2022 of 5.15-million resulting in a population<br />
density of 19.21 per square kilometre. Of the roughly 5.1-million<br />
people, about 1.6-million live in Auckland, 381 500 in Christchurch<br />
and 212 700 in Wellington. This means that almost half of the total<br />
population resides in three major cities in the country, with the<br />
remainder of the population dispersed across South and North Island<br />
in small towns and villages all of which need to be serviced by both<br />
hard and soft infrastructure.<br />
The World Economic Forum’s Global Competitiveness Report<br />
2019 ranked New Zealand at 19th overall. It ranked New Zealand’s<br />
overall infrastructure at 46, road connectivity at 51, its quality of<br />
roads at 52, railroad density at 50, efficiency of train services at 42,<br />
quality of railroad infrastructure at 41, electricity supply quality<br />
at 40, exposure to unsafe drinking water at 29 and reliability of<br />
water supply at 36.<br />
In recent years, New Zealand has invested around 4.5% of gross<br />
domestic product (GDP) in network infrastructure (electricity,<br />
telecommunications, transport and water) and social infrastructure<br />
(education and health). 4 However, New Zealand’s infrastructure hole<br />
has been estimated at $210-billion, requiring an annual spend of<br />
10% of GDP for the next 30 years to build the new networks needed. 5<br />
There is a strong debate in Auckland about its future growth pattern<br />
– compact urban city versus urban sprawl. While the city’s Unitary<br />
Plan seemed to lean toward urban sprawl, the recent flooding, slope<br />
instability and infrastructure damage caused by the cyclonic activity<br />
which impacted on the country over the past two years has caused<br />
a rethink, with consideration now been given to areas previously<br />
earmarked for urban expansion reverting back to rural land zoning. 6 As<br />
Louise Johnston, the Dairy Flat Representative on the Rodney District<br />
Board notes, “The cost of the infrastructure is one thing that cannot<br />
be debated. <strong>Green</strong>field development costs billions and developer<br />
contributions don’t come close to funding even the basic infrastructure<br />
(roading, waste and water). However, when urbanising greenfield areas<br />
on a large scale, we can’t just focus on the infrastructure within the<br />
development – the surrounding road networks and connections need<br />
to be upgraded to cope with the thousands of extra cars on the road.<br />
How this infrastructure is to be funded is an unanswered question.<br />
Council’s financial woes are well documented: the cash-strapped<br />
council doesn’t have the financial means to fund the operating costs<br />
of its current community facilities in the long term, let alone build<br />
new ones to make new urban areas liveable.”<br />
Taiwan<br />
The land area of Taiwan is 31 197 square kilometres with a population<br />
of 23.9-million giving a population density of 676 persons per square<br />
kilometre. In recent years, Taiwan has invested 5.6% of gross domestic<br />
product (GDP) on economic infrastructure. However, Taiwan has a<br />
high per capita GDP of USD32 811 in 2020, and a well-developed and<br />
efficient network infrastructure that sets the country apart from others.<br />
The World Economic Forum’s Global Competitiveness Report 2019<br />
ranked Taiwan at 12th overall. The overall quality of infrastructure was<br />
ranked at 16th. Road connectivity was ranked at 81, quality of road<br />
infrastructure at 12, railroad density at 22, efficiency of train services<br />
at 8, electricity access at 2, electricity supply quality at 8, exposure<br />
to unsafe drinking water at 38, and reliability of water supply at 45.<br />
37