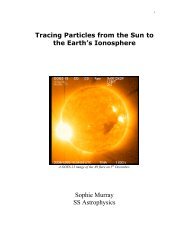
Space Weather Monitors SID Users Manual - Stanford Solar Center ...
Space Weather Monitors SID Users Manual - Stanford Solar Center ...
Space Weather Monitors SID Users Manual - Stanford Solar Center ...

You also want an ePaper? Increase the reach of your titles
YUMPU automatically turns print PDFs into web optimized ePapers that Google loves.
<strong>Space</strong> <strong>Weather</strong> <strong>Monitors</strong> <strong>SID</strong> <strong>Manual</strong><br />
Reg #: This column tells you which active region (sunspot number) of the Sun produced the<br />
event.<br />
If the GOES catalog indicates a flare at the time your graph shows a spike, you have most<br />
likely detected a flare!<br />
Sometimes <strong>SID</strong> monitors pick up flares that do not appear in the GOES catalog. Then you have<br />
found an “undocumented” flare! It doesn’t appear on the charts because the charts are reduced<br />
from data by humans, who sometimes make mistakes. We are looking into the possibility of<br />
having flares detected by students be incorporated into the general GOES catalogs.<br />
Remember that the GOES satellites are detecting solar flares as they are emitted from the Sun.<br />
Your <strong>SID</strong> monitor is detecting changes to the Earth’s ionosphere caused by those same flares. So<br />
while your monitor and the satellites are tracking different effects, they are based on the same<br />
phenomena.<br />
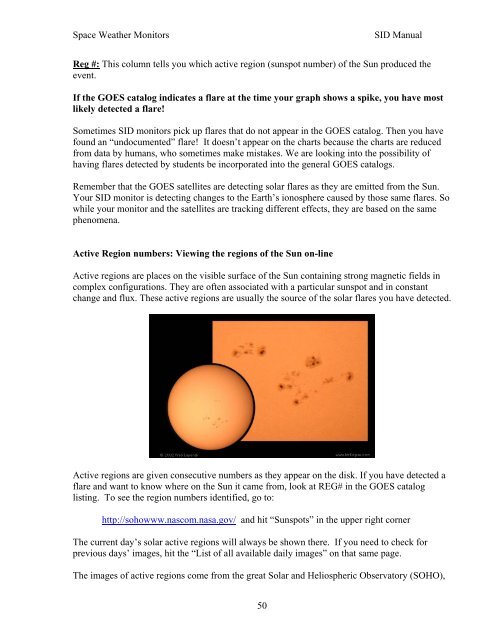
Active Region numbers: Viewing the regions of the Sun on-line<br />
Active regions are places on the visible surface of the Sun containing strong magnetic fields in<br />
complex configurations. They are often associated with a particular sunspot and in constant<br />
change and flux. These active regions are usually the source of the solar flares you have detected.<br />
Active regions are given consecutive numbers as they appear on the disk. If you have detected a<br />
flare and want to know where on the Sun it came from, look at REG# in the GOES catalog<br />
listing. To see the region numbers identified, go to:<br />
http://sohowww.nascom.nasa.gov/ and hit “Sunspots” in the upper right corner<br />
The current day’s solar active regions will always be shown there. If you need to check for<br />
previous days’ images, hit the “List of all available daily images” on that same page.<br />
The images of active regions come from the great <strong>Solar</strong> and Heliospheric Observatory (SOHO),<br />
50