NATIONAL INDUSTRIALIZATION CO. (TASNEE) - Bank Audi
NATIONAL INDUSTRIALIZATION CO. (TASNEE) - Bank Audi
NATIONAL INDUSTRIALIZATION CO. (TASNEE) - Bank Audi

You also want an ePaper? Increase the reach of your titles
YUMPU automatically turns print PDFs into web optimized ePapers that Google loves.
ENTITY OF AUDI SARADAR GROUP<br />
CURRENT PRICE SAR 24.8<br />
FAIR VALUE SAR 33.2<br />
RATING BUY<br />
Stock Data<br />
November 23, 2012<br />
HIGHLIGHTS<br />
Ticker NIC AB<br />
Bloomberg Median TP (SAR) 41.3<br />
Market Cap (SAR mn) 16,589<br />
Market Cap (USD mn) 4,424<br />
Number of Shares (mn) 668.9<br />
Avg Mon Liquidity (SAR mn ) 790.8<br />
52 week High (SAR) 42.3<br />
52 week Low (SAR) 24.8<br />
Ownership Structure<br />
Private Enterprises 38.0%<br />
GOSI 8.6%<br />
Public 53.4%<br />
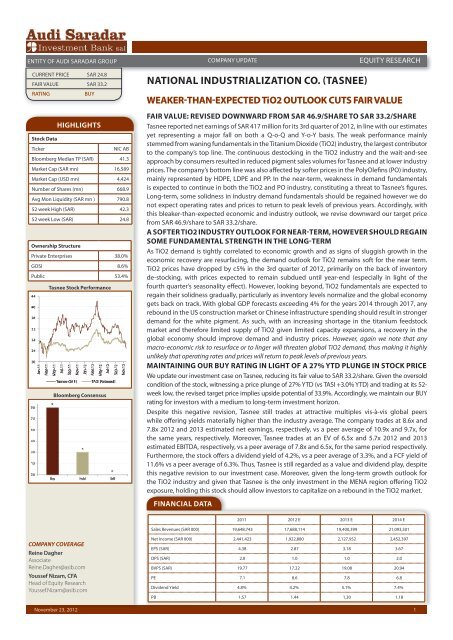
Tasnee Stock Performance<br />
Bloomberg Consensus<br />
<strong>CO</strong>MPANY <strong>CO</strong>VERAGE<br />
Reine Dagher<br />
Associate<br />
Reine.Dagher@asib.com<br />
Youssef Nizam, CFA<br />
Head of Equity Research<br />
Youssef.Nizam@asib.com<br />
EQUITY RESEARCH<br />
WEAKER-THAN-EXPECTED TiO2 OUTLOOK CUTS FAIR VALUE<br />
FAIR VALUE: REVISED DOWNWARD FROM SAR 46.9/SHARE TO SAR 33.2/SHARE<br />
Tasnee reported net earnings of SAR 417 million for its 3rd quarter of 2012, in line with our estimates<br />
yet representing a major fall on both a Q-o-Q and Y-o-Y basis. The weak performance mainly<br />
stemmed from waning fundamentals in the Titanium Dioxide (TiO2) industry, the largest contributor<br />
to the company’s top line. The continuous destocking in the TiO2 industry and the wait-and-see<br />
approach by consumers resulted in reduced pigment sales volumes for Tasnee and at lower industry<br />
prices. The company’s bottom line was also affected by softer prices in the PolyOlefins (PO) industry,<br />
mainly represented by HDPE, LDPE and PP. In the near-term, weakness in demand fundamentals<br />
is expected to continue in both the TiO2 and PO industry, constituting a threat to Tasnee’s figures.<br />
Long-term, some solidness in industry demand fundamentals should be regained however we do<br />
not expect operating rates and prices to return to peak levels of previous years. Accordingly, with<br />
this bleaker-than-expected economic and industry outlook, we revise downward our target price<br />
from SAR 46.9/share to SAR 33.2/share.<br />
A SOFTER TIO2 INDUSTRY OUTLOOK FOR NEAR-TERM, HOWEVER SHOULD REGAIN<br />
SOME FUNDAMENTAL STRENGTH IN THE LONG-TERM<br />
As TiO2 demand is tightly correlated to economic growth and as signs of sluggish growth in the<br />
economic recovery are resurfacing, the demand outlook for TiO2 remains soft for the near term.<br />
TiO2 prices have dropped by c5% in the 3rd quarter of 2012, primarily on the back of inventory<br />
de-stocking, with prices expected to remain subdued until year-end (especially in light of the<br />
fourth quarter’s seasonality effect). However, looking beyond, TiO2 fundamentals are expected to<br />
regain their solidness gradually, particularly as inventory levels normalize and the global economy<br />
gets back on track. With global GDP forecasts exceeding 4% for the years 2014 through 2017, any<br />
rebound in the US construction market or Chinese infrastructure spending should result in stronger<br />
demand for the white pigment. As such, with an increasing shortage in the titanium feedstock<br />
market and therefore limited supply of TiO2 given limited capacity expansions, a recovery in the<br />
global economy should improve demand and industry prices. However, again we note that any<br />
macro-economic risk to resurface or to linger will threaten global TiO2 demand, thus making it highly<br />
unlikely that operating rates and prices will return to peak levels of previous years.<br />
MAINTAINING OUR BUY RATING IN LIGHT OF A 27% YTD PLUNGE IN STOCK PRICE<br />
We update our investment case on Tasnee, reducing its fair value to SAR 33.2/share. Given the oversold<br />
condition of the stock, witnessing a price plunge of 27% YTD (vs TASI +3.0% YTD) and trading at its 52week<br />
low, the revised target price implies upside potential of 33.9%. Accordingly, we maintain our BUY<br />
rating for investors with a medium to long-term investment horizon.<br />
Despite this negative revision, Tasnee still trades at attractive multiples vis-à-vis global peers<br />
while offering yields materially higher than the industry average. The company trades at 8.6x and<br />
7.8x 2012 and 2013 estimated net earnings, respectively, vs a peer average of 10.9x and 9.7x, for<br />
the same years, respectively. Moreover, Tasnee trades at an EV of 6.5x and 5.7x 2012 and 2013<br />
estimated EBITDA, respectively, vs a peer average of 7.8x and 6.5x, for the same period respectively.<br />
Furthermore, the stock offers a dividend yield of 4.2%, vs a peer average of 3.3%, and a FCF yield of<br />
11.6% vs a peer average of 6.3%. Thus, Tasnee is still regarded as a value and dividend play, despite<br />
this negative revision to our investment case. Moreover, given the long-term growth outlook for<br />
the TiO2 industry and given that Tasnee is the only investment in the MENA region offering TiO2<br />
exposure, holding this stock should allow investors to capitalize on a rebound in the TiO2 market.<br />
FINANCIAL DATA<br />
<strong>CO</strong>MPANY UPDATE<br />
<strong>NATIONAL</strong> <strong>INDUSTRIALIZATION</strong> <strong>CO</strong>. (<strong>TASNEE</strong>)<br />
2011 2012 E 2013 E 2014 E<br />
Sales Revenues (SAR 000) 19,648,743 17,688,114 19,400,399 21,093,501<br />
Net Income (SAR 000) 2,441,423 1,922,880 2,127,952 2,452,397<br />
EPS (SAR) 4.38 2.87 3.18 3.67<br />
DPS (SAR) 2.0 1.0 1.0 2.0<br />
BVPS (SAR) 19.77 17.22 19.08 20.94<br />
PE 7.1 8.6 7.8 6.8<br />
Dividend Yield 4.8% 4.2% 5.1% 7.4%<br />
PB 1.57 1.44 1.30 1.18<br />
1
SAF<strong>CO</strong> <strong>CO</strong>MPANY UPDATE<br />
EQUITY RESEARCH<br />
November 23, 2012<br />
VALUATION<br />
FCFF VALUATION<br />
We revisited our FCFF model incorporating the weaker-than-expected global economic and<br />
industry growth. We reviewed mainly our price projections for TiO2, noting that the latest Cristal<br />
announcement of a TiO2 price increase dated all way back in December 2011. In addition, we<br />
reviewed downward our price projections for HDPE, LDPE and PP. We adjusted our discount rate to<br />
9.0%, from a previous 10.4%, and the growth rate to 2.1%, from a previous 2.4%, to reflect the latest<br />
macro-developments and the latest changes in the company’s financial position. Accordingly, a fair<br />
value of SAR 32.9/share was obtained.<br />
(SAR 000) 2012 E 2013 E 2014 E<br />
Net Income 1,922,880 2,127,952 2,452,397<br />
Change in Working Capital 413,915 (513,935) 834,347<br />
Non-Cash Charges 1,305,363 1,431,728 1,556,677<br />
Capex 1,173,880 1,157,358 1,258,362<br />
Interest Expense 661,848 648,009 577,627<br />
Free Cash Flow to the Firm (FCFF) 2,302,296 3,564,267 2,493,992<br />
Present Value of FCFF 2,302,296 2,997,948 1,923,871<br />
Present Value of Terminal Value 28,517,658<br />
Intrinsic Value of the Firm 35,741,774<br />
Net Debt 13,731,348<br />
Intrinsic Value of Equity 22,010,426<br />
WACC 9.0%<br />
Terminal Growth Rate 2.1%<br />
Shares Outstanding (000) 668,914<br />
NAV per share (SAR) 32.9<br />
SENSITIVITY ANALYSIS<br />
Below is a data table presenting a sensitivity analysis to our price target valuation, assuming various<br />
growth and discount rates.<br />
Terminal Growth Rate<br />
WACC<br />
8.0% 8.5% 9.0% 9.5% 10.0% 10.5% 11.0% 11.5% 12.0%<br />
1.0% 32.8 29.3 26.3 23.6 21.2 19.0 17.1 15.4 13.8<br />
1.25% 34.5 30.8 27.5 24.7 22.2 19.9 17.9 16.0 14.4<br />
1.5% 36.3 32.3 28.9 25.9 23.2 20.8 18.7 16.8 15.0<br />
1.75% 38.3 34.0 30.3 27.1 24.3 21.8 19.6 17.5 15.7<br />
2.0% 40.4 35.8 31.9 28.4 25.4 22.8 20.5 18.4 16.5<br />
2.25% 42.7 37.8 33.5 29.9 26.7 23.9 21.4 19.2 17.2<br />
2.5% 45.2 39.9 35.3 31.4 28.0 25.0 22.4 20.1 18.0<br />
2.75% 48.0 42.1 37.2 33.0 29.4 26.3 23.5 21.1 18.9<br />
3.0% 51.0 44.6 39.3 34.8 30.9 27.6 24.7 22.1 19.8<br />
2
<strong>TASNEE</strong><br />
November 23, 2012<br />
RELATIVE VALUATION<br />
<strong>CO</strong>MPANY UPDATE EQUITY RESEARCH<br />
Using two different earnings multiples, we valued Tasnee on an equal basis with comparable peers<br />
region-wide and world-wide. Tasnee should be trading at a premium to regional counterparts given<br />
mainly its exclusive and significant exposure to TiO2, in addition to its largely diversified income<br />
stream, an advantage shared by very few counterparts in the region. Furthermore, Tasnee should<br />
be trading at a premium to global peers given that the company benefits from a notable feedstock<br />
advantage in the production of polyolefins.<br />
P/E MULTIPLE<br />
Tasnee’s counterparts trade at an average of 10.9x estimated 2012 earnings, opposed to Tasnee trading<br />
at 8.6x its estimated 2012 earnings, implying an unjustified discount to its peers. Based on our 2012<br />
earnings per share (EPS) estimate of SAR 2.87, a fair value of SAR 31.4/share was derived, thus offering<br />
an upside potential of 26.4% for the company’s stock.<br />
EV/EBITDA MULTIPLE<br />
On a forward basis (2012E), Tasnee’s peer group trades at an average EV/EBITDA of 7.8x opposed to<br />
Tasnee’s EV/EBITDA of 6.5x. Accordingly, a fair value of SAR 36.0/share was obtained, resulting in an<br />
upside potential of 45.0%.<br />
(SAR 000)<br />
EBITDA 2012E 5,742,171<br />
Enterprise Value 44,788,933<br />
Net Debt as of YE12 E 13,980,539<br />
Minority Interest as of YE12 E 6,758,963<br />
Market Capitalization 24,049,431<br />
Shares Outstanding (000) 668,914<br />
NAV per Share (SAR) 36.0<br />
FINAL VALUATION<br />
Attributing a 60% weight to the FCFF valuation and the remaining weight to the comparative<br />
valuation, a final fair value of SAR 33.2/share was derived for Tasnee, offering an upside potential of<br />
33.9% (based on the closing price of SAR 24.8/share).<br />
Fair Value (SAR) Weight<br />
FCFF Valuation 32.9 60%<br />
Relative Valuation<br />
P/E 31.4 20%<br />
EV/EBITDA 36.0 20%<br />
Final Fair Value per Share (SAR) 33.2<br />
3
<strong>TASNEE</strong><br />
November 23, 2012<br />
<strong>CO</strong>MPANY UPDATE EQUITY RESEARCH<br />
APPENDIX A: PRO-FORMA IN<strong>CO</strong>ME STATEMENT<br />
(SAR 000) 2011 2012E 2013E 2014E<br />
Sales 19,648,743 17,688,114 19,400,399 21,093,501<br />
Cost of Sales (12,657,082) (11,915,594) (12,784,863) (13,816,243)<br />
Gross Profit 6,991,661 5,772,520 6,615,536 7,277,258<br />
S,G&A expenses (1,597,396) (1,512,215) (1,642,126) (1,785,436)<br />
Share in net income of associates 12,703 16,780 18,952 17,866<br />
Income from operations 5,406,968 4,277,085 4,992,362 5,509,687<br />
Investment income and other 80 159,722 164,481 180,880<br />
Financing charges (692,656) (661,848) (648,009) (577,627)<br />
Income before zakat, income tax and MI 4,713,634 3,774,959 4,508,834 5,112,940<br />
Zakat and income tax on subsidiaries (539,393) (418,342) (527,459) (598,130)<br />
Minority interest (1,725,751) (1,414,213) (1,669,764) (1,893,484)<br />
Income before zakat 2,448,490 1,942,404 2,311,610 2,621,326<br />
Zakat (7,067) (19,524) (183,658) (168,929)<br />
Net Income 2,441,423 1,922,880 2,127,952 2,452,397<br />
APPENDIX B: PRO-FORMA BALANCE SHEET (SUMMARIZED)<br />
(SAR 000) 2011 2012E 2013E 2014E<br />
Cash and cash equivalents 4,636,675 5,140,859 6,349,548 5,285,079<br />
Accounts receivables 4,140,326 3,572,098 3,917,892 4,259,812<br />
Inventories 3,692,544 4,345,280 3,729,822 4,030,715<br />
Prepaid expenses and other assets 391,013 728,451 559,732 540,699<br />
Total current assets 12,860,558 13,786,688 14,556,994 14,116,305<br />
Investments in associated companies and other 471,622 458,969 474,029 489,089<br />
PPE, net 17,830,489 18,388,339 21,415,348 22,193,886<br />
Intangible assets, net 3,569,127 3,390,671 3,212,214 3,033,758<br />
Projects under progress 4,105,038 5,423,000 1,963,000 1,613,000<br />
Other non-current assets 753,256 720,220 746,521 733,370<br />
Total non-current assets 27,067,021 28,929,497 28,405,655 28,634,524<br />
Total Assets 39,927,579 42,716,184 42,962,649 42,750,828<br />
Short-term facilities and Murabaha 3,387,118 1,831,181 2,049,658 2,268,136<br />
Current portion of long-term loans 1,586,773 2,091,846 2,091,846 2,091,846<br />
Accounts payable 1,027,614 1,035,644 1,111,196 900,629<br />
Accrued expenses and other liabilities 1,953,075 1,839,538 1,957,984 2,098,519<br />
Total current liabilities 7,954,580 6,798,210 7,210,685 7,359,130<br />
Long-term loans 11,363,330 15,198,371 13,106,524 11,014,678<br />
Other non-current liabilities 2,833,232 2,441,979 2,391,568 2,152,580<br />
Total non-current liabilities 14,196,562 17,640,350 15,498,092 13,167,258<br />
Total shareholders’ equity 11,022,826 11,518,662 12,764,104 14,005,967<br />
Minority interests 6,753,611 6,758,963 7,489,768 8,218,473<br />
Total Equity 17,776,437 18,277,625 20,253,872 22,224,440<br />
Total Liabilities and Equity 39,927,579 42,716,184 42,962,649 42,750,828<br />
4
<strong>TASNEE</strong><br />
FAIR VALUE DEFINITION<br />
November 23, 2012<br />
RATING GUIDE<br />
ISSUER<br />
<strong>CO</strong>MPANY UPDATE EQUITY RESEARCH<br />
It is an unbiased estimate of the 12-month potential market price of the stock<br />
SELL REDUCE HOLD ACCUMULATE BUY<br />
Downside -30% -10% +10% +30% Upside<br />
BUY: Upside potential in share price is more than 30%<br />
ACCUMULATE: Upside potential in share price is between 10 and 30%<br />
HOLD: Upside or downside potential in share price less than 10%<br />
REDUCE: Downside potential in share price is between 10 and 30%<br />
SELL: Downside potential in share price is more than 30%<br />
<strong>Audi</strong> Saradar Investment <strong>Bank</strong><br />
<strong>Audi</strong> Saradar Investment <strong>Bank</strong> SAL • Lebanese joint stock company with a registered capital of<br />
10,000,000,000 Lebanese Pounds • Commercial Registrar in Beirut: 30812 • Holding number 33 on<br />
the Central <strong>Bank</strong>’s <strong>Bank</strong>s List.<br />
Address: <strong>Bank</strong> <strong>Audi</strong> Plaza • Bab Idriss • Beirut 2021 8102 Lebanon • P.O. Box 11-2560 • Beirut 1107<br />
2808 • Lebanon. Phone: +961 1 964072 • Fax: +961 1 970403 • Email: contactus@asib.com<br />
5
<strong>TASNEE</strong><br />
November 23, 2012<br />
DISCLAIMER<br />
<strong>CO</strong>MPANY UPDATE EQUITY RESEARCH<br />
“All rights reserved. This research document (the “Document”) is prepared by <strong>Audi</strong> Saradar Investment <strong>Bank</strong> SAL (“ASIB”),<br />
being an entity of <strong>Audi</strong> Saradar Group, for the use of the clients of ASIB and/or the clients of any entity within the <strong>Audi</strong><br />
Saradar Group.<br />
This Document is disclosed to you on a confidential basis. Receipt and/or review of this Document constitute your agreement<br />
not to copy, modify, redistribute, retransmit, or disclose to others the contents, opinions, conclusion, or information<br />
contained in this Document prior to public disclosure of the same by ASIB or the <strong>Audi</strong> Saradar Group or without the express<br />
prior written consent of ASIB.<br />
This Document is not intended for dissemination, distribution to, or use by, any person or entity in any country or jurisdiction<br />
which would subject ASIB or any entity within the <strong>Audi</strong> Saradar Group, to any registration or licensing requirements within<br />
these jurisdictions or where it might be considered as unlawful. Accordingly, this Document is for distribution solely in<br />
jurisdictions where permitted and to persons who may receive it without breaching any applicable legal or regulatory<br />
requirements. In any case, this Document shall not be distributed in the Republic of Egypt.<br />
Your attention is drawn to the fact that you should not access this Document if the regulations of your country of citizenship<br />
and/or residency or any applicable regulations prohibit it. In any case, persons who are subject to any restrictions in any<br />
country, such as US persons are not permitted to access information contained herein.<br />
Neither the information, nor any opinion expressed herein constitutes an offer or an invitation or a recommendation to<br />
make an offer, to buy or sell any security or other investment product related to such security or investment. This Document<br />
provides general information only, is not intended to provide personal investment advice or recommendation and does not<br />
take into account the specific investment objectives, financial situation and the particular needs of any specific person who<br />
may receive it. You should seek financial, legal or tax advice regarding the appropriateness and suitability in investing in any<br />
security, other investment or investment strategy discussed or forecasted in this Document.<br />
You should carefully read the definitions of the Rating Guide provided in this Document. In addition you should read this<br />
Document in its entirety and not conclude its contents from the ratings solely.<br />
The information herein was obtained from various public sources believed in good faith to be reliable. Neither ASIB nor any<br />
entity within the <strong>Audi</strong> Saradar Group represents that the information contained in this Document is complete, accurate<br />
or free from any error and makes no representations or warranties whatsoever as to the data, information and opinions<br />
provided herein.<br />
This Document and any information, opinion and prospect contained herein reflect a judgment at its original date<br />
of publication by ASIB and are subject to change without notice. ASIB and/or any entity within the <strong>Audi</strong> Saradar Group<br />
may have issued, and may in the future issue, other research documents that are inconsistent with, and reach different<br />
conclusions from, the information, opinions and prospects presented in this Document.<br />
This Document reflects the different assumptions, views and analytical methods of the analysts who prepared them; ASIB,<br />
and the <strong>Audi</strong> Saradar Group are under no obligation to ensure that such other research documents are brought to the<br />
attention of any recipient of this Document.<br />
ASIB, any entity within the <strong>Audi</strong> Saradar Group, one or more of their affiliates and/or their officers (including but not limited<br />
to their strategists, analysts and sales staff) may have a financial interest in securities of the issuer(s) or related investments,<br />
may engage in securities transactions, on a proprietary basis or otherwise, in a manner inconsistent with the view taken in<br />
this Document and may take a view that is inconsistent with that taken herein.<br />
The price, value of and income from any of the securities or financial instruments mentioned in this Document can fall as well<br />
as rise. The value of securities and financial instruments is subject to market conditions, volatility, exchange rate fluctuation<br />
and credit quality of any issuer that may have a positive or adverse effect on the price or income of such securities or<br />
financial instruments. Any forecasts on the economy, stock market, bond market or the economic trends of the markets are<br />
not necessarily a guide to future returns. You should understand that statements regarding future prospects may not be<br />
realized. Past performance should not be taken as an indication or guarantee of future performance, and no representation<br />
or warranty, express or implied, is made regarding future returns. As a result of the preceding, you may lose, as the case may<br />
be, the amount originally invested.<br />
None of ASIB, any entity within the <strong>Audi</strong> Saradar Group, any of their affiliates and/or their officers (including but not limited<br />
to their strategists, analysts and sales staff) shall be held liable for any loss or damage that may arise, directly or indirectly,<br />
from any use of the information contained in this Document nor for any decision or investment made on the basis of<br />
information contained herein.”<br />
6