The national shipping company of saudi arabia - Bank Audi
The national shipping company of saudi arabia - Bank Audi
The national shipping company of saudi arabia - Bank Audi

Create successful ePaper yourself
Turn your PDF publications into a flip-book with our unique Google optimized e-Paper software.
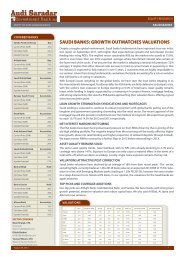
ENTITY OF AUDI SARADAR GROUP<br />
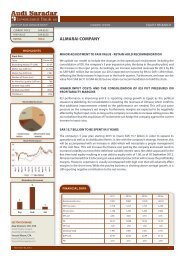
CURRENT PRICE SAR 12.20<br />
FAIR VALUE SAR 12.49<br />
RATING HOLD<br />
Stock Data<br />
December 30, 2011<br />
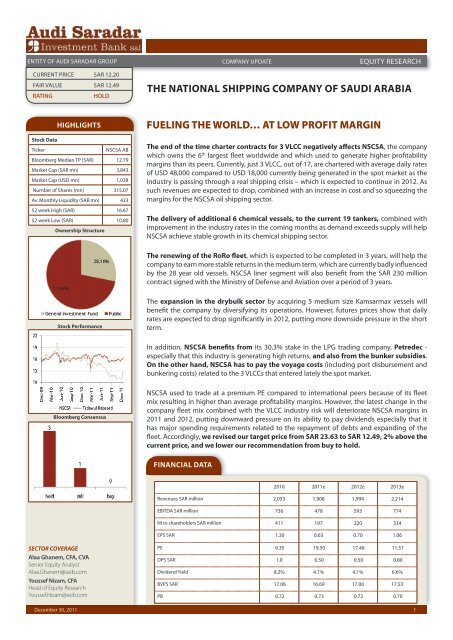
HIGHLIGHTS FUELING THE WORLD… AT LOW PROFIT MARGIN<br />
Ticker NSCSA AB<br />
Bloomberg Median TP (SAR) 12.79<br />
Market Cap (SAR mn) 3,843<br />
Market Cap (USD mn) 1,038<br />
Number <strong>of</strong> Shares (mn) 315.07<br />
Av. Monthly Liquidity (SAR mn) 423<br />
52 week High (SAR) 16.67<br />
52 week Low (SAR) 10.80<br />
Ownership Structure<br />
Stock Performance<br />
Bloomberg Consensus<br />
SECTOR COVERAGE<br />
Alaa Ghanem, CFA, CVA<br />
Senior Equity Analyst<br />
Alaa.Ghanem@asib.com<br />
Youssef Nizam, CFA<br />
Head <strong>of</strong> Equity Research<br />
Youssef.Nizam@asib.com<br />
EQUITY RESEARCH<br />
<strong>The</strong> end <strong>of</strong> the time charter contracts for 3 VLCC negatively affects NSCSA, the <strong>company</strong><br />
which owns the 6 th largest fleet worldwide and which used to generate higher pr<strong>of</strong>itability<br />
margins than its peers. Currently, just 3 VLCC, out <strong>of</strong> 17, are chartered with average daily rates<br />
<strong>of</strong> USD 48,000 compared to USD 18,000 currently being generated in the spot market as the<br />
industry is passing through a real <strong>shipping</strong> crisis – which is expected to continue in 2012. As<br />
such revenues are expected to drop, combined with an increase in cost and so squeezing the<br />
margins for the NSCSA oil <strong>shipping</strong> sector.<br />
<strong>The</strong> delivery <strong>of</strong> additional 6 chemical vessels, to the current 19 tankers, combined with<br />
improvement in the industry rates in the coming months as demand exceeds supply will help<br />
NSCSA achieve stable growth in its chemical <strong>shipping</strong> sector.<br />
<strong>The</strong> renewing <strong>of</strong> the RoRo fleet, which is expected to be completed in 3 years, will help the<br />
<strong>company</strong> to earn more stable returns in the medium term, which are currently badly influenced<br />
by the 28 year old vessels. NSCSA liner segment will also benefit from the SAR 230 million<br />
contract signed with the Ministry <strong>of</strong> Defense and Aviation over a period <strong>of</strong> 3 years.<br />
<strong>The</strong> expansion in the drybulk sector by acquiring 5 medium size Kamsarmax vessels will<br />
benefit the <strong>company</strong> by diversifying its operations. However, futures prices show that daily<br />
rates are expected to drop significantly in 2012, putting more downside pressure in the short<br />
term.<br />
In addition, NSCSA benefits from its 30.3% stake in the LPG trading <strong>company</strong>, Petredec -<br />
especially that this industry is generating high returns, and also from the bunker subsidies.<br />
On the other hand, NSCSA has to pay the voyage costs (including port disbursement and<br />
bunkering costs) related to the 3 VLCCs that entered lately the spot market.<br />
NSCSA used to trade at a premium PE compared to inter<strong>national</strong> peers because <strong>of</strong> its fleet<br />
mix resulting in higher than average pr<strong>of</strong>itability margins. However, the latest change in the<br />
<strong>company</strong> fleet mix combined with the VLCC industry risk will deteriorate NSCSA margins in<br />
2011 and 2012, putting downward pressure on its ability to pay dividends especially that it<br />
has major spending requirements related to the repayment <strong>of</strong> debts and expanding <strong>of</strong> the<br />
fleet. Accordingly, we revised our target price from SAR 23.63 to SAR 12.49, 2% above the<br />
current price, and we lower our recommendation from buy to hold.<br />
FINANCIAL DATA<br />
COMPANY UPDATE<br />
THE NATIONAL SHIPPING COMPANY OF SAUDI ARABIA<br />
2010 2011e 2012e 2013e<br />
Revenues SAR million 2,053 1,906 1,994 2,214<br />
EBITDA SAR million 736 478 593 774<br />
NI to shareholders SAR million 411 197 220 334<br />
EPS SAR 1.30 0.63 0.70 1.06<br />
PE 9.35 19.50 17.46 11.51<br />
DPS SAR 1.0 0.50 0.50 0.80<br />
Dividend Yield 8.2% 4.1% 4.1% 6.6%<br />
BVPS SAR 17.06 16.69 17.00 17.53<br />
PB 0.72 0.73 0.72 0.70<br />
1
MARIDIVE OIL & SERVICE COMPANY COMPANY UPDATE<br />
EQUITY RESEARCH<br />
TABLE OF CONTENTS<br />
Company Overview 2<br />
Industry Outlook 3<br />
VLCC Shipping Market 3<br />
Petrochemical Shipping Market 6<br />
Dry Bulk Shipping Market 7<br />
RoRo Shipping Market 8<br />
Financial Analysis 9<br />
Valuation 13<br />
SWOT Analysis 16<br />
Pro Forma Financials 17<br />
Major Changes 19<br />
December 30, 2011<br />
COMPANY OVERVIEW<br />
Its formation in 1979 by a Royal Decree reflects the necessity behind establishing <strong>The</strong> National<br />
Shipping Company <strong>of</strong> Saudi Arabia (NSCSA), the first <strong>national</strong> carrier in the Kingdom. <strong>The</strong> <strong>company</strong>,<br />
which originally operated container and general cargo vessels, has grown and added complementary<br />
business lines to become one <strong>of</strong> the biggest and most reputable <strong>shipping</strong> companies globally.<br />
Currently, NSCSA owns:<br />
1 17 VLCCs with a total capacity <strong>of</strong> about 5.26 million dwt and average age <strong>of</strong> 7 years, ranking as<br />
the 6 th largest VLCC owner in the world. 14 out <strong>of</strong> them operate in the spot market.<br />
1 19 chemical tankers, through its share in National Chemical Carrier (NCC), with a total capacity <strong>of</strong><br />
843,000 dwt and average age <strong>of</strong> 6 years. In 1990, NSCSA entered into an 80:20 joint venture with<br />
SABIC by establishing NCC, a <strong>company</strong> that is specialized in chemical transportation and it ranks<br />
as the 5 th largest globally. 6 additional vessels with capacity <strong>of</strong> about 300,000 dwt are expected<br />
to join the fleet till 2013.<br />
1 4 multi-purpose vessels, with a total capacity <strong>of</strong> 170,000 dwt and average age <strong>of</strong> 28 years. <strong>The</strong>se<br />
vessels will be replaced by other 6 smaller size <strong>of</strong> 26,000 dwt each in the coming 3 years.<br />
Chart 1: NSCSA Contracted Fleet<br />
Source: Company Presentation<br />
Moreover, the <strong>company</strong> plans to purchase 5 drybulk Kamsarmax vessels not older than 10 years,<br />
through its 60% JV with Arabian Agriculture Services Company (ARASCO).<br />
NSCSA has also a 30.3% stake in Petredec, a Bermuda-based inter<strong>national</strong> Liquefied Petroleum Gas<br />
(LPG) trading and ship owning <strong>company</strong>.<br />
<strong>The</strong> <strong>company</strong> owns a fully owned subsidiary, Mideast Ship Management Ltd., which renders<br />
pr<strong>of</strong>essional ship management services solely to its parent <strong>company</strong>. In addition, NSCSA is investing<br />
in on-land facilities by building a container service yard at the Jeddah Islamic Port to facilitate<br />
container storage and maintenance. <strong>The</strong> yard will also provide repair services. Furthermore, the<br />
<strong>company</strong> signed a contract for establishing the Arabian United Float Glass Company as a founding<br />
member. An investment <strong>of</strong> SAR 20 million was made for the ownership <strong>of</strong> fully paid 2 million shares,<br />
representing 10% <strong>of</strong> the share capital.<br />
2
THE NATIONAL SHIPPING COMPANY OF SAUDI ARABIA<br />
December 30, 2011<br />
INDUSTRY UPDATE<br />
VLCC SHIPPING MARKET<br />
COMPANY UPDATE EQUITY RESEARCH<br />
In our report on 4 January 2011, we mentioned that the VLCC market was oversupplied with a 23.5<br />
million dwt (12%) were expected to join the fleet in 2011. At the same time, we pointed that some<br />
positive signs could appear from:<br />
1 IMO double-hull regulation: 9.7% <strong>of</strong> the fleet will quit the market by 2015.<br />
1 Oil consumption to increase: by 1.5% in 2011, reflecting an expected increase <strong>of</strong> 3.3% in oil<br />
trade movement.<br />
1 Decreasing the speed: an option which will be used only after all other options were<br />
exhausted.<br />
Now, as 2011 is approaching toward its end, VLCC owners are decreasing the speed <strong>of</strong> their vessels,<br />
because <strong>of</strong> weaker industry fundamentals. Oil demand is now expected to grow at a slower pace<br />
than previously mentioned - IEA forecasts oil demand to grow by 0.7% in 2011 and 1.46% in 2012.<br />
Chart 2: Oil Trade Movement vs. Consumption<br />
Source: BP Statistical Review 2011, IEA, ASIB<br />
Two main reasons are behind the slowdown in the growth <strong>of</strong> the oil trade movements:<br />
1 Economic and financial problems: natural disaster in Japan (industries were not working at full<br />
capacity), financial crisis in Europe, lower GDP growth in USA (IMF expects US GDP growth to<br />
reach 1.53% and 1.78% in 2011 and 2012, respectively, compared to more than 3% in 2010).<br />
1 Natural gas effect: over the last 12 months, about 800,000 barrels <strong>of</strong> crude tanker demand per<br />
day has been displaced by the extra volumes <strong>of</strong> NGL production from gas processing in Qatar<br />
and the US, according to Dahlman Rose & Co. By the end <strong>of</strong> 2012, Qatari liquefied natural gas<br />
production is expected to displace as much as 2 million barrel/day equivalent to one VLCC<br />
crude cargo.<br />
On the other hand, VLCC fleet is continuing to increase in size. Currently, there are 592 active VLCC<br />
(8% higher than the start <strong>of</strong> the year), representing 179.6 million dwt, with 115 vessels, equivalent<br />
to 36.28 million dwt, that are expected to join the fleet in the coming few years.<br />
3
THE NATIONAL SHIPPING COMPANY OF SAUDI ARABIA<br />
Overcapacity is expected to continue<br />
in 2012<br />
December 30, 2011<br />
Chart 3: VLCC Current Fleet<br />
Source: Llyod’s List<br />
Chart 4: VLCC Order Book<br />
Source: Llyod’s List<br />
COMPANY UPDATE EQUITY RESEARCH<br />
With such high order book, representing more than 19% <strong>of</strong> the current fleet, it seems that the<br />
VLCC market is not going to improve in the coming year, especially that not many vessels are<br />
expected to quit the market, because <strong>of</strong> the following factors:<br />
1 Lay-up complications: for the move to be effective, owners would have to stay out <strong>of</strong> the<br />
market for an extended period <strong>of</strong> time even if rates move up in the interim. However, such<br />
drastic action to avoid trading in such a poor market leads to complications because laid up<br />
ships lose their oil major approvals, which are needed to attract oil companies seeking a vessel<br />
to ship a cargo.<br />
1 Floating storage: not expected, as long as oil future prices remain close or even lower than the<br />
current levels.<br />
1 Drop in the ship value: lower earnings are accompanied with lower ship value. While new VLCC<br />
value just dropped 5% from January 2011 to reach USD 99 million currently, a 5-year old VLCC<br />
value dropped by 34% to reach USD 56 million. And so companies with good financial position<br />
look at this as an opportunity to expand, in order to generate higher return on investment<br />
when rates recover.<br />
1 Scrapping value: <strong>of</strong> USD 20 million is much lower than the tanker value. However, a 16 year old<br />
double hulled VLCC, Atlantic Liberty, had been sold for demolition few weeks ago - the first<br />
deal <strong>of</strong> its kind which sends hopes to the market.<br />
As such, VLCC owners have no choices but decrease the vessel speed which has 3 effects:<br />
1 Increase utilization rate: by increasing the needed time to reach a destination. Since the<br />
beginning <strong>of</strong> 2011, the average speed <strong>of</strong> the VLCC fleet has decreased by more than 5%,<br />
according to Bloomberg.<br />
4
THE NATIONAL SHIPPING COMPANY OF SAUDI ARABIA<br />
Players with good financial position<br />
will benefit in the long term<br />
Political situation in the Arabian Gulf<br />
December 30, 2011<br />
COMPANY UPDATE EQUITY RESEARCH<br />
1 Save fuel cost: keeping everything else constant, the compounded effect <strong>of</strong> saving fuel and<br />
increasing utilization could increase owners’ income by a range <strong>of</strong> USD 2,000 to 11,000 per day,<br />
if speed drops by 1 knot.<br />
1 Hurt charter revenues: decreasing speed will benefit the owner but at the same time will hurt<br />
the charter. Assuming a VLCC that is transporting 2 million barrels <strong>of</strong> oil from KSA to Japan and<br />
assuming oil price <strong>of</strong> USD 90 per barrel. If VLCC speed drops by 1 knot, this will be reflected in a<br />
daily cost <strong>of</strong> USD 35,000, considering a 7% interest rate.<br />
In addition to these factors that affect the global VLCC sector as a whole, there are other factors<br />
that affect the players independently, including financial position and geographical position.<br />
As cash reserves are running out and owners face tough decisions, data showed that pricing <strong>of</strong><br />
<strong>shipping</strong> loans will remain high and average margins are increasing, which limits the number<br />
<strong>of</strong> new orders put in the market. Yet good quality owners with good relations with banks can<br />
obtain relatively lower costs <strong>of</strong> finance. According to the Lloyd’s List Tanker Perspectives survey,<br />
almost two thirds <strong>of</strong> the industry believes that up to 15% <strong>of</strong> tanker companies will not survive the<br />
downturn. So those who will survive will benefit later.<br />
In addition, there is a major factor that should be considered which is the Chinese effect. China,<br />
which imported 1.03 billion barrels <strong>of</strong> oil in 2006, imported 1.64 billion barrels in 2010 - CAGR <strong>of</strong><br />
9.7% - representing 10% <strong>of</strong> global seaborne oil trade. Currently, China refines around 8.5 million<br />
barrels per day (mbd), more than 85% <strong>of</strong> them are imported, and it plans to increase this capacity<br />
to 11 mbd in 2015 and 15 mbd in 2018. With domestic production expected to remain flat, we<br />
expect that additional 875 million barrel will be imported in 2015, about 700 million out <strong>of</strong> them<br />
through VLCCs. This will be reflected in increasing demand <strong>of</strong> 350 VLCC cargo shipments. <strong>The</strong><br />
question is who will benefit from this?<br />
<strong>The</strong> oil hungry country knows that if it does not possess the resources, at least it should possess<br />
the mean. China has increased its share from less than 3% <strong>of</strong> the global VLCC fleet in 2006 to<br />
more than 6.5% currently. It owns now 40 VLCC and additional 12 are on order. About 80% <strong>of</strong> the<br />
Chinese oil imports are brought in VLCC because it is the most efficient mean <strong>of</strong> importing oil from<br />
far producers. Historically, imports from the Middle East accounts for more than 50%, specifically<br />
53% in 2010. In 2006, about 17.6% <strong>of</strong> the VLCC shipments from Middle East were carried by<br />
Chinese owned vessels. In 2010 this number more than doubled to reach 38%. This increase comes<br />
at the expense <strong>of</strong> traditional inter<strong>national</strong> players, namely the European, whose market share<br />
dropped from 34% in 2006 to 16% in 2010.<br />
As such, even though Chinese imports are expected to grow considerably in the coming few years,<br />
domestic VLCC fleet will grow also and so local players will benefit the most, especially that China<br />
plans to ship 50% <strong>of</strong> its needs via domestic owned vessels.<br />
One last factor that highly affects the VLCC earnings is the political situation in the Arabian Gulf.<br />
Some newspapers wrote lately that it is the legal right for the Islamic Republic in Iran to close<br />
the Strait <strong>of</strong> Hormuz. Such news came after the declaration <strong>of</strong> some members <strong>of</strong> the Iranian<br />
parliament that the country will close this route if it is attacked. Around 40% <strong>of</strong> the global oil<br />
exports are shipped through this route. If there is any room <strong>of</strong> chance that such announcement<br />
will start to be materialized, VLCC rates will increase sharply.<br />
In brief:<br />
1 Oil traded movements are expected to increase by 2.4% in 2012.<br />
1 Order books show that additional capacity representing 9% <strong>of</strong> the current fleet is expected to<br />
be added in 2012.<br />
1 Options including scrapping, laying-up and floating storage will have minimal effect on fleet<br />
growth.<br />
1 Decreasing the speed, which will benefit the owner but could hurt the charter, will not absorb<br />
oversupply.<br />
1 China is setting to be a key player in the VLCC market, especially in the Middle East route.<br />
5
THE NATIONAL SHIPPING COMPANY OF SAUDI ARABIA<br />
Stable demand combined with<br />
moderate supply<br />
December 30, 2011<br />
COMPANY UPDATE EQUITY RESEARCH<br />
2011 is a crisis year for the VLCC <strong>shipping</strong> market and according to current figures, 2012 will<br />
continue to be a difficult year. Data from brokers are showing a decreasing trend in the chartering<br />
rates. Some vessels were currently chartered for about USD 20,000 per day for 2-3 years, compared<br />
to about USD 30,000 at the beginning <strong>of</strong> the year. Operating costs are about USD 10,000 – 11,000<br />
per day, excluding financing costs. If we account to the latest, cost could rise to about USD 26,000<br />
per day. Rates in the spot market barely cover operating costs, and during some periods in the year<br />
rates were below costs, putting serious question marks on the ability <strong>of</strong> some tanker owners to<br />
survive. During the last months, some US tanker companies, as Omega Navigation, Marco Polo and<br />
General Maritime, seek protection from their creditors by filing for Chapter 11 bankruptcy. Others<br />
are creating pools to jointly manage their VLCC fleet, a way that could decrease competition, share<br />
cost and increase operational power, which could increase income. Currently, 4 tanker owners,<br />
Mitsui OSK Lines’ Phoenix Tankers, Maersk Tankers, Samco Shipholding and Ocean Tankers, are<br />
forming a pool <strong>of</strong> 50 VLCCs to start operations by the end <strong>of</strong> 2012.<br />
CHEMICAL-OIL SHIPPING MARKET<br />
<strong>The</strong> crude oil and petrochemical <strong>shipping</strong> markets moved in opposite directions in 2011 and this<br />
trend is expected to continue in the future, as petrochemical fundamentals are better.<br />
Currently, there are 1,486 vessels active in the market with a total capacity <strong>of</strong> 48.03 million dwt. 49<br />
vessels with total capacity <strong>of</strong> 1.56 million dwt are expected to join the fleet in 2012, representing<br />
an increase <strong>of</strong> 3.2%.<br />
Chart 5: Oil-Chemical Current Fleet<br />
Source: Lloyd’s List<br />
Chart 6: Oil-Chemical Order Book<br />
Source: Lloyd’s List<br />
Demand for chemical vessels is increasing considerably, especially from the US to Asia because <strong>of</strong><br />
the peak garment production season which usually occurs in the fourth quarter. Rates for small size<br />
(5,000 dwt) vessels, for example, increased 60% from October levels to reach USD 113 per tone last<br />
week. In the coming few years, global demand is expected to grow at a pace <strong>of</strong> more than 4%.<br />
6
THE NATIONAL SHIPPING COMPANY OF SAUDI ARABIA<br />
December 30, 2011<br />
DRY BULK SHIPPING MARKET<br />
COMPANY UPDATE EQUITY RESEARCH<br />
As <strong>of</strong> December 2011, 8614 dry bulk vessels, with a capacity <strong>of</strong> 605.7 million dwt, were active in the<br />
market. Additional 200 million dwt are expected to enter the market till 2013.<br />
Chart 7: Dry Bulk Fleet Breakdown by Age<br />
Source: Lloyd’s List<br />
Chart 8: Dry Bulk Fleet Breakdown by Type<br />
Source: Lloyd’s List<br />
Chart 9: Dry Bulk Order Book by Size<br />
Source: Lloyd’s List<br />
Shipyards are decreasing the contracting prices in order to attract ship owners to place orders as<br />
their order books after 2012 look increasingly bare. A newbuild small and medium size vessel is<br />
selling at a 10% premium than a five year old vessel on the same category. <strong>The</strong> only exception is the<br />
larger Capsize which is selling at a 30% premium.<br />
Currently, rates do not cover operating cost for some subsectors and futures prices show that that<br />
2012 rates are expected to drop significantly (about 16%) across all subsectors, as large capacity<br />
7
THE NATIONAL SHIPPING COMPANY OF SAUDI ARABIA<br />
December 30, 2011<br />
COMPANY UPDATE EQUITY RESEARCH<br />
(128 million dwt) is expected to join the fleet in 2012. If newbuilding prices remain low, market is<br />
afraid that the number <strong>of</strong> vessels ordered will continue to show high increase after 2012.<br />
RORO SHIPPING MARKET<br />
As <strong>of</strong> December 2011, 1670 RoRo vessels, representing 9.8 million dwt, exist in the market. This fleet<br />
is expected to grow by 3.4% in 2012.<br />
Chart 10: RoRo Fleet<br />
Source: Lloyd’s List<br />
Chart 11: RoRo Order Book<br />
Source: Lloyd’s List<br />
48% <strong>of</strong> the RoRo vessels are above 25 year old, these vessels are expected to exit the market in the<br />
coming few years – just small part <strong>of</strong> them is expected to enter the market as shown by current<br />
order books.<br />
Demand, on the other hand, depends mainly on the volume <strong>of</strong> imports which is expected to increase<br />
by 5.4% and 6.3% in 2012 and 2013 respectively, according to latest IMF forecasts.<br />
8
THE NATIONAL SHIPPING COMPANY OF SAUDI ARABIA<br />
December 30, 2011<br />
FINANCIAL ANALYSIS<br />
Table 1: Income statement<br />
COMPANY UPDATE EQUITY RESEARCH<br />
2010 9 months 2011<br />
SAR million YoY Change SAR million YoY Change<br />
Oil 1,445.6 39% 919.2 -19%<br />
Petrochemicals 269.9 -12% 238.8 19%<br />
Liner 337.5 3% 265.5 7%<br />
Total operating revenues 2,053.0 23% 1,423.5 -10%<br />
Oil (1,074.1) 37% (877.7) 10%<br />
Petrochemicals (154.1) -3% (140.7) 24%<br />
Liner (375.5) 2% (269.1) -5%<br />
Total cost <strong>of</strong> sales (1,603.7) 22% (1,287.6) 8%<br />
Total gross pr<strong>of</strong>it 449.3 23% 135.9 -65%<br />
Gross margin 21.9% 9.5%<br />
G&A expenses (102.2) 9% (80.0) 12%<br />
Share <strong>of</strong> income from affiliate 36.9 -56% 56.3 94%<br />
Other income 25.1 -60% 16.0 -27%<br />
Finance cost (52.2) -34% (38.7) -1%<br />
EBIT 409.1 -2% 128.3 -65%<br />
EBIT margin 19.9% 9.0%<br />
EBITDA 736.2 3% 386.0 -37%<br />
EBITDA margin 35.9% 27.1%<br />
Fuel and bunker subsidy 108.2 30% 120.7 65%<br />
Zakat (34.6) 6% (16.7) -36%<br />
Tax (1.1) -16% (3.2) 128%<br />
NI 429.4 10% 190.3 -49%<br />
Minority interest (18.3) -30% (15.9) 10%<br />
NI to shareholders 411.1 13% 174.5 -51%<br />
Net margin 20.0% 12.4%<br />
1 During the last months, the charter contracts for 3 VLCC ended. This was reflected in lower<br />
revenues for the oil sector, combined with additional costs. <strong>The</strong> <strong>company</strong> generated a gross loss<br />
<strong>of</strong> SAR 11 million in Q3 11 for the oil <strong>shipping</strong> sector. Currently, 14 VLCC (representing 82% <strong>of</strong> the<br />
fleet) are operating in the spot market bearing the risk <strong>of</strong> this segment.<br />
Table 2: Oil Gross Margin<br />
2008 2009 2010 9 months 2011<br />
Peers Average 24.2% 12.7% 16.6% 8.2%<br />
NSCSA oil sector 50.8% 24.8% 25.7% 4.5%<br />
<strong>The</strong> current fleet mix negatively affects the <strong>company</strong> pr<strong>of</strong>itability margins compared to its historical<br />
and also peers margins, as shown by table 2. <strong>The</strong> remaining 3 chartered VLCCs generated average<br />
daily revenues <strong>of</strong> about USD 48,000 per day compared to current daily spot rates <strong>of</strong> less than USD<br />
18,000.<br />
9
THE NATIONAL SHIPPING COMPANY OF SAUDI ARABIA<br />
December 30, 2011<br />
COMPANY UPDATE EQUITY RESEARCH<br />
While the contracts <strong>of</strong> these 3 vessels end in 2013 and 2014, the <strong>company</strong> replied when asked that it<br />
will consider time chartering more VLCC just if there are attractive opportunities, without specifying<br />
which rates are considered attractive. Important to note that lately some global VLCCs were time<br />
chartered for 2-3 years at rates <strong>of</strong> about 20,000 USD/day. Besides, the <strong>company</strong> has no plans to<br />
operate some VLCCs in a pool.<br />
1 <strong>The</strong> <strong>company</strong> received, through its 80% subsidiary NCC, 5 chemical vessels during the first<br />
9 months <strong>of</strong> 2011. This was reflected in a 19% increase <strong>of</strong> revenues. This segment is the best<br />
performing one in terms <strong>of</strong> pr<strong>of</strong>itability and stability.<br />
Table 3: Chemical Gross Margin<br />
2008 2009 2010 9 months 2011<br />
Peers Average 22.5% 18.0% 15.9% 15.8%<br />
NSCSA chemical sector 16.8% 48.2% 42.9% 41.2%<br />
NCC has 7 tankers in time chartered, and 3 in bareboat – a mix that assure higher than average<br />
gross margins. In Q1 09, NCC signed agreements with Odfjell to charter 3 vessels under bareboat<br />
arrangement for a period <strong>of</strong> 10 years with purchase option after 3 years. When contacted, NSCSA<br />
mentioned that it cannot disclose now if this option will be exercised in Q1 12 . <strong>The</strong> <strong>company</strong> also<br />
received 1 vessel in October 2011, 5 are expected to be received in 2012, in addition to a large<br />
75,000 dwt vessel in 2013. Upon delivery, NCC, which has the 5 th largest global fleet with a capacity<br />
<strong>of</strong> 843,000 dwt will expand its capacity to reach 1.14 million dwt.<br />
1 <strong>The</strong> bulk segment consists <strong>of</strong> 4 multipurpose RoRo vessels with an average age <strong>of</strong> 28 years and<br />
so the performance <strong>of</strong> this sector is showing high volatility. NSCSA is in the process <strong>of</strong> renewing<br />
this fleet – 6 small size RoCon vessels are expected to be delivered during the coming 3 years in<br />
order to replace the current fleet. In addition, the <strong>company</strong> signed a SAR 230 million contract<br />
with the Ministry <strong>of</strong> Defense and Aviation (MODA), effective in September 2011 and lasts for 3<br />
years.<br />
1 Share <strong>of</strong> income from affiliates includes the contribution <strong>of</strong> Peredec, the LPG trading and<br />
<strong>shipping</strong> 30.3% owned affiliate and so the <strong>company</strong> is benefiting from the improvement in the<br />
LPG sector.<br />
10
THE NATIONAL SHIPPING COMPANY OF SAUDI ARABIA<br />
December 30, 2011<br />
Table 4: Balance Sheet<br />
COMPANY UPDATE EQUITY RESEARCH<br />
2010 9 months 2011<br />
SAR million YoY Change SAR million Change/2010<br />
Cash in hand & at banks 109 14% 101 -7%<br />
Investment in government bonds & STD 1,013 44% 362 -64%<br />
Trade receivable & other debit balances 167 -19% 222 33%<br />
Others 285 28% 371 30%<br />
Current assets 1,575 28% 1,056 -33%<br />
Bareboat lease receivable, net 412 -2% 407 -1%<br />
Investments in affiliates & others 452 51% 501 11%<br />
Fixed assets 6,410 -5% 7,125 11%<br />
Ships under construction 1,009 -28% 1,160 15%<br />
Others 101 -56% 126 25%<br />
Total non-current assets 8,384 -8% 9,318 11%<br />
Total assets 9,959 -4% 10,374 4%<br />
Accounts payable & other credit balances 248 10% 251 1%<br />
Current portion <strong>of</strong> LT loans 325 43% 465 43%<br />
Provision for zakat & tax 129 8% 126 -2%<br />
Others 31 2% 31 1%<br />
Current liabilities 733 22% 874 19%<br />
Long term loans 3,819 -16% 4,238 11%<br />
Others 33 -5% 28 -16%<br />
Long term liabilities 3,852 -16% 4,266 11%<br />
Total liabilities 4,585 -11% 5,140 12%<br />
Total shareholders' equity 5,086 2% 4,950 -3%<br />
Minority interest 289 52% 285 -1%<br />
Total equity 5,374 4% 5,235 -3%<br />
1 <strong>The</strong> <strong>company</strong> has major capital expenditure over the next years because <strong>of</strong> its fleet expansion.<br />
Table 5: Cost <strong>of</strong> Fleet Expansion<br />
SAR million 2012e 2013e 2014e<br />
Petrochemical Cost 975 247 -<br />
RoCon Cost 257 1,029 257<br />
Total 1,232 1,276 257<br />
Important to note that 80% <strong>of</strong> the petrochemical cost will be hold by NSCSA.<br />
In addition, NSCSA has established a 60% drybulk JV with ARASCO. <strong>The</strong> new <strong>company</strong> plans to buy<br />
5 Kamsarmax vessels not older than 10 years. Currently, the price <strong>of</strong> a 5 year old Kamsarmax is about<br />
USD 27 million but the availability <strong>of</strong> these vessels in the second market is rare. Another option is to<br />
order new Kamsarmax vessels. <strong>The</strong> <strong>company</strong> may charter vessels to start operations in the coming<br />
months if this option is chosen.<br />
11
THE NATIONAL SHIPPING COMPANY OF SAUDI ARABIA<br />
Ability to finance the fleet expansion<br />
December 30, 2011<br />
COMPANY UPDATE EQUITY RESEARCH<br />
Moreover, the <strong>company</strong> will replace the current RoRo fleet with assets book value <strong>of</strong> about SAR 415<br />
million. Any selling price that differs from the vessels book value will be reflected in gain or loss on<br />
sale in the <strong>company</strong>’s financials.<br />
1 <strong>The</strong> <strong>company</strong> paid about SAR 1.2 billion for the vessels under construction, representing 40% <strong>of</strong><br />
total contracted value.<br />
1 20% <strong>of</strong> the RoCon and petrochemical vessels are financed internally by the <strong>company</strong>. While<br />
the remaining amount is financed through debt. Considering also the Kamsarmax expansion,<br />
NSCSA has obligations <strong>of</strong> about SAR 3billion during the coming 4 years, accounting for the<br />
ownership stake. Around SAR 600 million should be generated internally.<br />
1 Currently, the <strong>company</strong> has cash <strong>of</strong> SAR 100 million. Other quick assets account for more than<br />
SAR 600 million. Based on our forecasts, the <strong>company</strong> is able to generate total cash flow from<br />
operations <strong>of</strong> SAR 2 billion for the period from 2012 to 2014. On the other hand, we expect that<br />
the <strong>company</strong> will pay dividend <strong>of</strong> more than SAR 530 million during this period, in addition to<br />
debt repayments <strong>of</strong> SAR 1.13 billion from 2012 to 2014.<br />
1 In addition, there is the cash expected to be received from the sale <strong>of</strong> the RoRo vessels, but<br />
which is difficult to be determined yet as it depends on the steel price at that time. As such, the<br />
<strong>company</strong> should not have difficulties to generate the needed cash to finance its plan.<br />
1 <strong>The</strong> current NSCSA debt-to-equity ratio is 0.90, lower than the current industry average <strong>of</strong> 1.36,<br />
and also lower than the industry average <strong>of</strong> 1.03 in 2005 and 2006 – the time when banks heavily<br />
financed orders to buy vessels. Despite the <strong>shipping</strong> outlook was totally different at that time<br />
and earnings were expected to increase, NSCSA secured contracts to utilize some <strong>of</strong> the to-bedelivered<br />
vessels. Furthermore, NSCSA signed Murabaha financing agreement to buy 2 RoCon<br />
vessels. Combining these factors with the good financial position <strong>of</strong> the <strong>company</strong>, NSCSA should<br />
not find difficulties when securing loans to finance the fleet expansion.<br />
1 Being able to expand its fleet and also generate positive operating cash flow during the <strong>shipping</strong><br />
crisis will put NSCSA in a favorite position compared to peers and allow it to be one <strong>of</strong> the most<br />
beneficial players in the long term.<br />
1 Despite that NSCSA pr<strong>of</strong>itability margins are dropping since their peak in 2008, the <strong>company</strong><br />
remains able to generate ROA higher than its peers because it has diversified operations (oil,<br />
chemical, liner, LPG) and the bunker subsidies it receives.<br />
Table 6: Return on Assets<br />
2008 2009 2010 2011e<br />
Peers Average 4.5% -0.7% 1.0% -1.2%*<br />
NSCSA 8.4% 3.6% 4.0% 1.9%<br />
*annualized figure for 9 months 2011<br />
12
THE NATIONAL SHIPPING COMPANY OF SAUDI ARABIA<br />
December 30, 2011<br />
VALUATION<br />
DIVIDEND DISCOUNT MODEL (DDM)<br />
COMPANY UPDATE EQUITY RESEARCH<br />
A risk-free rate <strong>of</strong> 2.07% and an expected market return <strong>of</strong> 14.25% were used in our model. In<br />
addition, a beta <strong>of</strong> 0.97, and a terminal growth <strong>of</strong> 3% were considered. <strong>The</strong>refore, an equity risk<br />
premium <strong>of</strong> 13.27% was derived. A fair value <strong>of</strong> SAR 12.37 was obtained.<br />
Table 7: Dividend Discount Model<br />
2011 E 2012 E 2013 E 2014 E 2015 E<br />
Net Income SAR million 197 220 334 426 559<br />
Number <strong>of</strong> Shares Outstanding million 315.07<br />
Earnings per Share SAR 0.63 0.70 1.06 1.35 1.77<br />
Dividends per Share SAR 0.50 0.50 0.80 1.10 1.50<br />
Present Value <strong>of</strong> Dividends per Share SAR 0.50 0.44 0.62 0.76 0.91<br />
Present Value <strong>of</strong> Terminal Value SAR 9.14<br />
Cost <strong>of</strong> Equity 13.27%<br />
Terminal Growth Rate 3.00%<br />
Fair Value SAR 12.37<br />
FREE CASH FLOW TO EQUITY (FCFE) MODEL<br />
We also conducted a FCFE valuation. <strong>The</strong> same equity risk premium assumptions as for DDM<br />
were used. However, the terminal value in the FCFE model depends on several key assumptions<br />
and significantly varies according to them. Any change in these assumptions, including capital<br />
expenditure and debt repayment, highly affects the <strong>company</strong> fair value. For this reason, we used<br />
relative valuation in order to validate the fundamental process. In this context, we considered the<br />
average historical PE ratio for the biggest global players. This PE <strong>of</strong> 10.07 is used to obtain NSCSA<br />
terminal value. Applying this value in a FCFE model, we get a target price <strong>of</strong> SAR 14.59.<br />
Table 8: FCFE Valuation<br />
2011 E 2012 E 2013 E 2014 E 2015 E<br />
Net Income SAR million 197 220 334 426 559<br />
Non-Cash Charges SAR million 341 398 438 434 414<br />
Fixed Capital Investment SAR million 936 754 720 356 0<br />
Change in Working Capital SAR million -30 26 12 9 -10<br />
Net Borrowings SAR million 578 484 267 -244 -539<br />
Free Cash Flow to the Equity SAR million 210 323 307 252 444<br />
Present Value <strong>of</strong> FCFE SAR million 210 285 240 173 270<br />
Terminal PE 10.07<br />
Terminal Value SAR 17.86<br />
Present Value <strong>of</strong> Terminal Value SAR 10.85<br />
Cost <strong>of</strong> Equity 13.27%<br />
Shares Outstanding million 315.07<br />
Fair Value SAR 14.59<br />
13
THE NATIONAL SHIPPING COMPANY OF SAUDI ARABIA<br />
December 30, 2011<br />
ENTERPRISE VALUE<br />
COMPANY UPDATE EQUITY RESEARCH<br />
We also valued NSCSA using the EV/EBITDA method. We applied the current average ratio for the<br />
global players <strong>of</strong> 13.20 to the <strong>company</strong> 2012 EBITDA. A fair value <strong>of</strong> SAR 8.54 was derived.<br />
Table 9: EV/EBITDA valuation<br />
Current 2012e<br />
EBITDA SAR million 593<br />
Terminal EV/EBITDA 13.20<br />
EV SAR million 7,824<br />
WACC 8.46%<br />
PV <strong>of</strong> EV SAR million 7,214<br />
MV <strong>of</strong> preferred stock SAR million -<br />
MV debt SAR million 4,703<br />
Minority interest SAR million 285<br />
Cash & investments SAR million 463<br />
MV common stocks SAR million 2,690<br />
Shares million 315.07<br />
Price SAR 8.54<br />
FAIR VALUE<br />
A certain weight was assigned to each method and so a fair value <strong>of</strong> SAR 12.49 was derived, 2%<br />
above the current price <strong>of</strong> SAR 12.20. <strong>The</strong>refore, we recommend to hold the stock.<br />
Table 10: Fair Value<br />
Price SAR Weight Price<br />
DDM 12.37 40% 4.95<br />
FCFE 14.59 40% 5.83<br />
EV/EBITDA 8.54 20% 1.71<br />
Fair Value 12.49<br />
14
THE NATIONAL SHIPPING COMPANY OF SAUDI ARABIA<br />
December 30, 2011<br />
RECOMMENDATION<br />
COMPANY UPDATE EQUITY RESEARCH<br />
During 2012, NSCSA will be negatively affected by the low spot rates in the VLCC <strong>shipping</strong> sector, but<br />
partly replaced by the bunker subsidies. <strong>The</strong> petrochemical fleet, on the other hand, will positively<br />
contribute to the <strong>company</strong>’s performance. <strong>The</strong> liner and bulk sectors are expected to generate<br />
pr<strong>of</strong>its in 2012, but will not significantly boost the net income.<br />
NSCSA is trading at trailing PE <strong>of</strong> 16.82 higher than the <strong>company</strong> historical average <strong>of</strong> 15.07, and<br />
PE <strong>of</strong> 19.50 and 17.46 are expected for 2011 and 2012, respectively. Furthermore, the <strong>company</strong><br />
pr<strong>of</strong>itability margins are expected to drop in 2011 and 2012, negatively affected by the industry and<br />
also the end <strong>of</strong> the time chartered contracts <strong>of</strong> 3 VLCC that used to generate higher revenues than<br />
the current spot rates. This is reflected in a drop <strong>of</strong> ROAA from 4.0% in 2010 (and averaged 6.1% in<br />
the last 5 years) to an expected ROAA <strong>of</strong> 1.9% and 2.1% in 2011 and 2012, respectively.<br />
However, despite all the difficulties that are expected to be faced by the <strong>company</strong> in the short term<br />
which will put downside pressure on its share price, NSCSA still enjoys good financial position and<br />
it is expected to generate stable earnings in 2012. Going forward, NSCSA is expected to restore its<br />
growth, which will position it to be one <strong>of</strong> the main beneficiaries <strong>of</strong> any VLCC industry recovery in<br />
the medium term.<br />
RISKS TO OUR FORECAST<br />
1 Other than expected industry recovery: because <strong>of</strong> political instability or even unexpected<br />
demand from China during some periods <strong>of</strong> time.<br />
1 Other than forecasted bunker subsidies: as NSCSA receives bunker subsidies only for transporting<br />
oil from the Arabian Gulf.<br />
1 Date and amount <strong>of</strong> proceeds from the selling <strong>of</strong> the RoRo vessels.<br />
15
THE NATIONAL SHIPPING COMPANY OF SAUDI ARABIA<br />
December 30, 2011<br />
SWOT ANALYSIS<br />
STRENGTHS<br />
1 Diversified fleet<br />
1 Young fleet<br />
1 Healthy financial position<br />
WEAKNESSES<br />
1 VLCC industry risk<br />
1 High fixed cost<br />
1 Deteriorating pr<strong>of</strong>itability margins<br />
OPPORTUNITIES<br />
THREATS<br />
1 Delivery delay<br />
1 Political instability<br />
COMPANY UPDATE EQUITY RESEARCH<br />
1 Ability to secure contracts as that with MODA<br />
1 Benefit from the drop <strong>of</strong> the prices <strong>of</strong> Kamsarmax to expand its fleet<br />
1 Good relationships with 3rd parties<br />
1 Using <strong>of</strong> alternative sources <strong>of</strong> energy which decreases oil demand<br />
16
THE NATIONAL SHIPPING COMPANY OF SAUDI ARABIA<br />
December 30, 2011<br />
FORECASTS<br />
Table 11: Income Statement<br />
COMPANY UPDATE EQUITY RESEARCH<br />
SAR million 2009 2010 2011e 2012e 2013e 2014e 2015e<br />
Oil 1,041 1,446 1,220 1,245 1,357 1,494 1,651<br />
Petrochemicals 307 270 339 393 463 498 518<br />
Liner and Bulk 327 338 347 356 393 483 546<br />
Total operating revenues 1,675 2,053 1,906 1,994 2,214 2,476 2,714<br />
Oil (782) (1,074) (1,184) (1,196) (1,214) (1,259) (1,298)<br />
Petrochemicals (159) (154) (201) (233) (272) (290) (301)<br />
Liner and Bulk (368) (376) (360) (334) (353) (405) (442)<br />
Total operating expenses (1,310) (1,604) (1,745) (1,763) (1,839) (1,954) (2,041)<br />
Oil 259 371 36 49 143 235 353<br />
Petrochemicals 148 116 138 160 191 209 217<br />
Liner and Bulk (41) (38) (13) 22 40 78 104<br />
Total gross pr<strong>of</strong>it 365 449 161 232 375 522 674<br />
G&A expenses (94) (102) (107) (112) (115) (118) (125)<br />
Share <strong>of</strong> income from affiliate 85 37 64 57 59 55 53<br />
Other income 63 25 19 18 17 16 19<br />
Finance cost (79) (52) (52) (62) (67) (65) (60)<br />
EBIT 419 409 137 195 336 475 621<br />
EBITDA 715 736 478 593 774 909 1,035<br />
Fuel and bunker subsidy 83 108 159 140 130 95 90<br />
Zakat (32) (35) (22) (21) (26) (33) (40)<br />
Tax (1) (1) (3) (5) (5) (6) (9)<br />
NI 389 429 219 246 367 465 602<br />
Minority interest (26) (18) (22) (26) (33) (40) (43)<br />
NI to shareholders 363 411 197 220 334 426 559<br />
17
THE NATIONAL SHIPPING COMPANY OF SAUDI ARABIA<br />
December 30, 2011<br />
Table 12: Balance Sheet<br />
COMPANY UPDATE EQUITY RESEARCH<br />
SAR million 2009 2010 2011e 2012e 2013e 2014e 2015e<br />
Cash in hand & at banks 96 109 110 140 166 165 181<br />
Investment in government bonds & STD 706 1,013 380 429 490 508 532<br />
Trade receivable & other debit balances 206 167 211 221 234 241 235<br />
Others 223 285 360 355 350 360 362<br />
Current assets 1,230 1,575 1,061 1,145 1,240 1,274 1,310<br />
Bareboat lease receivable, net 419 412 405 395 365 340 325<br />
Investments in affiliates & others 299 452 509 566 625 680 733<br />
Fixed assets 6,761 6,410 7,237 8,164 8,888 8,809 8,395<br />
Ships under construction 1,403 1,009 1,102 609 197 125 125<br />
Others 231 101 114 113 115 118 120<br />
Total non-current assets 9,113 8,384 9,366 9,846 10,189 0,072 9,698<br />
Total assets 10,343 9,959 10,427 10,991 11,429 11,346 11,008<br />
Accounts payable & other credits 225 248 252 240 247 252 258<br />
Current portion <strong>of</strong> LT loans 227 325 467 514 541 517 463<br />
Provision for zakat & tax 120 129 135 128 114 115 115<br />
Others 30 31 30 28 31 33 33<br />
Current liabilities 602 733 884 910 933 917 869<br />
Long term loans 4,536 3,819 4,254 4,690 4,931 4,711 4,226<br />
Others 35 33 29 34 43 46 46<br />
Long term liabilities 4,571 3,852 4,283 4,724 4,974 4,757 4,272<br />
Total liabilities 5,173 4,585 5,167 5,635 5,907 5,674 5,141<br />
Total shareholders' equity 4,981 5,086 4,969 5,033 5,211 5,385 5,595<br />
Minority interest 189 289 291 323 311 287 272<br />
Total equity 5,170 5,374 5,260 5,356 5,522 5,672 5,867<br />
18
THE NATIONAL SHIPPING COMPANY OF SAUDI ARABIA<br />
December 30, 2011<br />
MAJOR CHANGES<br />
Changes to the Company Plan<br />
1 Change in the VLCC fleet mix.<br />
1 Renewing <strong>of</strong> the RoRo fleet.<br />
1 Releasing <strong>of</strong> the plan for the JV with ARASCO.<br />
Changes to Our Model<br />
COMPANY UPDATE EQUITY RESEARCH<br />
1 We increased our discount factor from 10.95% to 13.27%, due to higher expected risk in the<br />
market.<br />
1 We lower our expected DPS because <strong>of</strong> lower expected revenues and pr<strong>of</strong>itability margins.<br />
1 We changed the mix <strong>of</strong> competitors used in order to better reflect the case <strong>of</strong> NSCSA – we<br />
included the biggest listed <strong>shipping</strong> companies that have closer fleet mix to that <strong>of</strong> NSCSA.<br />
Table 13: NSCSA Peers Historical Average<br />
PE<br />
Mitsui OSK Lines 9.22<br />
Overseas Shipholding 6.17<br />
EuroNav 11.97<br />
Teekay 7.89<br />
Torm A/S 12.54<br />
Iino Kaium Kaisha 13.98<br />
MISC 8.72<br />
Average 10.07<br />
19
THE NATIONAL SHIPPING COMPANY OF SAUDI ARABIA<br />
December 30, 2011<br />
CHANGES TO OUR FORECAST<br />
Table 14: Income Statement<br />
SAR<br />
million<br />
COMPANY UPDATE EQUITY RESEARCH<br />
2011e 2012e 2013e 2014e<br />
%<br />
change<br />
SAR<br />
million<br />
%<br />
change<br />
SAR<br />
million<br />
%<br />
change<br />
SAR<br />
million<br />
%<br />
change<br />
Oil 1,220 -24% 1,245 -27% 1,357 -21% 1,494 -17%<br />
Petrochemicals 339 0% 393 -12% 463 -21% 498 -26%<br />
Liner and Bulk 347 -7% 356 -16% 393 -18% 483 -12%<br />
Total revenues 1,906 -18% 1,994 -23% 2,214 -21% 2,476 -18%<br />
Oil (1,184) 5% (1,196) 2% (1,214) 1% (1,259) 1%<br />
Petrochemicals (201) -10% (233) -30% (272) -38% (290) -44%<br />
Liner and Bulk (360) -9% (334) -13% (353) -16% (405) -10%<br />
Total expenses (1,745) 0% (1,763) -7% (1,839) -11% (1,954) -12%<br />
Oil 36 -92% 49 -91% 143 -73% 235 -58%<br />
Petrochemicals 138 20% 160 42% 191 33% 209 31%<br />
Liner and Bulk (13) -51% 22 -47% 40 -36% 78 -22%<br />
Total gross pr<strong>of</strong>it 161 -72% 232 -66% 375 -49% 522 -36%<br />
G&A expenses (107) 6% (112) 9% (115) 7% (118) 6%<br />
EBITDA 478 -46% 593 -43% 774 -30% 909 -24%<br />
NI 219 -55% 246 -57% 367 -41% 465 -33%<br />
Minority interest (22) -11% (26) -13% (33) -7% (40) -8%<br />
NI to shareholders 197 -57% 220 -59% 334 -43% 426 -35%<br />
20
THE NATIONAL SHIPPING COMPANY OF SAUDI ARABIA<br />
December 30, 2011<br />
Table 15: Balance Sheet<br />
COMPANY UPDATE EQUITY RESEARCH<br />
SAR<br />
million<br />
2011e 2012e 2013e 2014e<br />
%<br />
change<br />
SAR<br />
million<br />
%<br />
change<br />
SAR<br />
million<br />
%<br />
change<br />
SAR<br />
million<br />
%<br />
change<br />
Cash in hand & at banks 110 -11% 140 14% 166 77% 165 46%<br />
Investment in government<br />
bonds & STD<br />
Trade receivable & other<br />
debit balances<br />
380 -49% 429 -46% 490 -41% 508 -41%<br />
211 0% 221 0% 234 0% 241 0%<br />
Others 360 31% 355 19% 350 13% 360 11%<br />
Current assets 1,061 -21% 1,145 -20% 1,240 -16% 1,274 -17%<br />
Bareboat lease receivable,<br />
net<br />
Investments in affiliates &<br />
others<br />
405 -5% 395 -8% 365 -11% 340 -22%<br />
509 27% 566 29% 625 29% 680 35%<br />
Fixed assets 7,237 5% 8,164 8% 8,888 14% 8,809 16%<br />
Ships under construction 1,102 59% 609 94% 197 76% 125 23%<br />
Others 114 -2% 113 -12% 115 -19% 118 -22%<br />
Total non-current assets 9,366 10% 9,846 11% 10,189 14% 10,072 15%<br />
Total assets 10,427 6% 10,991 7% 11,429 10% 11,346 10%<br />
Accounts payable & other<br />
credit balances<br />
252 9% 240 0% 247 0% 252 0%<br />
Current portion <strong>of</strong> LT loans 467 94% 514 98% 541 109% 517 142%<br />
Provision for zakat & tax 135 -10% 128 -18% 114 -21% 115 -24%<br />
Others 30 -14% 28 -20% 31 -21% 33 -15%<br />
Current liabilities 884 35% 910 32% 933 35% 917 40%<br />
Long term loans 4,254 13% 4,690 15% 4,931 21% 4,711 41%<br />
Others 29 -38% 34 -32% 43 -19% 46 -21%<br />
Long term liabilities 4,283 12% 4,724 15% 4,974 21% 4,757 40%<br />
Total liabilities 5,167 16% 5,635 17% 5,907 23% 5,674 40%<br />
Minority interest 291 52% 323 68% 311 61% 287 48%<br />
Total equity 5,260 -3% 5,356 -3% 5,522 -1% 5,672 -9%<br />
21
THE NATIONAL SHIPPING COMPANY OF SAUDI ARABIA<br />
FAIR VALUE DEFINITION<br />
December 30, 2011<br />
RATING GUIDE<br />
ISSUER<br />
COMPANY UPDATE EQUITY RESEARCH<br />
It is an unbiased estimate <strong>of</strong> the 12-month potential market price <strong>of</strong> the stock<br />
SELL REDUCE HOLD ACCUMULATE BUY<br />
Downside -30% -10% +10% +30% Upside<br />
BUY: Upside potential in share price is more than 30%<br />
ACCUMULATE: Upside potential in share price is between 10 and 30%<br />
HOLD: Upside or downside potential in share price less than 10%<br />
REDUCE: Downside potential in share price is between 10 and 30%<br />
SELL: Downside potential in share price is more than 30%<br />
<strong>Audi</strong> Saradar Investment <strong>Bank</strong><br />
<strong>Audi</strong> Saradar Investment <strong>Bank</strong> SAL • Lebanese joint stock <strong>company</strong> with a registered capital <strong>of</strong><br />
10,000,000,000 Lebanese Pounds • Commercial Registrar in Beirut: 30812 • Holding number 33 on<br />
the Central <strong>Bank</strong>’s <strong>Bank</strong>s List.<br />
<strong>Bank</strong> <strong>Audi</strong> Plaza • Bab Idriss • Beirut 2021 8102 Lebanon • P.O. Box 11-2560 • Beirut 1107 2808 •<br />
Lebanon. Phone: +961 1 964072 • Fax: +961 1 970403 • Email: contactus@asib.com<br />
22
THE NATIONAL SHIPPING COMPANY OF SAUDI ARABIA<br />
December 30, 2011<br />
DISCLAIMER<br />
COMPANY UPDATE EQUITY RESEARCH<br />
“All rights reserved. This research document (the “Document”) is prepared by <strong>Audi</strong> Saradar Investment <strong>Bank</strong> SAL (“ASIB”),<br />
being an entity <strong>of</strong> <strong>Audi</strong> Saradar Group, for the use <strong>of</strong> the clients <strong>of</strong> ASIB and/or the clients <strong>of</strong> any entity within the <strong>Audi</strong><br />
Saradar Group.<br />
This Document is disclosed to you on a confidential basis. Receipt and/or review <strong>of</strong> this Document constitute your agreement<br />
not to copy, modify, redistribute, retransmit, or disclose to others the contents, opinions, conclusion, or information<br />
contained in this Document prior to public disclosure <strong>of</strong> the same by ASIB or the <strong>Audi</strong> Saradar Group or without the express<br />
prior written consent <strong>of</strong> ASIB.<br />
This Document is not intended for dissemination, distribution to, or use by, any person or entity in any country or jurisdiction<br />
which would subject ASIB or any entity within the <strong>Audi</strong> Saradar Group, to any registration or licensing requirements within<br />
these jurisdictions or where it might be considered as unlawful. Accordingly, this Document is for distribution solely in<br />
jurisdictions where permitted and to persons who may receive it without breaching any applicable legal or regulatory<br />
requirements. In any case, this Document shall not be distributed in the Republic <strong>of</strong> Egypt.<br />
Your attention is drawn to the fact that you should not access this Document if the regulations <strong>of</strong> your country <strong>of</strong> citizenship<br />
and/or residency or any applicable regulations prohibit it. In any case, persons who are subject to any restrictions in any<br />
country, such as US persons are not permitted to access information contained herein.<br />
Neither the information, nor any opinion expressed herein constitutes an <strong>of</strong>fer or an invitation or a recommendation to<br />
make an <strong>of</strong>fer, to buy or sell any security or other investment product related to such security or investment. This Document<br />
provides general information only, is not intended to provide personal investment advice or recommendation and does not<br />
take into account the specific investment objectives, financial situation and the particular needs <strong>of</strong> any specific person who<br />
may receive it. You should seek financial, legal or tax advice regarding the appropriateness and suitability in investing in any<br />
security, other investment or investment strategy discussed or forecasted in this Document.<br />
You should carefully read the definitions <strong>of</strong> the Rating Guide provided in this Document. In addition you should read this<br />
Document in its entirety and not conclude its contents from the ratings solely.<br />
<strong>The</strong> information herein was obtained from various public sources believed in good faith to be reliable. Neither ASIB nor any<br />
entity within the <strong>Audi</strong> Saradar Group represents that the information contained in this Document is complete, accurate<br />
or free from any error and makes no representations or warranties whatsoever as to the data, information and opinions<br />
provided herein.<br />
This Document and any information, opinion and prospect contained herein reflect a judgment at its original date<br />
<strong>of</strong> publication by ASIB and are subject to change without notice. ASIB and/or any entity within the <strong>Audi</strong> Saradar Group<br />
may have issued, and may in the future issue, other research documents that are inconsistent with, and reach different<br />
conclusions from, the information, opinions and prospects presented in this Document.<br />
This Document reflects the different assumptions, views and analytical methods <strong>of</strong> the analysts who prepared them; ASIB,<br />
and the <strong>Audi</strong> Saradar Group are under no obligation to ensure that such other research documents are brought to the<br />
attention <strong>of</strong> any recipient <strong>of</strong> this Document.<br />
ASIB, any entity within the <strong>Audi</strong> Saradar Group, one or more <strong>of</strong> their affiliates and/or their <strong>of</strong>ficers (including but not limited<br />
to their strategists, analysts and sales staff) may have a financial interest in securities <strong>of</strong> the issuer(s) or related investments,<br />
may engage in securities transactions, on a proprietary basis or otherwise, in a manner inconsistent with the view taken in<br />
this Document and may take a view that is inconsistent with that taken herein.<br />
<strong>The</strong> price, value <strong>of</strong> and income from any <strong>of</strong> the securities or financial instruments mentioned in this Document can fall as well<br />
as rise. <strong>The</strong> value <strong>of</strong> securities and financial instruments is subject to market conditions, volatility, exchange rate fluctuation<br />
and credit quality <strong>of</strong> any issuer that may have a positive or adverse effect on the price or income <strong>of</strong> such securities or<br />
financial instruments. Any forecasts on the economy, stock market, bond market or the economic trends <strong>of</strong> the markets are<br />
not necessarily a guide to future returns. You should understand that statements regarding future prospects may not be<br />
realized. Past performance should not be taken as an indication or guarantee <strong>of</strong> future performance, and no representation<br />
or warranty, express or implied, is made regarding future returns. As a result <strong>of</strong> the preceding, you may lose, as the case may<br />
be, the amount originally invested.<br />
None <strong>of</strong> ASIB, any entity within the <strong>Audi</strong> Saradar Group, any <strong>of</strong> their affiliates and/or their <strong>of</strong>ficers (including but not limited<br />
to their strategists, analysts and sales staff) shall be held liable for any loss or damage that may arise, directly or indirectly,<br />
from any use <strong>of</strong> the information contained in this Document nor for any decision or investment made on the basis <strong>of</strong><br />
information contained herein.”<br />
23