financials - Bank Audi
financials - Bank Audi
financials - Bank Audi

Create successful ePaper yourself
Turn your PDF publications into a flip-book with our unique Google optimized e-Paper software.
COVERED BANKS<br />
Samba Financial Group Buy<br />
Current Price (SAR) 47.6<br />
Fair Value (SAR) 62.4<br />
Upside Potential 31%<br />
Al Rajhi <strong>Bank</strong> Buy<br />
Current Price (SAR) 73.5<br />
Fair Value (SAR) 95.8<br />
Upside Potential 30%<br />
Saudi British <strong>Bank</strong> Accumulate<br />
Current Price (SAR) 32.9<br />
Fair Value (SAR) 38.7<br />
Upside Potential 18%<br />
Banque Saudi Fransi Accumulate<br />
Current Price (SAR) 32.9<br />
Fair Value (SAR) 41.2<br />
Upside Potential 25%<br />
Riyad <strong>Bank</strong> Accumulate<br />
Current Price (SAR) 23.0<br />
Fair Value (SAR) 28.4<br />
Upside Potential 23%<br />
Arab National <strong>Bank</strong> Accumulate<br />
Current Price (SAR) 29.0<br />
Fair Value (SAR) 36.4<br />
Upside Potential 26%<br />
Saudi Hollandi <strong>Bank</strong> Accumulate<br />
Current Price (SAR) 27.5<br />
Fair Value (SAR) 32.1<br />
Upside Potential 17%<br />
<strong>Bank</strong> al Bilad Hold<br />
Current Price (SAR) 31.0<br />
Fair Value (SAR) 31.2<br />
Upside Potential 1%<br />
<strong>Bank</strong> al Jazira Hold<br />
Current Price (SAR) 28.3<br />
Fair Value (SAR) 30.8<br />
Upside Potential 9%<br />
Alinma <strong>Bank</strong> Accumulate<br />
Current Price (SAR) 13.5<br />
Fair Value (SAR) 15.6<br />
Upside Potential 16%<br />
SECTOR COVERAGE<br />
Wael Chalak, CFA<br />
Associate<br />
Wael.Chalak@asib.com<br />
Ghida Barbari<br />
Ghida.Barbari@asib.com<br />
Youssef Nizam, CFA<br />
Head of Equity Research<br />
Youssef.Nizam@asib.com<br />
August 24, 2012<br />
EQUITY RESEARCH<br />
ENTITY OF AUDI SARADAR GROUP SAUDI BANKS<br />
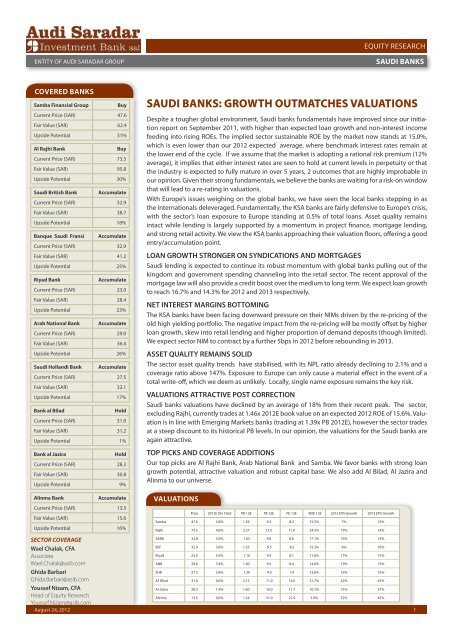
SAUDI BANKS: GROWTH OUTMATCHES VALUATIONS<br />
Despite a tougher global environment, Saudi banks fundamentals have improved since our initiation<br />
report on September 2011, with higher than expected loan growth and non-interest income<br />
feeding into rising ROEs. The implied sector sustainable ROE by the market now stands at 15.0%,<br />
which is even lower than our 2012 expected average, where benchmark interest rates remain at<br />
the lower end of the cycle. If we assume that the market is adopting a rational risk premium (12%<br />
average), it implies that either interest rates are seen to hold at current levels in perpetuity or that<br />
the industry is expected to fully mature in over 5 years, 2 outcomes that are highly improbable in<br />
our opinion. Given their strong fundamentals, we believe the banks are waiting for a risk-on window<br />
that will lead to a re-rating in valuations.<br />
With Europe’s issues weighing on the global banks, we have seen the local banks stepping in as<br />
the internationals deleveraged. Fundamentally, the KSA banks are fairly defensive to Europe’s crisis,<br />
with the sector’s loan exposure to Europe standing at 0.5% of total loans. Asset quality remains<br />
intact while lending is largely supported by a momentum in project finance, mortgage lending,<br />
and strong retail activity. We view the KSA banks approaching their valuation floors, offering a good<br />
entry/accumulation point.<br />
LOAN GROWTH STRONGER ON SYNDICATIONS AND MORTGAGES<br />
Saudi lending is expected to continue its robust momentum with global banks pulling out of the<br />
kingdom and government spending channeling into the retail sector. The recent approval of the<br />
mortgage law will also provide a credit boost over the medium to long term. We expect loan growth<br />
to reach 16.7% and 14.3% for 2012 and 2013 respectively.<br />
NET INTEREST MARGINS BOTTOMING<br />
The KSA banks have been facing downward pressure on their NIMs driven by the re-pricing of the<br />
old high yielding portfolio. The negative impact from the re-pricing will be mostly offset by higher<br />
loan growth, skew into retail lending and higher proportion of demand deposits (though limited).<br />
We expect sector NIM to contract by a further 5bps in 2012 before rebounding in 2013.<br />
ASSET QUALITY REMAINS SOLID<br />
The sector asset quality trends have stabilised, with its NPL ratio already declining to 2.1% and a<br />
coverage ratio above 147%. Exposure to Europe can only cause a material effect in the event of a<br />
total write-off, which we deem as unlikely. Locally, single name exposure remains the key risk.<br />
VALUATIONS ATTRACTIVE POST CORRECTION<br />
Saudi banks valuations have declined by an average of 18% from their recent peak. The sector,<br />
excluding Rajhi, currently trades at 1.46x 2012E book value on an expected 2012 ROE of 15.6%. Valuation<br />
is in line with Emerging Markets banks (trading at 1.39x PB 2012E), however the sector trades<br />
at a steep discount to its historical PB levels. In our opinion, the valuations for the Saudi banks are<br />
again attractive.<br />
TOP PICKS AND COVERAGE ADDITIONS<br />
Our top picks are Al Rajhi <strong>Bank</strong>, Arab National <strong>Bank</strong> and Samba. We favor banks with strong loan<br />
growth potential, attractive valuation and robust capital base. We also add Al Bilad, Al Jazira and<br />
Alinma to our universe.<br />
VALUATIONS<br />
Price 2012E Div Yield PB 12E PE 12E PE 13E ROE 12E 2012 EPS Growth 2013 EPS Growth<br />
Samba 47.6 3.8% 1.39 9.3 8.2 15.5% 7% 14%<br />
Rajhi 73.5 4.8% 3.27 13.5 11.9 24.5% 19% 14%<br />
SABB 32.9 3.0% 1.63 9.8 8.6 17.1% 16% 14%<br />
BSF 32.9 3.6% 1.33 9.5 8.2 15.3% 6% 16%<br />
Riyad 23.0 5.0% 1.10 9.4 8.1 11.6% 17% 15%<br />
ANB 29.0 3.4% 1.40 9.5 8.4 14.6% 19% 13%<br />
SHB 27.5 3.6% 1.36 9.0 7.9 13.6% 16% 15%<br />
Al Bilad 31.0 0.0% 2.15 11.0 14.0 21.7% 42% 42%<br />
Al Jazira 28.3 1.9% 1.60 16.0 11.7 10.1% 75% 37%<br />
Alinma 13.5 0.0% 1.24 31.0 21.9 3.9% 52% 42%<br />
1
August 24, 2012<br />
TABLE OF CONTENTS<br />
INVESTMENT CASE<br />
EQUITY RESEARCH<br />
SAUDI BANKS<br />
Improved Fundamentals on Low Valuations 3<br />
Retail Oriented Market Could Cap Short Term Upside 4<br />
Summary of Fair Value Changes and Coverage Additions 4<br />
Relative Valuations 4<br />
Valuation Catalysts 5<br />
Valuation Methodology 6<br />
Valuation Key Risks 6<br />
How We Differ from Consensus 6<br />
Top Picks 6<br />
SECTOR OUTLOOK<br />
Exposure to Europe : How Immune are the KSA <strong>Bank</strong>s ? 8<br />
Loan Growth Benefits From Global Deleveraging 9<br />
Mortgage Law Approval Boosts The Longer Term Outlook 10<br />
Retail Lending Still Gaining Pace 13<br />
Favorable Liquidity Adds Support to Lending Momentum 14<br />
Loan Growth Projections 14<br />
The Effect of Brokerage and Proprietary Trading 15<br />
Net Interest Margins Bottoming 17<br />
Asset Quality Stays Solid 18<br />
BANKS SECTION<br />
Samba Financial Group 19<br />
Al Rajhi <strong>Bank</strong> 22<br />
Saudi Arabian British <strong>Bank</strong> 25<br />
Banque Saudi Fransi 28<br />
Riyad <strong>Bank</strong> 31<br />
Arab National <strong>Bank</strong> 34<br />
Saudi Hollandi <strong>Bank</strong> 37<br />
<strong>Bank</strong> Al Bilad 40<br />
<strong>Bank</strong> Al Jazira 43<br />
Alinma <strong>Bank</strong> 46<br />
2
August 24, 2012<br />
INVESTMENT CASE<br />
IMPROVED FUNDAMENTALS ON LOW VALUATIONS<br />
EQUITY RESEARCH<br />
SAUDI BANKS<br />
Over the last 4 months, the Tadawul <strong>Bank</strong>ing Index PE multiple declined by 18% from its recent peak<br />
on Europe’s economic concerns. At the same time, sector fundamentals have in fact improved with<br />
banks ROEs lifted by a rising lending momentum and stronger non-interest income.<br />
Chart 1: Tadawul <strong>Bank</strong>ing Index P/E<br />
Source: Bloomberg<br />
Sector fundamentals have re-rated as lending picked up, asset quality stabilized and NIMs approached<br />
their floors. Saudi banks are now replacing the international banks in the project finance<br />
space, as global banks face pressure on their capital ratios in the midst of concerns over a European<br />
crisis. Government spending and the recent approval of the mortgage law are also backing up retail<br />
lending as consumers capacity to borrow increases. As of Q1-12, the sector NPL has reached 2.1%<br />
with an NPL coverage ratio of 147%, reaffirming the sector’s solid asset quality. Pressure on NIMs has<br />
also eased, with most of the high yield investment portfolio already re-priced on new terms. We do<br />
not expect major pressure from loan re-pricing as corporate lending in KSA is 80% driven by working<br />
capital needs and project finance share of total lending is only starting to become significant.<br />
In our view, a widening gap between valuations and ROE coupled with a sounder sector outlook<br />
creates an opportunity for entry /accumulation point. We note that the gap between the sector’s<br />
price to book and its ROE is the largest since March 2009 lows.<br />
Chart 2: Saudi <strong>Bank</strong>ing Sector PB - ROE<br />
Source: Bloomberg, ASIB research<br />
3
August 24, 2012<br />
RETAIL ORIENTED MARKET COULD CAP SHORT TERM UPSIDE<br />
EQUITY RESEARCH<br />
SAUDI BANKS<br />
During the first half of 2012, the risk-on trade has pushed the Tadawul volumes into levels not seen<br />
since 2007, with many investors accessing sizeable leverage positions. Heavy buying has certainly<br />
supported the market on the upside with a 25% rise in the first 3 months of the year. On the flip side,<br />
leverage has also triggered heavy selling on the correction, leaving speculators and short term<br />
traders financially scarred. This recent experience could cap the upside for the banks over the short<br />
term; however with robust fundamentals in place, Saudi banks are well placed for an upturn.<br />
SUMMARY OF FAIR VALUE CHANGES AND COVERAGE ADDITIONS<br />
In general fair values have been adjusted upwards on higher growth and better ROEs (with the<br />
exception of Riyad <strong>Bank</strong> and Banque Saudi Fransi). Saudi Hollandi <strong>Bank</strong> has witnessed a major rerating<br />
since last year, mainly on improved asset quality and better NIMs. We add 3 banks to our<br />
coverage universe, being <strong>Bank</strong> Al Bilad , <strong>Bank</strong> Al Jazira and Alinma <strong>Bank</strong>.<br />
• We initiate on Al Bilad with a Hold rating. Al Bilad has shown superior strength in retail growth<br />
and in the remittance business. However trading at 2.15x PB 2012E, we believe the bank’s<br />
upside is capped relative to peers.<br />
• <strong>Bank</strong> al Jazira is skewed to investment banking activities, with Al Jazira Capital holding the 3rd<br />
largest brokerage market share in KSA and making a significant contribution to the bank’s<br />
earnings. Al Jazira is well positioned to outperform in a risk-on environment. However given<br />
current market uncertainty and the fact that it trades at 1.60 times 2012E book value, we<br />
initiate on Al Jazira with a Hold rating.<br />
• Alinma <strong>Bank</strong> is an upcoming Islamic bank that managed to capture 3.1% lending market share<br />
since it started operating. In a similar way to Al Rajhi, the bank enjoys a cheaper than peers cost<br />
of funds, allowing it to price competitively. The bank is trading at 1.24x 2012E book value and<br />
PE13E of 21.9x, which in our view is partially capturing its upside; hence our Accumulate rating.<br />
Table 1: Fair Value Changes and Earnings Comparison to Consensus<br />
Old Fair<br />
Value<br />
New Fair<br />
Value<br />
% Change Upside/<br />
Downside<br />
ASIB 12E<br />
EPS<br />
ASIB 13E<br />
EPS<br />
ASIB 14E<br />
EPS<br />
Cons. 12E<br />
EPS<br />
Cons. 13E<br />
EPS<br />
Cons. 14E<br />
Samba 59.8 62.4 4% 31% 5.09 5.80 6.56 5.00 5.70 6.70<br />
Rajhi 91.2 95.8 4% 30% 5.46 6.20 7.08 5.30 6.24 7.12<br />
SABB 36.8 38.7 5% 18% 3.36 3.83 4.45 3.13 3.66 4.26<br />
BSF 42.2 41.2 -2% 25% 3.44 3.99 4.57 3.30 3.95 4.41<br />
Riyad 29.3 28.4 -3% 23% 2.45 2.83 3.27 2.30 2.70 3.20<br />
ANB 35 36.4 4% 26% 3.03 3.43 3.88 2.80 3.50 4.00<br />
SHB 25.1 32.1 28% 17% 3.15 3.56 4.03 3.00 3.30 3.70<br />
Bilad na 31.2 na 1% 2.80 2.21 2.52 3.03 2.31 2.72<br />
Jazira na 30.8 na 9% 1.77 2.42 3.00 1.62 2.11 2.68<br />
Alinma na 15.6 na 16% 0.43 0.62 0.94 0.42 0.68 1.07<br />
Source: Bloomberg, ASIB estimates<br />
RELATIVE VALUATIONS<br />
Excluding Al Rajhi <strong>Bank</strong>, the Saudi banks currently trade at a PB 2012E of 1.46x, PE 2012E of 9.8x and<br />
PE 2013E of 8.5x with a sector ROE of 15.6%. If we were to include Al Rajhi bank, sector valuation<br />
reaches a PB 2012E of 2.25x, PE 2012E of 11.6 x and PE 2013E of 10.8x with a sector ROE rising to<br />
19.1%.<br />
We are of the opinion that current valuations for the Saudi banks do not reflect their robust<br />
fundamentals. We acknowledge the rationale behind the recent de-rating for KSA banks as risk<br />
premiums have increased on global concerns. However, we believe the KSA banks ROEs have<br />
achieved stability and we are witnessing a widening gap between valuation and profitability that<br />
creates buying opportunities.<br />
EPS<br />
4
August 24, 2012<br />
EQUITY RESEARCH<br />
SAUDI BANKS<br />
Due to stronger capital adequacy and higher operational profitability, the Saudi banks have traded<br />
at a premium to their emerging markets counterparts in the past. However, valuation differentials<br />
have narrowed recently.<br />
Chart 3: Relative <strong>Bank</strong>ing Sector Valuations<br />
Source: Bloomberg, ASIB estimates<br />
The Saudi banks are now trading at a steep price to book discount to their 5 year historical average of<br />
3.4x, which in our opinion is not justified, notwithstanding a recent increase in global risk premium.<br />
We note that Saudi banks ROEs have turned the corner with fees and commissions rising on surging<br />
lending and trading volumes, while net interest margins seem to have stabilised.<br />
Table 2: Saudi <strong>Bank</strong>s Valuation Summary<br />
Price Fair<br />
Value<br />
Upside<br />
Potential<br />
2011 Div.<br />
Yield<br />
PB 12E PE 12E PE 13E ROAE<br />
12E<br />
2012 E EPS<br />
Growth<br />
2013 E EPS<br />
Growth<br />
Samba 47.6 62.4 31% 3.8% 1.39 9.3 8.2 15.5% 7% 11%<br />
Al Rajhi 73.5 95. 30% 4.8% 3.27 13.5 11.9 24.5% 19% 12%<br />
SABB 32.9 38.7 18% 3.6% 1.63 9.8 8.6 17.4% 16% 14%<br />
BSF 32.9 41.2 25% 3.6% 1.33 9.6 8.2 15.3% 6% 16%<br />
Riyad 23.0 28.4 23% 5.0% 1.10 9.4 8.1 11.6% 16% 15%<br />
ANB 29.0 36.4 26% 3.4% 1.40 9.6 8.5 14.3% 19% 13%<br />
SHB 27.5 32.1 17% 3.6% 1.36 9.1 7.9 13.6% 16% 15%<br />
Al Bilad 31.0 31.2 1% 0.0% 2.15 19.9 14.0 12.1% 42% 42%<br />
Al Jazira 28.3 30.8 9% 1.9% 1.72 16.0 11.7 10.1% 75% 37%<br />
Alinma 13.5 15.6 16% 0.0% 1.24 31.0 21.9 2.7% 52% 42%<br />
Source: Bloomberg, ASIB estimates<br />
VALUATION CATALYSTS<br />
Going forward, the key catalysts in our opinion will be:<br />
• Return to risk-on environment triggered by a better outlook on global markets. This will lower<br />
the market’s implied discount rate and improve KSA banks profitability through brokerage<br />
income and profits on equity investments.<br />
• Saudi banks accelerating their pace in the syndications space. KSA banks have largely replaced<br />
international banks in financing projects since the beginning of the year. We believe a stronger<br />
foothold in this domain will push loan growth above our base case scenario.<br />
• An increase in the access to long term funding markets, allowing banks to be well placed from<br />
an asset-liability management perspective for project finance and mortgage lending.<br />
5
August 24, 2012<br />
EQUITY RESEARCH<br />
SAUDI BANKS<br />
VALUATION METHODOLOGY<br />
We value the Saudi banks using the sustainable ROE approach cross-checked with the dividend<br />
discount model with the exception of Alinma <strong>Bank</strong>, where we rely solely on the sustainable ROE<br />
model. Our estimates have a five year forecast period with a terminal value in the fifth year. We<br />
derive the cost of equity by using the capital asset pricing model while taking into account the<br />
political and socio-economic environment. Our discount rate of 12% takes into account the current<br />
state of global markets, leading to a higher investor risk premium . We apply a perpetual growth rate<br />
of 5% on the terminal value.<br />
VALUATION KEY RISKS<br />
Key risks to our fair value estimations for the covered banks are:<br />
• Further deterioration in Europe’s debt crisis. The direct impact on the KSA banks is limited given<br />
the modest exposure on the books, however the indirect repercussions will result in heavier<br />
consequences.<br />
• Slower than foreseen global growth from the rest of the world (mainly US and BRICS), hence<br />
causing a slowdown in commodities demand (including oil).<br />
• A blow up in any large single name exposure.<br />
• A faster than expected mortgage penetration is an upside risk to our valuations.<br />
HOW WE DIFFER FROM CONSENSUS<br />
Our earnings estimates are relatively in line with consensus. In terms of loan growth we are less<br />
bullish on growth emerging from the mortgage law. Our NIM estimates are slightly more bullish,<br />
however our ROEs are at the low end of consensus as we assign higher capital ratios in general.<br />
TOP PICKS: AL RAJHI, ANB AND SAMBA<br />
Al Rajhi: superior profitability more than justifies premium valuation<br />
Al Rajhi <strong>Bank</strong> is the most profitable bank within KSA with a 2012E ROE of 24.5%, well above the<br />
average ROE of 15.6% for the rest of the Saudi peers. Al Rajhi enjoys a cheap funding base with short<br />
term deposits constituting about 90% of its total deposit base. With 2 thirds of its total loans in retail,<br />
Al Rajhi’s yield on assets is evidently higher than the rest of the Saudi banks, which carry a more<br />
corporate skewed loan book. We expect the recent strength in retail lending to continue to support<br />
Al Rajhi’s profitability. Over the last 2 years, Al Rajhi’s liquidity remained adequate with its current<br />
loan to deposit ratio reaching 85%, providing itself with a strong platform for future growth. Al Rajhi<br />
trades at a PB 2012E of 3.27x, a premium of 42% to the Saudi market weighted average PB 2012E of<br />
2.25x. Al Rajhi’s premium valuation, in our opinion, is more than justified by its superior profitability<br />
and strong growth outlook.<br />
Arab National <strong>Bank</strong>: attractive valuation / growth profile<br />
ANB is within top players in the retail Saudi market which has supported its NIM over the years. The<br />
bank has largely addressed its previous asset quality concerns with its NPL now declining to 2.13%<br />
on an NPL coverage of 159%. The bank is well established to grow in both the retail and corporate<br />
space, now that asset quality concerns have been dealt with. Y-o-Y the corporate book has grown<br />
by12% while the retail book has grown by 20%. We forecast earnings growth for ANB of 19% and<br />
13% for 2012 and 2013 respectively. The bank trades at a PB2012E of 1.40x, 10% below its 2 year<br />
average. On a PE basis, the bank is valued at 9.6x 2012E a 6% discount to peers. We raise ANB’s fair<br />
value to SAR 36.4 given its improved fundamentals.<br />
6
August 24, 2012<br />
EQUITY RESEARCH<br />
SAUDI BANKS<br />
Samba: widening valuation discount<br />
In our opinion, Samba’s valuation remains discounted. The stock underperformed its local peers<br />
mainly due to weak loan growth. Samba’s results revealed solid strength on many aspects however,<br />
the bank is leading on asset quality improvement with its NPL ratio dropping from 3.70% to 2.45%.<br />
Growth is below sector average, nonetheless the bank managed to deliver a 6.8% increase in gross<br />
loans and advances over the last 6 months. The liquidity profile has certainly improved with the loan<br />
to deposit ratio increasing from 59% to 68% Y-o-Y. Samba’s loan exposure to Europe is not higher<br />
than its peers (at 0.5% of total assets), however the bank holds 2.8% of total assets under European<br />
investments. The bank’s discount to the sector has recently widened with the bank trading at a PB<br />
2012E of 1.39x, a 7% discount to the comparable Saudi banks despite comparable ROEs.<br />
7
August 24, 2012<br />
EQUITY RESEARCH<br />
SAUDI BANKS<br />
EXPOSURE TO EUROPE : HOW IMMUNE ARE THE SAUDI BANKS?<br />
KSA lending exposure to Europe accounts for 0.5% of system total lending. The majority of these<br />
loans were granted to established corporates with solid financial health. According to the pillar 3<br />
disclosure, the Saudi banks are also exposed to Europe through the investment portfolio with Riyad<br />
bank, Samba and Arab National <strong>Bank</strong> being the most exposed. While the combination of the above<br />
is less than 3% of system’s total assets, the KSA banks may need to raise capital in the event of heavy<br />
write-downs on European exposures.<br />
Table 3: <strong>Bank</strong>s Portfolios Exposure to Europe (% of Total Assets)<br />
Loans Investments Total<br />
BSF 0.5% 0.5% 1.0%<br />
Samba 0.5% 2.8% 3.3%<br />
SABB 0.0% 0.3% 0.3%<br />
SHB 0.0% 0.2% 0.2%<br />
ANB 0.3% 3.0% 3.3%<br />
Riyad 0.5% 5.3% 5.8%<br />
Jazira 0.0% 0.3% 0.3%<br />
Source: Saudi <strong>Bank</strong>s 2011 Financial Reports (Pillar III)<br />
We analyze below the percentage of equity needed to be raised on 10%, 20% and 30% write-downs<br />
of European exposure. We have excluded Al Rajhi, Al Bilad and Alinma from the analysis below as<br />
there are no direct European exposure on their lending or investment books.<br />
Chart 4: Percentage of reduction in equity to be on write down of European Exposure<br />
Source: Bloomberg, ASIB estimates<br />
We note that the latest disclosures available on this topic are as of 31 December 2011. Since then,<br />
exposures may have changed, especially when considering that certain banks have reduced their<br />
investments.<br />
8
August 24, 2012<br />
EQUITY RESEARCH<br />
SAUDI BANKS<br />
LOAN GROWTH BENEFITS FROM GLOBAL DELEVERAGING<br />
In spite of global economic concerns, net loan growth in KSA has accelerated from an annual<br />
10.4% in 2011 to 16.4% in June 2012. The pick up in lending was driven by a step-in from the KSA<br />
banks to replace internationals as deleveraging persists. The share of KSA banks of total project<br />
finance has increased from a 5th of the pie to almost a third. Data from the <strong>Bank</strong> of International<br />
Settlements (BIS) reveals that there remains $44bn of lending in KSA by European banks, equating<br />
to approximately 18% of KSA banks lending, hence providing a sizeable opportunity in the event<br />
of further deleveraging. The banks in KSA were the biggest loan arrangers in the MENA region<br />
accounting for approximately 45% of total loans.<br />
Subsidized loans are also retracting, lending by the kingdom’s Public Investment Fund and the<br />
Saudi Industrial Development Fund dropped 16% and 40% respectively in 2011, according to data<br />
published by SAMA.<br />
The projects portion financed by KSA banks in 2012 and 2013 is estimated at 4.5% of current Saudi<br />
banks lending. We note below the list of upcoming projects which the Saudi banks will be partially<br />
financing:<br />
Table 4: List of Upcoming Saudi Projects for 2012 and 2013<br />
Project Owner Expected Financing Value ($bn) Amount Financed By Local <strong>Bank</strong>s<br />
Sadara Aramco 2012 20 2.7<br />
Yanbu Refinery Aramco 2012-2013 10 2.1<br />
Al khabra Phosphates Maaden 2013 6 1.1<br />
Elastomers Project SABIC 2012-2013 5 1.1<br />
KAEC Heavy Steel Complex Al Rajhi Steel 2012 4 0.9<br />
Medina Airport GACA Jun-12 1.5 0.15<br />
Clean Fuels Project Aramco - Mobil 2012-2013 na na<br />
Lube Oil Refinery Luberef 2nd Half 2012 na na<br />
Mecca Hotels and Shops Jabal Omar 2012-2013 1.3 1.3<br />
Source: MEED, Bloomberg, ASIB Analysis<br />
We apply below some sensitivities revealing the potential growth for KSA banks stemming from<br />
market share gains in the project finance market.<br />
Chart 5: Loan Growth Sensitivity to Project Finance Share<br />
Source: Bloomberg, ASIB estimates<br />
9
August 24, 2012<br />
EQUITY RESEARCH<br />
SAUDI BANKS<br />
MORTGAGE LAW APPROVAL BOOSTS THE LONGER TERM OUTLOOK<br />
Specifics in regards to the mortgage law are yet to come, nevertheless the recent approval paves<br />
the way for banks to diversify their lending over the long term. We are not expecting a rush from<br />
the banks into mortgages, as many obstacles remain in place for a robust framework to formulate.<br />
We note the below factors that are likely to delay a major short term jump in mortgage lending:<br />
• Most real estate developers currently target high end customers that are not dependent on<br />
mortgages. Moving to a lower tier will require a new construction cycle which will take time.<br />
• The new demand will cause a lift in property prices, hence capping affordability.<br />
• <strong>Bank</strong>s funding is short term while mortgage lending is long term, hence creating an assetliability<br />
mismatch. A solution would be the creation of a real estate SPV structured by the banks.<br />
• The banks will need some time to test the new model on the ground.<br />
• KSA home buyers targeting home purchases beyond their affordability.<br />
Currently, mortgage loans only equate to approximately 3.5% of total loans and 12.5% of retail<br />
loans, nevertheless the banks have witnessed decent growth levels in housing loans post the Global<br />
Financial Crisis ( 20% CAGR from 2008 to 2011).<br />
The opportunity in mortgage lending remains sizeable for the Saudi banks with penetration levels<br />
deemed largely low in a global context.<br />
Chart 6: Mortgages to GDP<br />
Source: Central <strong>Bank</strong>s, ASIB estimates<br />
Currently Al Rajhi <strong>Bank</strong> and SABB dominate the current mortgage lending market, while Arab<br />
National <strong>Bank</strong> and Saudi Hollandi <strong>Bank</strong> can largely improve their market shares.<br />
Table 5: Saudi <strong>Bank</strong>s - Mortgage Market Share (2011)<br />
<strong>Bank</strong> Mortgage Market Share<br />
Al Rajhi 30.1%<br />
SABB 16.8%<br />
Riyad 12.9%<br />
Samba 11.4%<br />
Al Jazira 8.1%<br />
BSF 7.2%<br />
Al Bilad 4.9%<br />
ANB 2.7%<br />
SHB 0.8%<br />
Alinma 0.0%<br />
Source: Financial Reports, ASIB estimates<br />
10
August 24, 2012<br />
EQUITY RESEARCH<br />
SAUDI BANKS<br />
With mortgages making a small portion of total loans, growth in mortgages will need to be sizeable<br />
in order to have a material effect on the banks total loan growth, as seen below at different scenarios:<br />
Table 6 : Total Loan Growth Sensitivity to Mortgage Growth<br />
At 20% growth At 50% growth At 100% growth<br />
Al Bilad 1.92% 4.81% 9.61%<br />
Al Jazira 1.89% 4.73% 9.46%<br />
Al Rajhi 1.16% 2.91% 5.82%<br />
SABB 1.08% 2.70% 5.40%<br />
Samba 0.72% 1.81% 3.61%<br />
Riyad 0.66% 1.66% 3.32%<br />
BSF 0.43% 1.09% 2.17%<br />
ANB 0.21% 0.52% 1.05%<br />
NCB 0.19% 0.46% 0.93%<br />
SHB 0.11% 0.29% 0.57%<br />
Total 0.70% 1.71% 3.51%<br />
Source: Financial Reports, ASIB estimates<br />
The sensitivities above demonstrate that the Islamic banks benefit more than the conventional<br />
banks from every 1% rise in their mortgage portfolios more, with Al Bilad and Al Jazira leading due<br />
to their mortgage skewed loan book.<br />
ASSESSING THE LIKELY IMPACT ON LOAN GROWTH AND PROFITABILITY<br />
While the impact of the mortgage law will take time to become fully effective, we provide a base<br />
case scenario on the incremental lending and profitability emerging from the law’s approval. Our<br />
core assumptions for this base case scenario are:<br />
• 175 thousand units built each year.<br />
• Average unit value of SAR 750k.<br />
• Two from every 3 units will require finance from the banks.<br />
• Average loan to value ratio of 80%.<br />
• An average NIM of 2.5%.<br />
• Cost of Risk of 30bps.<br />
Should such a scenario materialise, our analysis shows that system lending could increase by an<br />
incremental 7.9%, while earnings will be lifted by an additional 3.9%. We note that as non-mortgage<br />
loans grow, the effect of the mortgage law on total loan growth becomes of decreasing scale.<br />
On the individual level, we assess the incremental earnings growth under 2 scenarios:<br />
• Scenario 1: If new loans emerging from the mortgage law are shared across all banks according<br />
to their current mortgage lending market shares.<br />
Chart 7: Incremental EPS Growth Based on Maintaining Mortgage Market Share<br />
Source: Bloomberg, ASIB estimates<br />
11
August 24, 2012<br />
EQUITY RESEARCH<br />
SAUDI BANKS<br />
• Scenario 2: If new loans emerging from the mortgage law are shared across all banks according<br />
to their current total lending market shares.<br />
Chart 8: Incremental EPS Growth Based on Gaining Market Share Proportionate to Total Book<br />
Source: Bloomberg, ASIB estimates<br />
We believe that banks with strong retail franchise will also hold a comparative advantage in<br />
mortgage lending. We compare the retail scale and efficiency of the Saudi banks:<br />
Table 7: Saudi <strong>Bank</strong>s Retail Efficiency Comparison<br />
Number of<br />
Branches<br />
Retail Portfolio<br />
(SAR mn)<br />
Retail Loans /<br />
Branch<br />
Retail /<br />
Total loans<br />
Al Rajhi 454 85,327 188 60%<br />
NCB 295 39,623 134 28%<br />
Riyad 248 26,295 106 23%<br />
ANB 142 20,451 144 28%<br />
BSF 83 10,399 125 11%<br />
Al Bilad 82 5,515 67 40%<br />
SABB 80 16,051 201 19%<br />
Samba 69 17,188 249 19%<br />
Al Jazira 51 7,261 142 31%<br />
SHB 44 4,128 94 11%<br />
Alinma 37 4,270 115 17%<br />
Source: SAMA<br />
In reality, none of the scenarios above is likely to materialise exactly, but we believe that banks with<br />
scale, high existent mortgage market share and strong retail franchise are likely to build most on the<br />
new law. We highlight Al Rajhi, Al Jazira, Al Bilad from the islamic banks, SABB and Riyad <strong>Bank</strong> from<br />
the conventional banks.<br />
12
August 24, 2012<br />
RETAIL LENDING STILL GAINING PACE<br />
EQUITY RESEARCH<br />
SAUDI BANKS<br />
Retail credit growth has been gradually recovering since the second half of 2009, post heavy<br />
deleveraging caused by the Global Financial Crisis. The government spending measures taken in<br />
2011 have boosted retail growth from 11% to nearly 20% in less than a year. This was due to increased<br />
salaries, higher borrowing capacity and ability to spend, lower rates as well as more Saudisation.<br />
The banks appetite for credit risk is also naturally increasing as NPLs decline and provision coverage<br />
ratios rise.<br />
Chart 9: Retail Loan Growth Has Outpaced Corporate Growth<br />
Source: Bloomberg, ASIB estimates<br />
Chart 10: KSA Retail Loans to GDP vs Other Countries<br />
Source: Financial Reports, ASIB Estimates<br />
We believe that government spending, the potential approval of the mortgage law and improved<br />
lending appetite pave the way for retail credit to grow at higher than historical rates. We also see<br />
the retail window as an opportunity for banks to improve their NIMs in a period of sustained low<br />
benchmark rates. It’s worth noting that so far retail competition in KSA has capped this opportunity<br />
to a certain extent, with many banks pricing their new retail loans on low margins.<br />
13
August 24, 2012<br />
FAVORABLE LIQUIDITY ADDS SUPPORT TO LENDING<br />
MOMENTUM<br />
EQUITY RESEARCH<br />
SAUDI BANKS<br />
Sector loan to deposit ratios (LDRs) remain low in a global context, leaving large room for Saudi<br />
banks to increase lending, with minimal need to access the wholesale markets or securitisation.<br />
LDRs in Saudi Arabia are lower than average LDRs in the UAE and Europe and well below the levels<br />
attained in the UK and Qatar.<br />
Chart 11: MENA and DM LDRs<br />
Source: Financial Reports, ASIB Estimates<br />
LOAN GROWTH PROJECTIONS<br />
We forecast a loan growth of 16.7% in 2012 declining to 10.0% by 2016. While new loans are expected<br />
to remain solid, we expect the percentage Y-o-Y growth to decline gradually as we do not factor<br />
sharp rises in new loans at this stage. Further deleveraging from the global banks and strong intake<br />
of mortgage lending are upside risks to our loan projections. On the other side, a deterioration in<br />
asset quality on any single name exposure would cause a drag on lending.<br />
Chart 12: Loan Growth Projection<br />
Source: Financial Reports, ASIB Estimates<br />
14
August 24, 2012<br />
EQUITY RESEARCH<br />
SAUDI BANKS<br />
THE EFFECT OF BROKERAGE AND PROPRIETARY TRADING<br />
Rising volumes and rallying equity prices in Q1-12 raised the question of the impact of brokerage<br />
and proprietary trading on KSA banks profitability. Saudi banks dominate the local brokerage<br />
market, offering low commission rates in return for strong banking relationships. The biggest<br />
players are Al Rajhi Capital, NCB Capital and AL Jazira Capital.<br />
Chart 13: Brokerage Market Shares<br />
Source: SAMA, Tadawul , ASIB Estimates<br />
As at 31 December 2011, brokerage contributed to 2.75% of total operating income on average for<br />
the KSA banks , however for Al Jazira the contribution is substantially higher at 11.89%. We note that<br />
we expect the contribution of brokerage income to be higher going forward, given the volumes<br />
that we have witnessed so far in 2012.<br />
Table 8: Brokerage Income % of Total Operating Income<br />
<strong>Bank</strong> %<br />
Al Jazira 11.89%<br />
Samba 5.89%<br />
BSF 4.25%<br />
SHB 2.59%<br />
SABB 2.37%<br />
ANB 2.24%<br />
NCB 2.14%<br />
Al Rajhi 2.01%<br />
Al Bilad 1.68%<br />
Riyad 0.23%<br />
System 2.75%<br />
Source: Financial Reports<br />
Besides brokerage, the banks hold equity positions under their available-for-sale and held for<br />
trading portfolios. Changes in available-for-sale investments are recorded under equity unless<br />
realised, where they hit the income statement. Changes in held for trading investments feed directly<br />
into the P&L.<br />
15
August 24, 2012<br />
EQUITY RESEARCH<br />
SAUDI BANKS<br />
We analyse below the effect on the banks earnings emerging from a 10% rise in the TASI as well as<br />
10% rise in traded volumes.<br />
Table 9: Effect on Earnings Assuming 10% Rise in Volumes and Prices<br />
Brokerage HFT investments Realisation of 10% AVS Securities Combined<br />
Al Jazira 9.96% 9.67% 9.83% 29.46%<br />
Al Bilad 1.47% 0.00% 8.25% 9.72%<br />
Samba 1.89% 0.23% 7.02% 9.13%<br />
ANB 0.98% 0.00% 4.00% 4.99%<br />
SABB 0.84% 0.00% 3.60% 4.44%<br />
BSF 1.34% 0.00% 2.64% 3.98%<br />
Riyad 0.10% 0.00% 3.78% 3.88%<br />
Al Rajhi 0.71% 1.07% 0.00% 1.78%<br />
SHB 1.06% 0.00% 0.39% 1.44%<br />
Alinma 0.00% 0.08% 0.74% 0.83%<br />
Source: ASIB Analysis, Financial Reports<br />
Al Jazira is the most correlated to equity markets, where a 10% rise in market prices and volumes<br />
adds on about 20% of EPS accretion (excluding any realisation on AVS securities).<br />
16
August 24, 2012<br />
NET INTEREST MARGINS BOTTOMING<br />
EQUITY RESEARCH<br />
SAUDI BANKS<br />
Saudi banks yields continue to face downward pressure, but reduced cost of funds has minimized the<br />
impact on NIMs, as banks continue to shed their excess liquidity and increase the proportion of demand<br />
deposits. With most of the re-pricing already done, we believe NIMs have reached a stage of stability.<br />
Chart 14: Demand Deposits Proportion of Total Deposits<br />
Source: ASIB Analysis; Financial Reports<br />
While re-pricing of asset yields is unlikely to have a negative effect on NIMs going forward, KSA banks<br />
now have little room to witness a margin uptick coming from lower cost of funds. Most banks used their<br />
cheap sources of funding with demand deposits jumping from 47% of total funding in 2010 to 60%<br />
in June 2012. We also view the increased penetration in syndications as a negative catalyst on NIMs<br />
(syndications typically carry lower yields). Nevertheless, with change in the balance sheet mix into more<br />
lending and retail momentum still occurring, we expect NIMs to be supported from further contraction.<br />
Chart 15: Historical NIM<br />
Source: ASIB Analysis; Financial Reports<br />
Saudi <strong>Bank</strong>s margins can be supported on the upside should lending keep on exceeding deposit<br />
accumulation. With sector’s loan to deposit ratios at 82% and liquid assets to total assets for most<br />
banks below 15%, we believe higher lending provides support for net interest margins.<br />
Table 10: Saudi <strong>Bank</strong>s Liquidity Metrics<br />
LDR Cash & Net interbank to Total Assets<br />
Al Rajhi 82% 12%<br />
BSF 87% 12%<br />
Samba 66% 11%<br />
SABB 82% 14%<br />
SHB 84% 8%<br />
ANB 83% 1%<br />
Riyad 81% 7%<br />
Inma 129% 14%<br />
Al Jazira 72% 16%<br />
Al Bilad 66% 40%<br />
Source: ASIB Analysis; Financial Reports<br />
17
August 24, 2012<br />
EQUITY RESEARCH<br />
SAUDI BANKS<br />
ASSET QUALITY STAYS SOLID<br />
The banks in KSA enjoy one of the best asset quality metrics regionally and globally with the<br />
sector average NPL ratio at 2.1% and the NPL coverage ratio at 147%. The majority of the decline<br />
in provisions has already occurred, paralleled with a sharp drop in past due loans. We believe asset<br />
quality has little room for improvement and is unlikely to be a major catalyst. Risk of asset quality<br />
deterioration is minimal, however there is a possibility of a rise in retail NPLs post the recent high<br />
growth period.<br />
Chart 16: Sector NPL and NPL Coverage<br />
Source: Financial Reports, ASIB Estimates<br />
We compare below the Saudi banks NPL ratios and NPL coverage ratios.<br />
Chart 17: NPL and NPL Coverage ratios<br />
Source: ASIB Analysis; Financial Reports<br />
We forecast the average Saudi banking sector NPL to decline to 1.9% in 2012 and 1.8% in 2013. A<br />
key risk to our projections is a deterioration in cash flow metrics in any high single name exposure.<br />
The current lending limit to a single party is at 25% of invested capital and reserves (previously at<br />
50%), which remains high in global standards and could cause a material effect in the event of any<br />
default.<br />
18
CURRENT PRICE SAR 47.6<br />
FAIR VALUE SAR 62.4<br />
RATING BUY<br />
Stock Data<br />
Ticker SAMBA AB<br />
Price 47.6<br />
Consensus Median Target<br />
Price (SAR)<br />
64.0<br />
Fair Value 62.4<br />
Upside Potential 31%<br />
Market Cap (SAR m) 42,840<br />
Market Cap (USD m) 11,328<br />
Number of Shares (m) 900<br />
August 24, 2012<br />
HIGHLIGHTS<br />
Free Float 51%<br />
Av Monthly Liquidity (SARm) 228<br />
52 week High (SAR) 57.0<br />
Major Shareholders<br />
Name Holding<br />
Public Investment Fund 22.9%<br />
Public Pension Agency 15.0%<br />
GOSI 11.4%<br />
Public<br />
Source: Zawya<br />
50.7%<br />
Relative Share Price Performance<br />
EQUITY RESEARCH<br />
SAUDI BANKS SAMBA<br />
SAMBA: MARKET VALUATION IMPLYING LOWER THAN FORESEEN ROE<br />
Samba’s valuation discount appears excessive if we take into account the recent recovery in loans. We<br />
believe that the share price did not fully reflect the loan growth recovery, nor the upcoming potential.<br />
LOAN GROWTH LAGS THE SECTOR BUT REMAINS STRONG<br />
Samba’s loan growth for the first 6 months of 2012 stood at 7.7% against an average of 10% for the<br />
Saudi peers. Samba has lost market share of new loans over the last 6 months, mainly to NCB, SABB<br />
and Arab National <strong>Bank</strong>. Y-o-Y however, the bank recorded a loan growth of 16.6% in line with peers<br />
average of 16.4%. We expect the bank’s focus on big ticket transactions to keep it among the main<br />
beneficiaries from the improved banking intermediation, especially in the building and construction<br />
sector. Samba can take advantage from its strong corporate relationships, with global banks leaving<br />
a lending supply gap in KSA. With 11% of current mortgages, the bank can also strengthen its growth<br />
with the latest approval of the mortgage law. We expect Samba to grow near the sector average at<br />
15.2% for 2012 and 13.3% for 2013.<br />
EASING PRESSURE ON NIM<br />
Samba’s re-pricing of its investment book has been a major drag in the past on its net interest margin.<br />
NIMs have recently stabilized now that most re-pricing has already occurred. We believe this provides<br />
Samba with an opportunity to generate strong EPS growth as lending picks up and margins bottom.<br />
STRONG FOOTHOLD IN BROKERAGE AND INVESTMENT BANKING<br />
Tadawul’s value traded has fallen by 20% in Q2-12 compared to Q1-12, nevertheless it remains 103%<br />
higher than average levels achieved in 2011. Samba Capital has a strong foothold in brokerage with<br />
9.7% market share. The investment banking arm is also very robust and has competed with global<br />
banks in M&A and ECM transactions.<br />
PROGRESS ON ASSET QUALITY<br />
Recent disclosures have shown an improving asset quality picture. Samba lifted its coverage ratio from<br />
121% in Q2-11 to 130% in Q2-12. The bank’s NPL has been showing improving trend since Q2-11, It<br />
decreased from 3.7% in Q2-11 to 2.4% in Q2-12. Despite this progress, the bank’s NPL is still above the<br />
sector’s average of 2.2%.This said, we believe that asset quality trends are broadly positive.<br />
OPTIMIZED LIQUIDITY/ LENDING MIX<br />
Samba is one of the most liquid banks in the MENA region, with a loan to deposit ratio at 68%. The<br />
bank is being active on optimizing its asset-liability structure. We note that the LTD ratio has moved<br />
from 59% to 68% in one year by mid 2012. Investments as % of total assets decreased from a high of<br />
37% to 28% between Q2-11 and Q2-12.<br />
VALUATION REMAINS CHEAP; REITERATE BUY<br />
In our view, Samba’s valuation gap to the sector average is overdone. The bank now trades at a PB2012E<br />
1.39x and a PE 2012E of 9.3x while generating a return on equity of 15.5%. The market has been harsh<br />
on Samba over the last year and a half, as management’s conservatism has led to lower than peers<br />
loan growth. With this issue now addressed to a certain extent, we believe the bank offers an attractive<br />
risk-reward profile. We re-iterate our buy rating on Samba, and revise our fair value upward from<br />
SAR 59.8 to SAR 62.4.<br />
FINANCIAL DATA<br />
2011 2012e 2013e 2014e<br />
Net Income 4,303 4,583 5,223 5,903<br />
EPS 4.78 5.09 5.80 6.56<br />
P/B (x) 1.52 1.39 1.23 1.13<br />
P/E (x) 9.96 9.35 8.20 7.26<br />
Dividend Yield 3.5% 3.8% 4.0% 4.6%<br />
ROAE 16.1% 15.5% 16.3% 16.9%<br />
NPL Ratio 3.0% 2.4% 2.3% 2.2%<br />
NPL Coverage 124% 132% 138% 142%<br />
19
August 24, 2012<br />
FINANCIALS<br />
EQUITY RESEARCH<br />
SAMBA<br />
Income Statement 2010 2011 2012E 2013E 2014E 2015E 2016E<br />
Net Special Commission Income 4,536 4,376 4,368 4,936 5,553 6,275 7,592<br />
Fee and <strong>Bank</strong>ing Income 1,258 1,399 1,742 1,916 2,089 2,277 2,482<br />
Exchange Income 314 309 344 354 365 376 387<br />
Trading Income 690 355 479 499 519 539 561<br />
Other Income 102 123 133 141 149 158 168<br />
Non Special Commission Income 2,364 2,186 2,698 2,910 3,122 3,350 3,597<br />
Total <strong>Bank</strong>ing Income 6,901 6,562 7,066 7,846 8,674 9,625 11,190<br />
Operating Expenses (1,910) (1,957) (2,087) (2,191) (2,301) (2,416) (2,537)<br />
Operating profit before provisions 4,991 4,605 4,979 5,655 6,373 7,209 8,653<br />
Provision losses on loans& investments (559) (301) (399) (435) (474) (517) (563)<br />
Minority Interest - (1) 3 3 4 4 5<br />
Net Income 4,432 4,303 4,583 5,223 5,903 6,697 8,095<br />
Balance Sheet Summary 2010 2011 2012E 2013E 2014E 2015E 2016E<br />
Cash and due from banks 35,072 36,240 34,061 37,812 43,066 51,138 58,587<br />
Loans and Advances (Net) 80,251 89,111 102,656 116,309 129,452 142,786 156,493<br />
Investments 64,882 60,175 62,582 65,085 67,689 70,396 73,212<br />
Prorperty Plant and Equipment 970 1,169 1,227 1,289 1,353 1,421 1,492<br />
Other Assets 6,240 6,078 6,851 7,366 7,920 8,517 9,160<br />
Total Assets 187,416 192,773 207,377 227,861 249,480 274,259 298,944<br />
Deposits 133,463 137,257 148,238 163,803 180,183 199,102 218,017<br />
Due to <strong>Bank</strong>s 19,801 20,628 21,659 23,392 25,264 27,285 29,467<br />
Debt securities 1,875 - - - - - -<br />
Other liabilities 6,675 6,631 6,963 7,311 7,676 8,060 8,463<br />
Total Liabilities 161,813 164,516 176,860 194,505 213,122 234,447 255,947<br />
Shareholder Equity 25,603 28,257 30,518 33,356 36,358 39,812 42,997<br />
Total Liabilities and Shareholders Equity 187,416 192,773 207,377 227,861 249,480 274,259 298,944<br />
Per Share Data 2010 2011 2012E 2013E 2014E 2015E 2016E<br />
EPS 4.92 4.78 5.09 5.80 6.56 7.44 8.99<br />
DPS 1.65 1.65 1.80 1.90 2.20 2.40 2.90<br />
Growth 2010 2011 2012E 2013E 2014E 2015E 2016E<br />
Total Assets Growth 3.7% 2.9% 7.6% 9.9% 9.5% 9.9% 9.0%<br />
Loans Growth -14.3% 11.0% 15.2% 13.3% 11.3% 10.3% 9.6%<br />
Deposits Growth 9.6% 2.8% 8.0% 10.5% 10.0% 10.5% 9.5%<br />
EPS Growth 2.4% -2.9% 6.5% 14.0% 13.0% 13.4% 20.9%<br />
20
August 24, 2012<br />
FINANCIALS<br />
EQUITY RESEARCH<br />
SAMBA<br />
Balance Sheet Mix 2010 2011 2012E 2013E 2014E 2015E 2016E<br />
Loans to Deposits 60% 65% 69% 71% 72% 72% 72%<br />
Loans/ Assets 43% 46% 50% 51% 52% 52% 52%<br />
Assets/Equity 7.32 6.82 6.80 6.83 6.86 6.89 6.95<br />
(Cash + Interbank) /Assets 19% 19% 16% 17% 17% 19% 20%<br />
Deposits/ Total Funding 82% 83% 84% 84% 85% 85% 85%<br />
Asset Quality 2010 2011 2012E 2013E 2014E 2015E 2016E<br />
NPL Ratio 3.7% 3.0% 2.4% 2.3% 2.2% 2.1% 2.1%<br />
NPL Coverage Ratio 118% 124% 132% 138% 142% 148% 157%<br />
Cost of Risk (% of Gross Loans) 0.65% 0.34% 0.40% 0.37% 0.36% 0.35% 0.34%<br />
Capital Adequacy 2010 2011 2012E 2013E 2014E 2015E 2016E<br />
Tier 1 17.8% 18.0% 18.1% 18.0% 18.1% 18.2% 18.0%<br />
CAR 18.9% 19.0% 19.1% 19.2% 19.3% 19.2% 19.1%<br />
Profitability 2010 2011 2012E 2013E 2014E 2015E 2016E<br />
ROAE 18.5% 16.1% 15.5% 16.3% 16.9% 17.5% 19.6%<br />
ROAA 2.3% 2.3% 2.2% 2.3% 2.4% 2.5% 2.7%<br />
NIM 2.60% 2.61% 2.64% 2.68% 2.71% 2.73% 3.03%<br />
Cost to Income 29.9% 29.8% 29.5% 27.9% 26.5% 25.1% 22.7%<br />
Operating Income Attribution 2010 2011 2012E 2013E 2014E 2015E 2016E<br />
Net Interest Income 66% 67% 62% 63% 64% 65% 68%<br />
Fee Income 18% 21% 25% 24% 24% 24% 22%<br />
Other Income 16% 12% 14% 13% 12% 11% 10%<br />
21
CURRENT PRICE SAR 73.5<br />
FAIR VALUE SAR 95.8<br />
RATING BUY<br />
August 24, 2012<br />
HIGHLIGHTS<br />
Stock Data<br />
Ticker RJHI AB<br />
Price 73.5<br />
Consensus Median Target<br />
Price (SAR)<br />
87.4<br />
Fair Value 95.8<br />
Upside Potential 30%<br />
Market Cap (SAR m) 110,250<br />
Market Cap (USD m) 29,400<br />
Number of Shares (m) 1,500<br />
Free Float 49%<br />
Av Monthly Liquidity (SAR) 1,918<br />
52 week High (SAR) 83.3<br />
Major Shareholders<br />
Name Holding<br />
Suleiman Al Rajhi 19.9%<br />
Saleh Al Rajhi 15.1%<br />
GOSI 9.9%<br />
Abdullah al Rajhi 5.9%<br />
Public 49.2%<br />
Source: Zawya<br />
Relative Share Price Performance<br />
AL RAJHI: VALUATION PREMIUM IS MORE THAN JUSTIFIED<br />
EQUITY RESEARCH<br />
In addition to being the largest Islamic bank in Saudi Arabia and MENA region, Al Rajhi is by far<br />
the most profitable bank in the region, holding the highest ROE within the Saudi <strong>Bank</strong>s. With its<br />
dominant position in the retail market, the bank is consistently delivering strong results. Al Rajhi is<br />
also the best positioned to benefit from interest rates rises.<br />
STRONG GROWTH SUPPORTED BY DUAL NETWORK<br />
As of June 2012, Al Rajhi recorded the highest Y-o-Y and YTD loan growth within the top 7 banks,<br />
coming at 24% and 12.5% respectively. The bank’s strong retail network (more than a third of<br />
Saudi retail market share) has positioned him well to benefit from government spending. On the<br />
corporate and project finance space, the bank has been involved in several syndications such as<br />
Jabal Omar Mecca’s Project, Maaden and potentially a portion of Sadara project financing. On the<br />
downside, competition on retail lending between the banks could slowdown loan growth over the<br />
coming periods or reduce profitability. We forecast a loan growth of 19.3% and 14.2% for 2012 and<br />
2013 respectively.<br />
MARGINS TO REMAIN RELATIVELY STABLE<br />
Q2-12 results showed stable to increasing margins for the Saudi banks. We believe the exit of<br />
foreign banks and increased demand for retail credit has eased the downward pressure on NIMs.<br />
Nevertheless, retail competition remains in place and corporate syndications are in general low<br />
yielding. Furthermore, the loan book will witness further downward re-pricing though the majority<br />
is now re-priced on the new lower yields. We expect a relatively stable NIM for Al Rajhi in the absence<br />
of benchmark rates rises.<br />
FEE GENERATION WELL MANAGED<br />
Al Rajhi’s retail strength has led to solid fee generation. In addition to traditional banking services,<br />
the bank has obtained a niche position in the brokerage and remittance businesses. We believe that<br />
Al Rajhi can sustain strong fee income growth on strong consumer lending growth momentum, as<br />
well as corporate banking related fee income. This said, we expect Al Rajhi’s fees and commissions<br />
yield to remain above sector average.<br />
VALUATION PREMIUM LARGELY REASONABLE<br />
Al Rajhi’s valuation is at a PE 2013E of 11.9x and PB 2012E of 3.27x. While the valuation is at a large<br />
premium to the sector, the bank is trading at an 20% discount to its 5 year average. Driven by its<br />
cheap access to funding, Al Rajh’s ROE is by far the highest in the sector at 24.5% against 15.6% for<br />
the sector. With demand deposits forming 90% of total, the bank is well positioned in later years for<br />
higher ROEs driven by a widening net interest margin. The bank has no material exposure to Europe<br />
or the wholesale markets, hence minimizing contagion risk. In our view, given Al Rajhi’s profile, its<br />
valuation remains attractive, hence we reiterate our Buy rating and revise our fair value upward<br />
from SAR 91.2 to SAR 95.8. Key downside risks to our fair value are the extension of low interest rate<br />
environment and a dimmer global picture weighing on local credit demand.<br />
FINANCIAL DATA<br />
AL RAJHI BANK<br />
2011 2012e 2013e 2014e<br />
Net Income 7,378 8,187 9,297 10,623<br />
EPS 4.29 5.46 6.20 7.08<br />
P/B (x) 3.36 3.27 2.98 2.70<br />
P/E (x) 17.1 13.5 11.9 10.4<br />
Dividend Yield 4.4% 4.8% 5.1% 5.4%<br />
ROAE 23.2% 24.5% 25.6% 26.7%<br />
NPL Ratio 1.7% 1.8% 1.8% 1.8%<br />
NPL Coverage 148% 155% 158% 160%<br />
22
August 24, 2012<br />
FINANCIALS<br />
EQUITY RESEARCH<br />
AL RAJHI BANK<br />
Income Statement 2010 2011 2012E 2013E 2014E 2015E 2016E<br />
Net Special Commission Income 8,861 9,070 9,437 10,475 11,627 12,831 15,461<br />
Fee and <strong>Bank</strong>ing Income 1,634 2,298 2,989 3,288 3,650 4,051 4,659<br />
Exchange Income 637 799 840 890 944 1,000 1,060<br />
Trading Income 250 - - - - - -<br />
Other Income 279 335 398 412 478 512 590<br />
Non Special Commission Income 2,800 3,432 4,227 4,590 5,071 5,563 6,309<br />
Total <strong>Bank</strong>ing Income 11,661 12,502 13,664 15,065 16,699 18,394 21,770<br />
Operating Expenses (2,981) (3,479) (3,704) (3,889) (4,084) (4,288) (4,502)<br />
Operating profit before provisions 8,680 9,023 9,960 11,176 12,615 14,106 17,268<br />
Provision losses on loans& investments (1,909) (1,645) (1,773) (1,879) (1,992) (2,112) (2,238)<br />
Net Income 6,771 7,378 8,187 9,297 10,623 11,995 15,030<br />
Balance Sheet Summary 2010 2011 2012E 2013E 2014E 2015E 2016E<br />
Cash and due from banks 30,593 35,019 32,815 33,489 35,424 38,414 43,405<br />
Loans and Advances (Net) 120,065 140,395 167,491 191,275 216,332 241,859 267,254<br />
Investments 28,887 38,802 37,455 40,451 43,688 47,183 50,957<br />
Prorperty Plant and Equipment 3,395 3,624 3,805 3,995 4,195 4,405 4,625<br />
Other Assets 1,901 2,973 3,152 3,341 3,541 3,754 3,979<br />
Total Assets 184,842 220,813 244,718 272,551 303,180 335,614 370,220<br />
Deposits 143,064 173,429 193,894 217,161 242,786 269,735 298,327<br />
Due to <strong>Bank</strong>s 5,414 7,021 7,442 7,889 8,362 8,864 9,396<br />
Debt securities - - - - - - -<br />
Other liabilities 6,046 7,542 7,919 8,315 8,731 9,167 9,626<br />
Total Liabilities 154,524 187,992 209,255 233,365 259,879 287,766 317,348<br />
Shareholder Equity 30,318 32,821 35,463 39,187 43,301 47,848 52,872<br />
Total Liabilities and Shareholders Equity 184,842 220,813 244,718 272,551 303,180 335,614 370,220<br />
Per Share Data 2010 2011 2012E 2013E 2014E 2015E 2016E<br />
EPS 4.51 4.60 5.46 6.20 7.08 8.00 10.02<br />
DPS 2.75 3.25 3.50 3.75 4.00 4.50 5.00<br />
Growth 2010 2011 2012E 2013E 2014E 2015E 2016E<br />
Total Assets Growth 8.0% 19.5% 10.8% 11.4% 11.2% 10.7% 10.3%<br />
Loans Growth 7.0% 16.9% 19.3% 14.2% 13.1% 11.8% 10.5%<br />
Deposits Growth 16.0% 21.2% 11.8% 12.0% 11.8% 11.1% 10.6%<br />
EPS Growth 0.0% 2.0% 18.7% 13.6% 14.3% 12.9% 25.3%<br />
23
August 24, 2012<br />
FINANCIALS<br />
EQUITY RESEARCH<br />
AL RAJHI BANK<br />
Balance Sheet Mix 2010 2011 2012E 2013E 2014E 2015E 2016E<br />
Loans to Deposits 84% 81% 86% 88% 89% 90% 90%<br />
Loans/ Assets 65% 64% 68% 70% 71% 72% 72%<br />
Assets/Equity 6.8 7.6 7.8 7.9 8.0 8.0 8.2<br />
(Cash + Net Interbank) /Assets 14% 13% 10% 9% 9% 9% 9%<br />
Deposits/ Total Funding 77% 79% 79% 80% 80% 80% 81%<br />
Asset Quality 2010 2011 2012E 2013E 2014E 2015E 2016E<br />
NPL Ratio 2.2% 1.7% 1.8% 1.8% 1.8% 1.7% 1.7%<br />
NPL Coverage Ratio 135.8% 148.0% 155.0% 158.0% 160.0% 163.0% 166.0%<br />
Cost of Risk (% of Gross Loans) 1.59% 1.10% 1.05% 1.00% 0.90% 0.91% 0.90%<br />
Capital Adequacy 2010 2011 2012E 2013E 2014E 2015E 2016E<br />
Tier 1 15.2% 16.3% 15.3% 15.2% 15.2% 15.2% 15.2%<br />
CAR 20.5% 20.5% 19.5% 19.0% 19.1% 19.4% 19.5%<br />
Profitability 2010 2011 2012E 2013E 2014E 2015E 2016E<br />
ROAE 22.5% 23.2% 24.5% 25.6% 26.7% 27.4% 31.9%<br />
ROAA 3.3% 3.2% 3.2% 3.3% 3.4% 3.4% 3.9%<br />
NIM 4.76% 4.63% 4.49% 4.45% 4.43% 4.44% 4.89%<br />
Cost to Income 25.6% 27.8% 27.1% 25.8% 24.5% 23.3% 20.7%<br />
Operating Income Attribution 2010 2011 2012E 2013E 2014E 2015E 2016E<br />
Net Interest Income 76% 73% 69% 70% 70% 70% 71%<br />
Fee Income 14% 18% 22% 22% 22% 22% 21%<br />
Other Income 10% 9% 9% 9% 9% 8% 8%<br />
24
CURRENT PRICE SAR 32.9<br />
FAIR VALUE SAR 38.7<br />
RATING ACCUMULATE<br />
Stock Data<br />
Ticker SABB AB<br />
Price 32.9<br />
Consensus Median Target<br />
Price (SAR)<br />
38.7<br />
Fair Value 38.7<br />
Upside Potential 18%<br />
Market Cap (SAR m) 32,899<br />
August 24, 2012<br />
HIGHLIGHTS<br />
Market Cap (USD m) 8,773<br />
Number of Shares (m) 1,000<br />
Free Float 45%<br />
Av Monthly Liquidity (SAR) 113<br />
52 week High (SAR) 37.2<br />
Major Shareholders<br />
Name Holding<br />
HSBC Holdings 40.0%<br />
Olayan Saudi Investment 16.9%<br />
Company<br />
GOSI 9.5%<br />
Muhaidib and Sons 4.5%<br />
Public<br />
Source: Zawya<br />
29.1%<br />
Relative Share Price Performance<br />
SABB: RAISING FAIR VALUE ON HIGHER PROFITABILITY<br />
EQUITY RESEARCH<br />
After experiencing a sharp deterioration in asset quality in 2009, SABB’s ROE has bounced back on<br />
lower provisioning as well as stronger lending momentum. Moreover, we are witnessing signs of<br />
stabilizaton in the bank’s NIM. Based on the latter, we raise our fair value on SABB from SAR 36.8 to SAR<br />
38.7 and keep an accumulate rating.<br />
ROE TURNS UPWARDS ON BETTER ASSET QUALITY<br />
Pressure on asset quality has eased with the NPL ratio now declining to 1.78% after it reached 4.5%<br />
in 2009. The bank has managed to build solid NPL coverage, rising from 100% in 2009 to 126%<br />
currently. We forecast an NPL ratio of 1.75% for 2013 with an 32 bps cost of risk.<br />
GROWTH ADDS SUPPORT TO THE TOP LINE<br />
SABB is amongst the best positioned to grow in KSA with its strong corporate franchise and solid mortgage<br />
book. Loan growth ended at 11.7% for the first 6 months of 2012 and 18.6%. Y-o-Y, corporate loans account<br />
for 82% of the total loans. Growth in the corporate book has exceeded the sector average recording 16%<br />
over the last 12 months to June 2012. The bank’s solid corporate franchise enables it to be a key player in<br />
the project finance area, where direct government financing is slowing while global banks are reducing<br />
their presence in the local market. SABB was involved in many major syndications recently (eg Maaden,<br />
Tasnee). We forecast a loan growth of 17.4% and 14.2% for 2012 and 2013 respectively.<br />
NIM HAS BOTTOMED<br />
Net interest margin for SABB is starting to improve (5bps Q-o-Q in Q2-12). Y-o-Y Net interest income<br />
has risen by 6.5%. The bank has targeted to contain its cost of funds by increasing its proportion of<br />
demand deposits from 42% as at the end of 2009 to 50% as of June 2012. Re-pricing of the long term<br />
corporate book is mostly done, while retail momentum will help improve asset yields.<br />
STRENGTH IN NON-INTEREST INCOME MAINTAINED<br />
Non-interest income rose by 28% over the past 12 months. SABB is benefiting from a rise in borrowing<br />
appetite and a strong corporate lending foothold. SABB also delivered strong brokerage income,<br />
benefiting from HSBC strong brand name and its track record to in the brokerage business. We note<br />
that previously HSBC plc merged its brokerage business HSBC Saudi Arabia with SABB’s brokerage<br />
arm.<br />
COMFORTABLE LIQUIDITY<br />
With a loan to deposit ratio of almost 80%, relatively in line with sector average, SABB’s balance<br />
sheet remains comfortable. The bank’s liquidity is sufficient to allow the bank to sustain loan growth<br />
momentum, on the corporate as well as on the retail side.<br />
VALUATION PARTIALLY REFLECTS IMPROVED FUNDAMENTALS, MAINTAIN ACCUMULATE<br />
Currently SABB trades at a PE 2013E of 8.6x and PB 2012E of 1.63x. SABB’s valuation is at a premium of<br />
12% to the sector reflecting its improved fundamentals (SABB’s ROE is at 17.1% against 15.6% for its<br />
peers). We keep our Accumulate rating on SABB and revise our fair value upward from SAR 36.8 to<br />
SAR 38.7.<br />
FINANCIAL DATA<br />
SAUDI BRITISH BANK<br />
2011 2012e 2013e 2014e<br />
Net Income 2,888 3,361 3,833 4,454<br />
EPS 2.42 3.36 3.83 4.45<br />
P/B (x) 1.91 1.63 1.45 1.30<br />
P/E (x) 13.6 9.8 8.6 7.4<br />
Dividend Yield 2.1% 3.0% 3.6% 4.6%<br />
ROAE 16.8% 17.1% 17.4% 18.3%<br />
NPL Ratio 1.9% 1.7% 1.7% 1.6%<br />
NPL Coverage 123% 131% 138% 149%<br />
25
August 24, 2012<br />
FINANCIALS<br />
EQUITY RESEARCH<br />
SAUDI BRITISH BANK<br />
Income Statement 2010 2011 2012E 2013E 2014E 2015E 2016E<br />
Net Special Commission Income 3,244 3,022 3,202 3,650 4,107 4,579 5,540<br />
Fee and <strong>Bank</strong>ing Income 1,181 1,215 1,308 1,439 1,696 1,916 2,165<br />
Exchange Income 127 265 244 251 259 267 275<br />
Trading Income 258 308 327 364 383 402 422<br />
Other Income 30 88 55 57 59 62 64<br />
Non Special Commission Income 1,596 1,876 1,934 2,112 2,397 2,646 2,926<br />
Total <strong>Bank</strong>ing Income 4,840 4,898 5,136 5,762 6,503 7,225 8,466<br />
Operating Expenses (1,754) (1,605) (1,590) (1,670) (1,753) (1,841) (1,933)<br />
Operating profit before provisions 3,086 3,293 3,546 4,092 4,750 5,385 6,534<br />
Provision losses on loans& investments (1,243) (469) (295) (330) (370) (397) (448)<br />
Profit/Loss from Associates 41 64 110 71 74 78 82<br />
Net Income 1,884 2,888 3,361 3,833 4,454 5,066 6,167<br />
Balance Sheet Summary 2010 2011 2012E 2013E 2014E 2015E 2016E<br />
Cash and due from banks 22,186 26,728 25,340 26,892 28,733 29,918 31,082<br />
Loans and Advances (Net) 74,248 84,811 99,568 113,707 127,693 141,611 154,923<br />
Investments 24,972 22,200 26,800 29,587 32,664 36,061 39,812<br />
Prorperty Plant and Equipment 559 537 580 609 639 671 705<br />
Other Assets 3,406 4,381 4,294 4,671 5,243 5,883 6,582<br />
Total Assets 125,371 138,657 156,583 175,466 194,972 214,145 233,103<br />
Deposits 94,673 105,577 120,675 136,604 152,996 169,061 184,952<br />
Due to <strong>Bank</strong>s 4,661 5,894 6,189 6,498 6,823 7,164 7,522<br />
Debt securities 5,663 4,150 4,159 4,168 4,177 4,187 4,198<br />
Other liabilities 5,204 5,870 6,164 6,472 6,795 7,135 7,492<br />
Total Liabilities 110,201 121,491 137,185 153,741 170,791 187,547 204,164<br />
Shareholder Equity 15,171 17,166 19,398 21,725 24,180 26,598 28,939<br />
Total Liabilities and Shareholders Equity 125,371 138,657 156,583 175,466 194,972 214,145 233,103<br />
Per Share Data 2010 2011 2012E 2013E 2014E 2015E 2016E<br />
EPS 1.88 2.89 3.36 3.83 4.45 5.07 6.17<br />
DPS - 0.70 1.00 1.20 1.50 1.80 2.25<br />
Growth 2010 2011 2012E 2013E 2014E 2015E 2016E<br />
Total Assets Growth -3.7% 10.6% 12.9% 12.1% 11.1% 9.8% 8.9%<br />
Loans Growth -4.8% 14.2% 17.4% 14.2% 12.3% 10.9% 9.4%<br />
Deposits Growth -3.8% 11.5% 14.3% 13.2% 12.0% 10.5% 9.4%<br />
EPS Growth -30.5% 53.3% 16.4% 14.0% 16.2% 13.7% 21.7%<br />
26
August 24, 2012<br />
FINANCIALS<br />
EQUITY RESEARCH<br />
SAUDI BRITISH BANK<br />
Balance Sheet Mix 2010 2011 2012E 2013E 2014E 2015E 2016E<br />
Loans to Deposits 78% 80% 83% 83% 83% 84% 84%<br />
Loans/ Assets 59% 61% 64% 65% 65% 66% 66%<br />
Assets/Equity 8.58 8.35 8.35 8.35 8.34 8.32 8.33<br />
(Cash + Net Interbank) /Assets 14% 15% 12% 12% 11% 11% 10%<br />
Deposits/ Total Funding 76% 76% 77% 78% 78% 79% 79%<br />
Asset Quality 2010 2011 2012E 2013E 2014E 2015E 2016E<br />
NPL Ratio 3.4% 1.9% 1.7% 1.7% 1.6% 1.5% 1.4%<br />
NPL Coverage Ratio 100.0% 123.0% 131.0% 138.0% 149.0% 155.0% 163.0%<br />
Cost of Risk (% of Gross Loans) 1.58% 0.58% 0.33% 0.32% 0.32% 0.30% 0.30%<br />
Capital Adequacy 2010 2011 2012E 2013E 2014E 2015E 2016E<br />
Tier 1 12.5% 11.8% 12.1% 12.2% 12.3% 12.3% 12.3%<br />
CAR 14.7% 14.7% 15.0% 15.1% 15.2% 15.4% 15.5%<br />
Profitability 2010 2011 2012E 2013E 2014E 2015E 2016E<br />
ROAE 12.3% 16.8% 17.1% 17.4% 18.3% 18.8% 21.2%<br />
ROAA 1.3% 1.9% 2.1% 2.1% 2.2% 2.3% 2.5%<br />
NIM 2.6% 2.5% 2.5% 2.6% 2.7% 2.8% 3.1%<br />
Cost to Income 36.2% 32.8% 31.0% 29.0% 27.0% 25.5% 22.8%<br />
Operating Income Attribution 2010 2011 2012E 2013E 2014E 2015E 2016E<br />
Net Interest Income 67% 62% 62% 63% 63% 63% 65%<br />
Fee Income 24% 25% 25% 25% 26% 27% 26%<br />
Other Income 9% 13% 12% 12% 11% 10% 9%<br />
27
CURRENT PRICE SAR 32.9<br />
FAIR VALUE SAR 41.2<br />
RATING ACCUMULATE<br />
Stock Data<br />
Ticker BSFR AB<br />
Price 32.9<br />
Consensus Median Target<br />
Price (SAR)<br />
41.1<br />
Fair Value 41.2<br />
Upside Potential 25%<br />
Market Cap (SAR m) 29,742<br />
Market Cap (USD m) 7,931<br />
Number of Shares (m) 904<br />
Free Float 45%<br />
Av Monthly Liquidity (SAR) 113<br />
52 week High (SAR) 40.6<br />
August 24, 2012<br />
HIGHLIGHTS<br />
Major Shareholders<br />
Name Holding<br />
Credit Agricole 31.1%<br />
GOSI 12.8%<br />
Rashed Al Rashed 9.8%<br />
Mohamed Issa 5.0%<br />
Public<br />
Source: Zawya<br />
30.4%<br />
Relative Share Price Performance<br />
BSF: ATTRACTIVE RETAIL - CORPORATE MIX<br />
EQUITY RESEARCH<br />
With its strong corporate franchise and growing retail market share, BSF is well placed to benefit for<br />
the recovery in the corporate credit demand, as well as from the growing retail lending.<br />
FOCUS BACK ON CORPORATE LENDING<br />
Aside from its recent expansion in retail, BSF has managed to obtain a sizeable market share in<br />
corporate lending 14% of total corporate loans. The bank’s corporate loan book grew by 1% over<br />
the last 6 months and 10% over the last year. On the other hand, the retail book grew by 18% Y-o-Y.<br />
The retail loan book contribution to the total loan book (at 10%) remains well below the sector average.<br />
Saudi Fransi managed to ride the lending wave, growing by 9.4% over the last 6 months and<br />
18.5% Y-o-Y. We believe BSF will continue to leverage on its corporate franchise and benefit from<br />
the gradual pull-out of global banks from the Saudi market. Recently, BSF has been active in several<br />
major syndications with Marafiq Company, Zain KSA and potentially a portion of the Sadara Project<br />
financing. We forecast a loan growth of 15.4% and 13.7% for BSF for 2012 and 2013 respectively.<br />
SUKUK ISSUE IMPROVES FUNDING STRUCTURE<br />
In April 2012, BSF launched a $2 billion Sukuk program, the first program to be established by a<br />
Saudi bank, listed on the London Stock Exchange. Under the program, the bank launched its first<br />
issue of $750mn at a spread of 185 basis points over midswaps. The issuance attracted orders worth<br />
$4 billion. We view this as a welcomed diversification of funding, where the bank’s reliance on short<br />
term deposits will be reduced. The longer term nature of this funding will also serve BSF to target<br />
the mortgage market more aggressively, with the legal aspects of home lending now on the path<br />
of being resolved.<br />
BROKERAGE ADDS SUPPORT TO ROE<br />
Fransi Tadawul has 9% market share of the Saudi brokerage market. Q1-12 non interest income rose<br />
by 29% Q-o-Q partially due to higher brokerage fees. We believe BSF strong position in the brokerage<br />
market could help it improve its ROE in times of rising trading volumes.<br />
ASSET QUALITY REMAINS ROBUST<br />
The bank’s asset quality remains among the best in the sector. Provisions for Q2-12 stayed<br />
consistently low at SAR 23m. The NPL ratio remains the lowest in the sector at 1.23% against sector<br />
average NPL of 2.2%. We estimate the bank’s NPL to remain at such levels over the short to medium<br />
term. BSF’s NPL coverage stayed solid at 129% though lower than peers average at 133%. We believe<br />
BSF’s superior asset quality remains a core differentiating factor to its peers. At the same time, we<br />
acknowledge the fact that there’s little room for BSF to witness a major improvement in its bottom<br />
line from further drops in provisioning, as the bank already maintains one of the cleanest balance<br />
sheets in the sector.<br />
NON-DEMANDING VALUATION<br />
The bank trades at PE 2013E of 8.2x PB 2012E of 1.33x, we believe that the valuation is certainly<br />
tempting at this point with an 14% discount to MENA peers and 9% discount to Saudi peers. Our fair<br />
value on BSF to SAR 41.2 and assign an Accumulate rating.<br />
FINANCIAL DATA<br />
BANQUE SAUDI FRANSI<br />
2011 2012e 2013e 2014e<br />
Net Income (SAR million) 2,927 3,111 3,607 4,128<br />
EPS (SAR) 3.24 3.44 3.99 4.57<br />
P/B (X) 1.51 1.33 1.19 1.08<br />
P/E (X) 10.1 9.5 8.2 7.2<br />
Dividend Yield 3.0% 3.6% 4.1% 4.6%<br />
ROAE (%) 14.9% 15.3% 15.7% 15.8%<br />
NPL Ratio 1.1% 1.2% 1.3% 1.2%<br />
NPL Coverage 147% 136% 143% 148%<br />
28
August 24, 2012<br />
FINANCIALS<br />
EQUITY RESEARCH<br />
BANQUE SAUDI FRANSI<br />
Income Statement 2010 2011 2012E 2013E 2014E 2015E 2016E<br />
Net Special Commission Income 3,066 3,137 3,303 3,759 4,210 4,698 5,567<br />
Fee and <strong>Bank</strong>ing Income 887 1,050 1,233 1,470 1,646 1,841 2,053<br />
Exchange Income 200 220 225 220 220 220 220<br />
Trading Income 221 147 179 184 190 196 201<br />
Other Income 20 30 35 39 44 54 65<br />
Non Special Commission Income 1,328 1,447 1,672 1,913 2,100 2,310 2,540<br />
Total <strong>Bank</strong>ing Income 4,394 4,584 4,975 5,672 6,310 7,009 8,108<br />
Operating Expenses (1,259) (1,499) (1,551) (1,729) (1,816) (1,906) (2,002)<br />
Operating profit before provisions 3,135 3,085 3,424 3,943 4,494 5,102 6,106<br />
Provision losses on loans& investments (339) (158) (297) (324) (353) (385) (419)<br />
Profit/Loss from Associates 4 - (5) - - - -<br />
Minority Interest - - (10) (12) (13) (17) (21)<br />
Net Income 2,800 2,927 3,111 3,607 4,128 4,701 5,666<br />
Balance Sheet Summary 2010 2011 2012E 2013E 2014E 2015E 2016E<br />
Cash and due from banks 16,056 25,125 13,883 15,133 17,874 21,529 25,978<br />
Loans and Advances (Net) 80,976 92,325 106,543 121,139 135,434 150,332 164,312<br />
Investments 19,841 16,669 21,670 22,970 24,348 25,809 27,357<br />
Prorperty Plant and Equipment 586 581 610 641 673 706 742<br />
Other Assets 5,757 5,780 6,069 6,372 6,691 7,026 7,377<br />
Total Assets 123,218 140,480 148,774 166,255 185,019 205,401 225,767<br />
Deposits 93,529 109,963 115,461 129,894 145,481 162,211 178,433<br />
Due to <strong>Bank</strong>s 2,313 2,064 2,167 2,297 2,435 2,581 2,736<br />
Debt securities 4,894 4,230 4,318 4,411 4,509 4,611 4,718<br />
Other liabilities 4,459 4,567 4,841 5,131 5,439 5,766 6,112<br />
Total Liabilities 105,195 120,824 126,788 141,734 157,864 175,169 191,998<br />
Shareholder Equity 18,023 19,655 21,987 24,522 27,155 30,232 33,768<br />
Total Liabilities and Shareholders Equity 123,218 140,480 148,774 166,255 185,019 205,401 225,767<br />
Per Share Data 2010 2011 2012E 2013E 2014E 2015E 2016E<br />
EPS 3.10 3.24 3.44 3.99 4.57 5.20 6.27<br />
DPS 1.10 1.00 1.20 1.35 1.50 1.85 2.25<br />
Growth 2010 2011 2012E 2013E 2014E 2015E 2016E<br />
Total Assets Growth 2.0% 14.0% 5.9% 11.7% 11.3% 11.0% 9.9%<br />
Loans Growth 3.0% 14.0% 15.4% 13.7% 11.8% 11.0% 9.3%<br />
Deposits Growth 3.0% 17.6% 5.0% 12.5% 12.0% 11.5% 10.0%<br />
EPS Growth 13.0% 4.5% 6.3% 15.9% 14.4% 13.9% 20.5%<br />
29
August 24, 2012<br />
FINANCIALS<br />
EQUITY RESEARCH<br />
BANQUE SAUDI FRANSI<br />
Balance Sheet Mix 2010 2011 2012E 2013E 2014E 2015E 2016E<br />
Loans to Deposits 87% 84% 92% 93% 93% 93% 92%<br />
Loans/ Assets 66% 66% 72% 73% 73% 73% 73%<br />
Assets/Equity 6.84 7.15 6.77 6.78 6.81 6.79 6.69<br />
(Cash + Net Interbank) /Assets 11% 16% 8% 8% 8% 9% 10%<br />
Deposits/ Total Funding 76% 78% 78% 78% 79% 79% 79%<br />
Asset Quality 2010 2011 2012E 2013E 2014E 2015E 2016E<br />
NPL Ratio 1.27% 1.10% 1.18% 1.25% 1.24% 1.25% 1.21%<br />
NPL Coverage Ratio 126% 147% 136% 143% 148% 151% 155%<br />
Cost of Risk (% of Gross Loans) 0.71% 0.18% 0.21% 0.21% 0.22% 0.25% 0.25%<br />
Capital Adequacy 2010 2011 2012E 2013E 2014E 2015E 2016E<br />
Tier 1 13.9% 13.9% 14.0% 14.2% 14.4% 14.4% 14.4%<br />
CAR 13.7% 14.5% 14.7% 15.1% 15.2% 15.2% 15.2%<br />
Profitability 2010 2011 2012E 2013E 2014E 2015E 2016E<br />
ROAE 15.1% 14.9% 15.3% 15.7% 15.8% 16.5% 18.6%<br />
ROAA 1.7% 2.0% 2.0% 2.1% 2.2% 2.2% 2.5%<br />
NIM 2.65% 2.61% 2.64% 2.63% 2.65% 2.73% 3.01%<br />
Cost to Income 27.0% 28.4% 31.9% 30.1% 28.3% 25.0% 22.2%<br />
Operating Income Attribution 2010 2011 2012E 2013E 2014E 2015E 2016E<br />
Net Interest Income 70% 68% 66% 66% 67% 67% 69%<br />
Fee Income 20% 23% 25% 26% 26% 26% 25%<br />
Other Income 10% 9% 9% 8% 7% 7% 6%<br />
30
CURRENT PRICE SAR 23.0<br />
FAIR VALUE SAR 28.4<br />
RATING ACCUMULATE<br />
Stock Data<br />
Ticker RIBL AB<br />
Price 23.0<br />
Consensus Median Target<br />
Price (SAR)<br />
28.8<br />
Fair Value 28.4<br />
Upside Potential 23%<br />
Market Cap (SAR m) 34,500<br />
August 24, 2012<br />
HIGHLIGHTS<br />
Market Cap (USD m) 9,200<br />
Number of Shares (m) 1,500<br />
Free Float 48%<br />
Av Monthly Liquidity (SAR) 380<br />
52 week High (SAR) 27.2<br />
Major Shareholders<br />
Name Holding<br />
Public Investment Fund 21.7%<br />
GOSI 21.6%<br />
Abdulrahman Sharabtly 9.7%<br />
AL Nahla Group 9.3%<br />
Mohammed Issa 8.6%<br />
SAMA 6.5%<br />
Public<br />
Source: Zawya<br />
22.6%<br />
Relative Share Price Performance<br />
RIYAD BANK: LAGGING ON LOAN GROWTH<br />
EQUITY RESEARCH<br />
Riyad <strong>Bank</strong> has lagged competitors on loan growth over the last period. Loans grew by 1.9% over<br />
the last 6 months to June 2012 and 4.2% Y-o-Y, while peers grew by 10.0% and 16.4% respectively<br />
for the same periods of time.<br />
LOAN GROWTH LACKING MOMENTUM<br />
Riyad bank has failed to catch up with peers on loan growth. Among the largest 10 Saudi banks,<br />
the bank’s market share declined from 13.7% to 12.2%. Market share of new loans did not impress,<br />
with the bank only gaining 2.5% of the total pie in the first half of 2012, despite its large scale<br />
and sizeable retail network of 248 branches. We expect Riyad <strong>Bank</strong> to catch up with peers going<br />
forward as the bank has showed resilience in the past. Riyad bank was not absent from large<br />
syndications recently, citing Maaden and potentially the Aramco – Dow Chemical deal. In general<br />
retail growth has been more impressive than corporate growth by growing by 21% Y-o-Y against<br />
an almost flat corporate book. In fact, the bank has increased its focus on growing its consumer<br />
loan book, which led to market share gains in the retail lending despite a decline in market share<br />
in total lending. We forecast a loan growth of 8.9% and 12.7% for 2012 and 2013.<br />
NON INTEREST INCOME LIKELY TO REMAIN RESILIENT<br />
Non interest income for the first half of 2012 witnessed some potentially non-recurring items,<br />
such as gain on sale of AVS investments (down 14% Q-o-Q), and rising brokerage income. While<br />
we are not expecting a repetition of Q1-12 Tadawul’s volumes, we still believe they will exceed<br />
the levels achieved in 2011. In addition, the investment bank has strengthened its foothold in the<br />
project finance area, by advising on the mega scale Sadara project.<br />
HIGH PROVISIONS CAP ROE<br />
Provisions for Riyad <strong>Bank</strong> remained high in the first half of 2012. The bank’s NPL and NPL coverage<br />
stood at 1.78% and 98% respectively, however with large provisions taken in Q2-12 , it is likely<br />
that the bank has boosted its coverage to be more in line with peers (average of 140% for our<br />
covered universe). While provisions will drag ROE over the short term, we believe additional NPL<br />
coverage will support the bank to boost its profitability later on. However, ROE will remain below<br />
sector level (12% against 16%) due to the excess capital in the business. Riyad bank’s leverage is<br />
at 6 times vs 7 times average for the sector.<br />
BELOW SECTOR VALUATION DUE TO WEAKER GROWTH AND ROE<br />
Riyad bank trades at a PE 2012E of 9.4x a PB 2012E of 1.10x, due to lower ROE. Despite the fact<br />
that the bank has gained market share in the retail lending, we believe that ROE improvement<br />
will unlikely take place in a relatively slow loan growth environment. Upside risk is a strong turnaround<br />
in loan growth, hence catching up with peers. Given the discounted valuation, our rating<br />
on Riyad <strong>Bank</strong> is Accumulate with a fair value of SAR 28.4.<br />
FINANCIAL DATA<br />
2011 2012e 2013e 2014e<br />
Net Income 3,149 3,677 4,242 4,912<br />
EPS 1.96 2.45 2.83 3.27<br />
P/B (x) 1.14 1.10 1.06 1.00<br />
P/E (x) 11.7 9.4 8.1 7.0<br />
RIYAD BANK<br />
Dividend Yield 5.7% 5.0% 5.8% 6.7%<br />
ROAE 10.4% 11.6% 12.8% 14.0%<br />
NPL Ratio 1.6% 1.6% 1.5% 1.5%<br />
NPL Coverage 106% 109% 124% 136%<br />
31
August 24, 2012<br />
FINANCIALS<br />
EQUITY RESEARCH<br />
RIYAD BANK<br />
Income Statement 2010 2011 2012E 2013E 2014E 2015E 2016E<br />
Net Special Commission Income 4,142 4,197 4,404 4,888 5,460 6,170 7,373<br />
Fee and <strong>Bank</strong>ing Income 1,418 1,589 2,051 2,236 2,482 2,829 3,225<br />
Exchange Income 231 279 296 313 332 352 373<br />
Trading Income 124 145 154 163 173 183 194<br />
Other Income 65 111 53 85 97 119 145<br />
Non Special Commission Income 1,838 2,124 2,553 2,797 3,083 3,484 3,937<br />
Total <strong>Bank</strong>ing Income 5,980 6,321 6,957 7,686 8,544 9,654 11,311<br />
Operating Expenses (2,304) (2,510) (2,559) (2,687) (2,821) (2,962) (3,110)<br />
Operating Profit Before Provisions 3,676 3,811 4,398 4,999 5,722 6,691 8,200<br />
Provision losses on loans& investments (850) (662) (721) (757) (810) (867) (927)<br />
Profit/Loss from Associates - - - - - - -<br />
Minority Interest - - - - - - -<br />
Net Income 2,826 3,149 3,677 4,242 4,912 5,825 7,273<br />
Balance Sheet Summary 2010 2011 2012E 2013E 2014E 2015E 2016E<br />
Cash and due from banks 27,868 23,708 16,762 19,257 22,535 24,819 28,357<br />
Loans and Advances (Net) 106,035 112,973 123,068 138,698 154,925 171,657 187,621<br />
Investments 33,822 36,616 39,421 41,589 43,877 46,290 48,836<br />
Prorperty Plant and Equipment 1,863 1,807 1,933 2,049 2,172 2,303 2,441<br />
Other Assets 3,969 5,783 6,034 6,336 6,652 6,985 7,334<br />
Total Assets 173,557 180,887 187,218 207,929 230,162 252,054 274,589<br />
Deposits 126,945 139,822 143,400 161,038 180,041 198,045 215,869<br />
Due to <strong>Bank</strong>s 10,637 6,242 6,804 7,416 8,084 8,811 9,604<br />
Debt securities 1,874 - - - - - -<br />
Other liabilities 4,867 4,665 5,132 5,645 6,209 6,830 7,513<br />
Total Liabilities 144,323 150,729 155,335 174,099 194,333 213,686 232,986<br />
Shareholder Equity 29,234 30,158 31,883 33,830 35,829 38,368 41,603<br />
Total Liabilities and Shareholders Equity 173,557 180,887 187,218 207,929 230,162 252,054 274,589<br />
Per Share Data 2010 2011 2012E 2013E 2014E 2015E 2016E<br />
EPS 1.88 2.10 2.45 2.83 3.27 3.88 4.85<br />
DPS 1.30 1.30 1.15 1.35 1.55 1.85 2.20<br />
Growth 2010 2011 2012E 2013E 2014E 2015E 2016E<br />
Total Assets Growth 10.5% 4.2% 3.5% 11.1% 10.7% 9.5% 8.9%<br />
Loans Growth 10.5% 6.5% 8.9% 12.7% 11.7% 10.8% 9.3%<br />
Deposits Growth 19.2% 10.1% 2.6% 12.3% 11.8% 10.0% 9.0%<br />
EPS Growth -0.5% 11.4% 16.8% 15.3% 15.8% 18.6% 24.9%<br />
32
August 24, 2012<br />
FINANCIALS<br />
EQUITY RESEARCH<br />
RIYAD BANK<br />
Balance Sheet Mix 2010 2011 2012E 2013E 2014E 2015E 2016E<br />
Loans to Deposits 84% 81% 82% 83% 85% 85% 86%<br />
Loans/ Assets 61% 62% 64% 66% 67% 69% 69%<br />
Assets/Equity 6.17 6.26 6.14 6.45 6.78 6.97 7.07<br />
(Cash + Net Interbank) /Assets 10% 10% 5% 6% 6% 6% 7%<br />
Deposits/ Total Funding 73% 77% 77% 77% 78% 79% 79%<br />
Asset Quality 2010 2011 2012E 2013E 2014E 2015E 2016E<br />
NPL Ratio 1.2% 1.6% 1.6% 1.5% 1.5% 1.5% 1.4%<br />
NPL Coverage Ratio 140% 106% 109% 124% 136% 144% 156%<br />
Cost of Risk (% of Gross Loans) 0.60% 0.86% 0.56% 0.48% 0.46% 0.45% 0.43%<br />
Capital Adequacy 2010 2011 2012E 2013E 2014E 2015E 2016E<br />
Tier 1 15.8% 14.5% 14.6% 14.8% 14.9% 14.9% 14.9%<br />
CAR 18.3% 18.2% 18.3% 18.3% 18.4% 18.4% 18.4%<br />
Profitability 2010 2011 2012E 2013E 2014E 2015E 2016E<br />
ROAE 11.4% 10.4% 11.6% 12.8% 14.0% 15.8% 18.5%<br />
ROAA 1.8% 1.7% 1.9% 2.0% 2.1% 2.3% 2.6%<br />
NIM 2.70% 2.50% 2.63% 2.64% 2.67% 2.70% 3.03%<br />
Cost to Income 38.5% 39.7% 36.8% 35.0% 33.0% 30.7% 27.5%<br />
Operating Income Attribution 2010 2011 2012E 2013E 2014E 2015E 2016E<br />
Net Interest Income 69% 66% 63% 64% 64% 64% 65%<br />
Fee Income 24% 25% 29% 29% 29% 29% 29%<br />
Other Income 7% 8% 7% 7% 7% 7% 6%<br />
33
CURRENT PRICE SAR 29.0<br />
FAIR VALUE SAR 36.4<br />
RATING ACCUMULATE<br />
Stock Data<br />
Ticker ARNB AB<br />
Price 29.0<br />
Consensus Median Target<br />
Price (SAR)<br />
33.5<br />
Fair Value 36.4<br />
August 24, 2012<br />
HIGHLIGHTS<br />
Upside Potential 26%<br />
Market Cap (SAR m) 24,694<br />
Market Cap (USD m) 6,585<br />
Number of Shares (m) 852<br />
Free Float 34%<br />
Av Monthly Liquidity (SAR) 89<br />
52 week High (SAR) 34.1<br />
Major Shareholders<br />
Name Holding<br />
Arab <strong>Bank</strong> 40.0%<br />
GOSI 10.8%<br />
Rashed Al Rashed 9.9%<br />
Al Jabr Trading Company 5.6%<br />
Public<br />
Source: Zawya<br />
33.7%<br />
Relative Share Price Performance<br />
ANB: ATTRACTIVE COMBINATION OF GROWTH AND VALUE<br />
EQUITY RESEARCH<br />
Arab National <strong>Bank</strong> remains a key player in the KSA banking sector. The bank strong retail franchise<br />
is supported by a broad branch network of 144 branches. ANB’s asset quality concerns have been<br />
dealt with and the bank has now moved to growth mode recording a loan growth of 10.8% over the<br />
last 6 months and 16.9% Y-o-Y as of 30 June 2012. We forecast earnings to increase by 18% and 13%<br />
for 2012 and 2013 respectively.<br />
LOAN GROWTH BACK IN LINE WITH SECTOR<br />
We forecast loan growth to reach 17.7% for ANB for 2012 and 13.5% in 2013. We believe the bank’s<br />
strong retail network and largely improved asset quality will support it to build up momentum in<br />
lending going forward. Recently, ANB has showed strength in the corporate lending space with<br />
corporate loans rising by 12% over the last 6 months and 20% Y-o-Y. ANB was involved in several<br />
big-ticket lending transactions such as Maaden syndication, Zain KSA refinancing and Medina<br />
Airport privatization project with TAV Airports of Turkey. On the retail front, the bank recorded a<br />
Y-o-Y growth of 15%, benefiting from increased government spending and rising employee salaries<br />
in KSA. The bank is capable of leveraging on its retail franchise to improve its market share<br />
in mortgage lending with the new approval of the mortgage loans. ANB’s current market share is<br />
only at 2.7% of total mortgage loans.<br />
NORMALIZING PROVISIONS<br />
ANB witnessed a major improvement in its asset quality after it incurred hefty provisions in Q4-11.<br />
The NPL ratio as at the end of Q1-12 stands at 2.13%, the bank has built a strong cushion of NPL<br />
coverage, reaching 158%. In our view, the improved asset quality profile will help ANB converge<br />
its ROE to be more in line with the sector going forward. We forecast cost of risk to decline to<br />
41bps in 2012, while we believe the NPL will level at 2.8%.<br />
NIM TO IMPROVE GOING FORWARD<br />
ANB’s net interest margin witnessed a major improvement in Q2-12 after retreating earlier on.<br />
The loan to deposit ratio has increased to 85% from 82% the year before. Competitive pricing on<br />
corporate loans has eased with the global banks reducing their exposure in the MENA region as<br />
pressure on capital ratios builds up. We estimate NIM to end at 2.82% for 2012 and improve to<br />
2.84% in 2013.<br />
RISING NON-INTEREST INCOME<br />
ANB revealed relative strength in fee and banking income, rising 12 % Y-o-Y in the first 6 months<br />
of 2012. While part of this is attributed to rising trading volumes, we believe a major part of the<br />
improvement is due to strength in fee income from banking activities (brokerage income accounted<br />
to 2.2% of total operating income at the end of 2011).<br />
VALUATION<br />
Arab National <strong>Bank</strong> is valued at a PB 2012E of 1.40x, a discount of 10% to regional peers. ANB<br />
trades at PE 2012E of 9.5x and PE 2013 of 8.4x. We assign an Accumulate on ANB with 26% upside<br />
potential.<br />
FINANCIAL DATA<br />
ARAB NATIONAL BANK<br />
2011 2012e 2013e 2014e<br />
Net Income 2,170 2,577 2,921 3,305<br />
EPS 2.55 3.03 3.43 3.88<br />
P/B (x) 1.44 1.40 1.27 1.16<br />
P/E (x) 11.3 9.5 8.4 7.4<br />
Dividend Yield 2.6% 3.4% 3.8% 4.3%<br />
ROAE 11.0% 14.3% 14.6% 15.1%<br />
NPL Ratio 2.4% 2.1% 2.1% 2.0%<br />
NPL Coverage 146% 151% 150% 155%<br />
34
August 24, 2012<br />
FINANCIALS<br />
EQUITY RESEARCH<br />
ARAB NATIONAL BANK<br />
Income Statement 2010 2011 2012E 2013E 2014E 2015E 2016E<br />
Net Special Commission Income 3,157 3,181 3,229 3,570 3,944 4,378 5,166<br />
Fee and <strong>Bank</strong>ing Income 545 727 875 963 1,059 1,143 1,235<br />
Exchange Income 323 323 333 350 367 385 405<br />
Trading Income 358 180 191 202 214 227 241<br />
Other Income 122 130 143 157 173 190 209<br />
Non Special Commission Income 1,348 1,360 1,542 1,672 1,813 1,947 2,090<br />
Total <strong>Bank</strong>ing Income 4,505 4,541 4,771 5,241 5,758 6,325 7,256<br />
Operating Expenses (1,645) (1,775) (1,874) (1,977) (2,086) (2,201) (2,322)<br />
Operating Profit Before Provisions 2,860 2,766 2,897 3,264 3,672 4,124 4,935<br />
Provision losses on loans& investments (964) (618) (346) (370) (396) (424) (454)<br />
Profit/Loss from Associates 13 22 26 27 29 33 35<br />
Minority Interest 3 - - - - - -<br />
Net Income 1,912 2,170 2,577 2,921 3,305 3,733 4,516<br />
Balance Sheet Summary 2010 2011 2012E 2013E 2014E 2015E 2016E<br />
Cash and due from banks 13,378 14,925 15,971 18,470 20,116 21,917 24,475<br />
Loans and Advances (Net) 66,203 72,844 85,703 97,273 108,751 121,040 133,265<br />
Investments 32,841 26,082 25,439 26,965 28,583 30,298 32,116<br />
Prorperty Plant and Equipment 1,261 1,284 1,344 1,411 1,482 1,556 1,634<br />
Other Assets 2,351 2,439 2,549 2,663 2,783 2,909 3,039<br />
Total Assets 116,034 117,574 131,005 146,783 161,716 177,720 194,530<br />
Deposits 84,199 87,859 99,523 110,968 123,175 136,108 149,719<br />
Due to <strong>Bank</strong>s 12,097 8,824 9,765 11,423 12,777 13,671 14,628<br />
Debt securities 1,688 1,688 1,688 1,688 1,688 1,688 1,688<br />
Other liabilities 2,655 2,474 2,598 2,728 2,864 3,007 3,158<br />
Total Liabilities 100,639 100,845 113,574 126,807 140,504 154,475 169,193<br />
Shareholder Equity 15,396 16,729 17,432 19,976 21,212 23,245 25,337<br />
Total Liabilities and Shareholders Equity 116,035 117,574 131,005 146,783 161,716 177,720 194,530<br />
Per Share Data 2010 2011 2012E 2013E 2014E 2015E 2016E<br />
EPS 2.25 2.55 3.03 3.43 3.88 4.38 5.30<br />
DPS 0.60 0.75 1.00 1.10 1.25 1.40 1.85<br />
Growth 2010 2011 2012E 2013E 2014E 2015E 2016E<br />
Total Assets Growth 5% 1% 11% 12% 10% 10% 9%<br />
Loans Growth -1.0% 10.0% 17.7% 13.5% 11.8% 11.3% 10.1%<br />
Deposits Growth 2% 4% 13% 12% 11% 11% 10%<br />
EPS Growth -19% 13% 19% 13% 13% 13% 21%<br />
35
August 24, 2012<br />
FINANCIALS<br />
EQUITY RESEARCH<br />
ARAB NATIONAL BANK<br />
Balance Sheet Mix 2010 2011 2012E 2013E 2014E 2015E 2016E<br />
Loans to Deposits 79% 83% 86% 88% 88% 89% 89%<br />
Loans/ Assets 57% 62% 65% 66% 67% 68% 69%<br />
Assets/Equity 7.54 7.03 8.12 7.93 8.27 8.31 8.43<br />
(Cash + Net Interbank) /Assets 1% 5% 5% 5% 5% 5% 5%<br />
Deposits/ Total Funding 73% 75% 76% 76% 76% 77% 77%<br />
Asset Quality 2010 2011 2012E 2013E 2014E 2015E 2016E<br />
NPL Ratio 2.8% 3.0% 2.8% 2.6% 2.5% 2.5% 2.5%<br />
NPL Coverage Ratio 75% 108% 110% 112% 111% 112.% 110%<br />
Cost of Risk (% of Gross Loans) 0.73% 1.41% 0.41% 0.32% 0.31% 0.31% 0.31%<br />
Capital Adequacy 2010 2011 2012E 2013E 2014E 2015E 2016E<br />
Tier 1 15.1% 15.0% 15.1% 15.1% 15.2% 15.3% 15.3%<br />
CAR 17.0% 16.5% 16.4% 16.3% 16.2% 16.3% 16.3%<br />
Profitability 2010 2011 2012E 2013E 2014E 2015E 2016E<br />
ROAE 11.0% 11.0% 14.3% 14.6% 15.1% 15.9% 17.9%<br />
ROAA 1.4% 1.5% 1.8% 1.8% 1.9% 1.9% 2.1%<br />
NIM 2.90% 2.80% 2.82% 2.84% 2.83% 2.85% 3.13%<br />
Cost to Income 36.5% 39.1% 39.3% 37.7% 36.2% 34.8% 32.0%<br />
Operating Income Attribution 2010 2011 2012E 2013E 2014E 2015E 2016E<br />
Net Interest Income 70% 70% 68% 68% 69% 69% 71%<br />
Fee Income 12% 16% 18% 18% 18% 18% 17%<br />
Other Income 18% 14% 14% 14% 13% 13% 12%<br />
36
CURRENT PRICE SAR 27.5<br />
FAIR VALUE SAR 32.1<br />
RATING ACCUMULATE<br />
Stock Data<br />
Ticker AAAL AB<br />
Price 27.5<br />
Consensus Median Target<br />
Price (SAR)<br />
31.1<br />
Fair Value 32.1<br />
Upside Potential 17%<br />
Market Cap (SAR m) 10,915<br />
Market Cap (USD m) 2,911<br />
Number of Shares (m) 397<br />
Free Float 50%<br />
Av Monthly Liquidity (SAR) 61<br />
52 week High (SAR) 29.7<br />
August 24, 2012<br />
HIGHLIGHTS<br />
Major Shareholders<br />
Name Holding<br />
ABN Amro 39.9%<br />
Olayan Saudi Investment<br />
Company<br />
20.8%<br />
GOSI 9.6%<br />
Public<br />
Source: Zawya<br />
29.7%<br />
Relative Share Price Performance<br />
EQUITY RESEARCH<br />
SHB: ADJUSTING FAIR VALUE ON IMPROVED ASSET QUALITY AND MARGINS<br />
Saudi Hollandi <strong>Bank</strong> delivered a remarkable progress in improving its profitability over the last<br />
year and a half. With asset quality concerns receding, the bank’s focus has shifted to delivering<br />
strong double digit loan growth.<br />
DECLINING NPL SUPPORTS ROE<br />
NPLs have declined from 2.60% in December 2010 to 1.77%, while increasing its NPL coverage<br />
from 124% to 144% over the last 2 years. We expect cost of risk to decline to 45 bps in 2012 and<br />
40 bps in 2013. Recently the bank seems to have benefited from some provision recoveries as it<br />
recorded an exceptionally low cost of risk in its Q2-2012 results (annualized at 13bps). We expect<br />
Saudi Hollandi ROE to increase to 13.6% by the end of the year largely up from 11.7% in 2010.<br />
CORPORATE FRANCHISE PROPS UP SOLID LENDING<br />
Over the second half of 2011, SHB managed to capture 6% market share of new loans despite<br />
having an initial market share of 4.3%. Loan growth bounced back impressively, with the bank<br />
targeting corporate customers and tapping into the project finance area. Recent major lending<br />
transactions include Jabal Omar Development for its Mecca project and Tasnee for its factories.<br />
Saudi Hollandi managed to exceed sector loan growth by lifting its loan book to 11% in the first<br />
6 months of 2012 and 20% Y-o-Y. We expect Saudi Hollandi to remain a major beneficiary in the<br />
project finance field.<br />
While scale doesn’t support the bank to fund big projects, the bank can work this into its advantage<br />
by gaining market share. We note that total loans for SHB stand at SAR 42bn while the project<br />
finance market is estimated to add about SAR 15bn per annum.<br />
NIM REVERSES DOWNWARD TREND<br />
Net interest margins have improved by 6bps from the beginning of the year, as the bank shed<br />
some of its low yielding investments while targeting a cheaper cost of funds. The expansion of the<br />
loan book has also added to NIM support, while the bank targeted higher yields on its corporate<br />
book.<br />
BIG UPLIFT IN NON-INTEREST INCOME<br />
Non interest income grew by 19% Y-o-Y in the first 6 months of 2012 on the back of strong loan<br />
book. The bank has improved its efficiency on fees and commissions while also benefiting from<br />
the rising volumes on Tadawul (though Saudi Hollandi only owns a 2% market share of total brokerage).<br />
The bank’s work on improving cross-selling of its retail product to its corporate customers<br />
has supported the fee income growth and lead to better profitability.<br />
GROWTH AND PROFITABILITY COMPENSATE THE RISE IN VALUATION<br />
Saudi Hollandi share price rallied by 30% over the last 18 months. At the same time ROE has adjusted<br />
upwards, bridging the gap with peers (current ROE at 13.6%) The bank trades at a PE 2013E<br />
of 7.9x, a PB 2012E of 1.36x with expected EPS growth of 16.4% and 14.5% for 2012 and 2013 respectively.<br />
Given the profitability turnaround, we adjust our fair value upwards to SAR 32.1 while<br />
keeping our Accumulate rating. Key risks are slower growth and pressure on net interest margins.<br />
FINANCIAL DATA<br />
SAUDI HOLLANDI BANK<br />
2011 2012e 2013e 2014e<br />
Net Income (SAR million) 1,034 1,203 1,378 1,552<br />
EPS (SAR) 2.61 3.03 3.47 3.91<br />
P/B (X) 1.23 1.36 1.23 1.11<br />
P/E (X) 10.5 9.0 7.9 7.0<br />
Dividend Yield 0.0% 3.6% 4.2% 4.7%<br />
ROAE (%) 12.8% 13.6% 13.9% 14.1%<br />
NPL Ratio 1.9% 1.8% 1.7% 1.6%<br />
NPL Coverage 145% 147% 150% 155%<br />
37
August 24, 2012<br />
FINANCIALS<br />
EQUITY RESEARCH<br />
SAUDI HOLLANDI BANK<br />
Income Statement 2010 2011 2012E 2013E 2014E 2015E 2016E<br />
Net Special Commission Income 1,288 1,290 1,362 1,553 1,731 1,922 2,344<br />
Fee and <strong>Bank</strong>ing Income 455 519 605 685 736 788 851<br />
Exchange Income 89 109 128 145 160 173 187<br />
Trading Income 117 82 94 97 100 107 114<br />
Other Income 5 5 18 21 24 28 32<br />
Non Special Commission Income 666 715 845 947 1,020 1,095 1,183<br />
Total <strong>Bank</strong>ing Income 1,954 2,005 2,207 2,500 2,751 3,017 3,528<br />
Operating Expenses (772) (818) (839) (902) (947) (994) (1,054)<br />
Operating Profit Before Provisions 1,182 1,187 1,368 1,598 1,804 2,023 2,474<br />
Provision losses on loans & investments (398) (171) (165) (220) (252) (290) (310)<br />
Profit/Loss from Associates 6 18 - - - - -<br />
Minority Interest - - - - - - -<br />
Net Income 790 1,034 1,203 1,378 1,552 1,733 2,163<br />
Balance Sheet Summary 2010 2011 2012E 2013E 2014E 2015E 2016E<br />
Cash and due from banks 5,309 6,582 9,268 10,878 13,034 14,654 16,413<br />
Loans and Advances (Net) 35,038 37,745 44,237 50,563 56,732 62,972 69,206<br />
Investments 11,752 11,503 11,456 12,029 12,630 13,262 13,925<br />
Prorperty Plant and Equipment 495 489 528 555 582 611 642<br />
Other Assets 1,288 1,230 1,294 1,361 1,475 1,613 1,710<br />
Total Assets 53,882 57,549 66,783 75,386 84,454 93,113 101,897<br />
Deposits 41,604 45,024 52,273 59,330 66,687 73,689 81,058<br />
Due to <strong>Bank</strong>s 2,857 1,612 2,050 2,255 2,481 2,729 2,892<br />
Debt securities 1,500 1,500 1,500 1,500 1,500 1,500 1,500<br />
Other liabilities 1,536 2,004 2,477 2,774 3,107 3,480 3,689<br />
Total Liabilities 47,496 50,139 58,300 65,859 73,774 81,397 89,139<br />
Shareholder Equity 6,386 7,409 8,483 9,527 10,679 11,715 12,758<br />
Total Liabilities and Shareholders Equity 53,882 57,549 66,783 75,386 84,454 93,113 101,897<br />
Per Share Data 2010 2011 2012E 2013E 2014E 2015E 2016E<br />
EPS 1.99 2.61 3.03 3.47 3.91 4.37 5.45<br />
DPS - - 1.00 1.15 1.30 1.40 1.80<br />
Growth 2010 2011 2012E 2013E 2014E 2015E 2016E<br />
Total Assets Growth -9.0% 6.8% 16.0% 12.9% 12.0% 10.3% 9.4%<br />
Loans Growth -3.0% 7.7% 17.2% 14.3% 12.2% 11.0% 9.9%<br />
Deposits Growth -7.0% 8.2% 16.1% 13.5% 12.4% 10.5% 10.0%<br />
EPS Growth nm 30.9% 16.4% 14.5% 12.6% 11.6% 24.9%<br />
38
August 24, 2012<br />
FINANCIALS<br />
EQUITY RESEARCH<br />
SAUDI HOLLANDI BANK<br />
Balance Sheet Mix 2010 2011 2012E 2013E 2014E 2015E 2016E<br />
Loans to Deposits 84% 84% 85% 85% 85% 85% 85%<br />
Loans/ Assets 65% 66% 66% 67% 67% 68% 68%<br />
Assets/Equity 8.44 7.77 7.87 7.91 7.91 7.95 7.99<br />
(Cash + Net Interbank) /Assets 5% 9% 11% 11% 12% 13% 13%<br />
Deposits/ Total Funding 77% 78% 78% 79% 79% 79% 80%<br />
Asset Quality 2010 2011 2012E 2013E 2014E 2015E 2016E<br />
NPL Ratio 2.7% 1.9% 1.8% 1.7% 1.6% 1.6% 1.5%<br />
NPL Coverage Ratio 124% 145% 147% 150% 155% 160% 162%<br />
Cost of Risk (% of Gross Loans) 1.05% 0.43% 0.45% 0.40% 0.40% 0.35% 0.35%<br />
Capital Adequacy 2010 2011 2012E 2013E 2014E 2015E 2016E<br />
Tier 1 12.7% 12.7% 12.8% 12.9% 13.1% 13.1% 13.1%<br />
CAR 16.4% 16.4% 16.5% 16.6% 16.6% 16.7% 16.7%<br />
Profitability 2010 2011 2012E 2013E 2014E 2015E 2016E<br />
ROAE 11.7% 12.8% 13.6% 13.9% 14.1% 14.4% 16.8%<br />
ROAA 1.3% 1.4% 1.6% 1.7% 1.7% 1.7% 2.0%<br />
NIM 2.3% 2.4% 2.5% 2.5% 2.6% 2.7% 3.1%<br />
Cost to Income 39.5% 40.8% 38.0% 36.1% 34.4% 33.0% 29.9%<br />
Operating Income Attribution 2010 2011 2012E 2013E 2014E 2015E 2016E<br />
Net Interest Income 66% 64% 62% 62% 63% 64% 66%<br />
Fee Income 23% 26% 27% 27% 27% 26% 24%<br />
Other Income 11% 10% 11% 10% 10% 10% 9%<br />
39
CURRENT PRICE SAR 31.0<br />
FAIR VALUE SAR 31.2<br />
RATING HOLD<br />
August 24, 2012<br />
HIGHLIGHTS<br />
Stock Data<br />
Ticker ALBI AB<br />
Price 31.0<br />
Consensus Median Target<br />
Price (SAR)<br />
26.2<br />
Fair Value 31.2<br />
Upside Potential 1%<br />
Market Cap (SAR m) 9,300<br />
Market Cap (USD m) 2,480<br />
Number of Shares (m) 300<br />
Free Float 64%<br />
Av Monthly Liquidity (SAR) 487<br />
52 week High (SAR) 35.4<br />
Major Shareholders<br />
Name<br />
Mohamad Al Subai 11.6%<br />
Ibrahim Al Subai 11.1%<br />
First Investment Company 7.4%<br />
Abulrahman Rajhi 19.9%<br />
Public<br />
Source: Zawya<br />
50.0%<br />
Relative Share Price Performance<br />
AL BILAD: VALUATION PRICING GROWING EARNINGS<br />
EQUITY RESEARCH<br />
Recently established, Albilad is the smallest bank in Saudi Arabia with 1.4% lending market share<br />
and 2.1% deposit market share. An Islamic bank, the bank enjoys significant funding cost advantages<br />
over its peers. To overcome its size disadvantage, the bank focused on its retail segment, as well<br />
as its remittance business. However, the bank still suffers from high operating costs. A sustainable<br />
loan growth would allow the bank to benefit from higher economies of scale and accelerate its<br />
expansion plans.<br />
CORPORATE AND RETAIL GROWTH ABOVE SECTOR AVERAGE<br />
Albilad’s loan growth has steadily climbed up; the retail loan book surged by an impressive 26% in 2011,<br />
reflecting a combination of higher employment and wages rise. We believe that the bank will continue<br />
to achieve high loan growth given its efforts to tap more aggressively the retail market. Albilad has<br />
also demonstrated strong corporate lending growth with corporate loans increasing by 13% in H1-12.<br />
Backed by improving corporate profitability, rising capacity utilization and capital expenditure, this<br />
momentum is expected to continue. With its high cost to income ratio of 54% compared to the sector’s<br />
average of 32.4%, Albilad’s earnings are sensitive to higher business volumes.<br />
STRONG FEE GENERATION FROM REMITTANCES<br />
Reflecting its roots in the money exchange business, remittances generate 24% of the bank’s operating<br />
income. Given the increasing rates of expatriates, the value of their remittances has almost doubled in<br />
the past 5 years. In addition to the low rates the bank offers to Pakistan, India and Phillipines, the bank<br />
is building partnership with external parties, such as Seylan <strong>Bank</strong>, the National <strong>Bank</strong> of Pakistan, Axis<br />
<strong>Bank</strong> to further explore their advantage in this field.<br />
PROGRESS ON ASSET QUALITY, BUT RISK STILL EXISTS<br />
Albilad’s rapid loan growth has potentially contributed to higher impaired loan volumes than the<br />
sector’s average. Notwithstanding the fact that it still has the one of the worst asset quality metrics,<br />
recent disclosures show an improving asset quality picture. Albilad lifted its coverage ratio from<br />
130% in 2011 to 150% in H1-12, under regulatory pressure. Backed by improving quality of its<br />
corporate book, the NPL ratio declined from 5.5% in 2011 to 3.8% in Q2-12, still above the sector’s<br />
average of 2.1%. Going forward, we expect a lower NPL ratio as well as lower provisioning costs,<br />
which could support the bank’s bottom line.<br />
NET INTEREST MARGINS HOLDING UP<br />
The high liquidity of the bank (LTD of 66%) and Tier1 ratio of 13.8% show Al Bilad’s ability to support<br />
higher volumes growth. The bank’s participation in new project finance loans represents an<br />
opportunity for the bank to park its liquidity in higher yielding assets. The high portion of demand<br />
deposits (77% of total deposits) and the cheap funding structure of the bank helped offset yield<br />
pressure. In spite of the recent increase in SAIBOR, we expect NIMs to be stable around 3.6%. The<br />
persistence of high competition, high liquidity, as well as low rates continues to pressure margins.<br />
FAIR VALUATION<br />
Al Bilad trades at a PB 2012E of 2.15x above the sector’s average of PB 2012E of 1.46x, and at a PE<br />
2013E of 14.0x. In our view, Albilad valuation discounts the strong growth we are expecting. We<br />
initiate coverage on Al Bilad by assigning a Hold rating, with a fair value of SAR 31.2.<br />
FINANCIAL<br />
BANK AL BILAD<br />
2011 2012e 2013e 2014e<br />
Net Income (SAR million) 330 841 664 757<br />
EPS (SAR) 1.10 2.80 2.21 2.52<br />
P/B (X) 2.72 2.15 1.93 1.73<br />
P/E (X) 28.2 11.0 14.0 12.2<br />
Dividend Yield 0.0% 0.0% 2.3% 2.6%<br />
ROAE (%) 10.1% 21.7% 14.5% 14.9%<br />
NPL Ratio 4.3% 4.3% 4.0% 3.9%<br />
NPL Coverage 129% 134% 139% 147%<br />
40
August 24, 2012<br />
FINANCIALS<br />
EQUITY RESEARCH<br />
BANK AL BILAD<br />
Income Statement 2010 2011 2012E 2013E 2014E 2015E 2016E<br />
Net Special Commission Income 625 703 827 978 1,133 1,289 1,644<br />
Fee and <strong>Bank</strong>ing Income 342 458 597 704 789 868 946<br />
Exchange Income 121 189 189 195 201 207 213<br />
Trading Income 11 18 18 18 18 18 18<br />
Other Income 0 5 8 10 11 13 16<br />
Non Special Commission Income 474 671 813 927 1,019 1,106 1,194<br />
Total <strong>Bank</strong>ing Income 1,099 1,374 1,639 1,906 2,153 2,395 2,837<br />
Operating Expenses (717) (792) (876) (968) (1,078) (1,169) (1,299)<br />
Operating Profit Before Provisions 382 582 763 938 1,075 1,227 1,538<br />
Gain on sale of land - - 373 - - - -<br />
Provision losses on loans& investments (290) (252) (232) (239) (277) (316) (354)<br />
Net Income 92 330 904 699 797 911 1,184<br />
Balance Sheet Summary 2010 2011 2012E 2013E 2014E 2015E 2016E<br />
Cash and due from banks 6,530 12,289 12,024 13,532 15,153 16,588 17,744<br />
Loans and Advances (Net) 12,290 13,780 17,274 20,359 23,341 26,464 29,388<br />
Investments 1,611 951 351 448 389 496 426<br />
Prorperty Plant and Equipment 342 328 339 - 339 356 374<br />
Other Assets 344 378 426 849 592 660 719<br />
Total Assets 21,117 27,727 30,414 35,188 39,814 44,564 48,651<br />
Deposits 16,932 23,038 24,651 28,743 32,623 36,635 39,933<br />
Due to <strong>Bank</strong>s 382 422 464 510 551 590 631<br />
Debt securities - - - - - - -<br />
Other liabilities 698 851 979 1,126 1,272 1,425 1,581<br />
Total Liabilities 18,013 24,311 26,093 30,379 34,446 38,650 42,145<br />
Shareholder Equity 3,103 3,416 4,321 4,810 5,368 5,914 6,506<br />
Total Liabilities and Shareholders Equity 21,117 27,727 30,414 35,188 39,814 44,564 48,651<br />
Per Share Data 2010 2011 2012E 2013E 2014E 2015E 2016E<br />
EPS 0.31 1.10 2.80 2.21 2.52 2.88 3.75<br />
DPS - - - 1.09 1.25 1.90 3.09<br />
Growth 2010 2011 2012E 2013E 2014E 2015E 2016E<br />
Total Assets Growth 19% 31% 10% 16% 13% 12% 9%<br />
Loans Growth 12% 12% 25% 18% 15% 13% 11%<br />
Deposits Growth 23% 36% 7% 17% 14% 12% 9%<br />
EPS Growth -137% 257% 155% -21% 14% 14% 30%<br />
41
August 24, 2012<br />
FINANCIALS<br />
EQUITY RESEARCH<br />
BANK AL BILAD<br />
Balance Sheet Mix 2010 2011 2012E 2013E 2014E 2015E 2016E<br />
Loans to Deposits 73% 60% 70% 71% 72% 72% 74%<br />
Loans/ Assets 58% 50% 57% 58% 59% 59% 60%<br />
Assets/Equity 6.81 8.12 7.04 7.32 7.42 7.54 7.48<br />
(Cash + Net Interbank) /Assets 29% 43% 38% 37% 37% 36% 35%<br />
Deposits/ Total Funding 94% 95% 94% 95% 95% 95% 95%<br />
Asset Quality 2010 2011 2012E 2013E 2014E 2015E 2016E<br />
NPL Ratio 4.67% 4.29% 4.30% 4.00% 3.90% 3.80% 3.70%<br />
NPL Coverage Ratio 89% 129% 134% 138% 146% 153% 161%<br />
Cost of Risk (% of Gross Loans) 1.99% 1.83% 1.40% 1.20% 1.20% 1.20% 1.20%<br />
Capital Adequacy 2010 2011 2012E 2013E 2014E 2015E 2016E<br />
Tier 1 16.6% 15.5% 15.7% 15.8% 15.8% 15.8% 15.9%<br />
CAR 17.5% 18.3% 18.5% 18.5% 18.5% 18.5% 18.7%<br />
Profitability 2010 2011 2012E 2013E 2014E 2015E 2016E<br />
ROAE 3.0% 10.1% 21.7% 14.5% 14.9% 15.3% 18.1%<br />
ROAA 0.5% 1.3% 2.9% 2.0% 2.0% 2.1% 2.4%<br />
NIM 3.34% 2.96% 2.92% 3.06% 3.10% 3.13% 3.61%<br />
Cost to Income 65.3% 57.6% 53.5% 50.8% 50.1% 48.8% 45.8%<br />
Operating Income Attribution 2010 2011 2012E 2013E 2014E 2015E 2016E<br />
Net Interest Income 57% 51% 50% 51% 53% 54% 58%<br />
Fee Income 31% 33% 36% 37% 37% 36% 33%<br />
Other Income 12% 15% 13% 12% 11% 10% 9%<br />
42
CURRENT PRICE SAR 28.3<br />
FAIR VALUE SAR 30.8<br />
RATING HOLD<br />
Stock Data<br />
Ticker BJAZ AB<br />
Price 28.3<br />
Consensus Median Target<br />
Price (SAR)<br />
23.6<br />
Fair Value 30.8<br />
Upside Potential 9%<br />
Market Cap (SAR m) 8,490<br />
Market Cap (USD m) 2,264<br />
Number of Shares (m) 300<br />
Free Float 52<br />
Av Monthly Liquidity (SAR) 402<br />
52 week High (SAR) 33.9<br />
Major Shareholders<br />
Name<br />
Rashed Al Rashed 22.2%<br />
UBDC 6.5%<br />
National <strong>Bank</strong> of Pakistan 5.8%<br />
Saleh Kamal 5%<br />
Public<br />
Source: Zawya<br />
60.5%<br />
Relative Share Price Performance<br />
August 24, 2012<br />
HIGHLIGHTS<br />
AL JAZIRA: PROMISING EARNINGS MAINLY PRICED IN<br />
EQUITY RESEARCH<br />
In terms of balance sheet size, Al Jazira is one of the smallest banks in KSA, with a market share of<br />
almost 3% in lending as well as deposits. After it completed its conversion to an islamic bank in 2007,<br />
the bank was continuously investing in its retail banking infrastructure. Strong loan growth and<br />
high brokerage income caused re-rating of fundamentals.<br />
STRONG LOAN GROWTH<br />
<strong>Bank</strong> Al Jazira is making steady progress in developing its core banking, which lead to a considerable<br />
balance sheet growth of 80% for the past 5 years. Al Jazira has demonstrated robust retail lending<br />
growth with retail loans rising by 60% over the 12 months to December 2011, while its corporate<br />
book surged by 7% last year. Resurgence in trading volumes at Tadawul should lead to an increased<br />
appetite for margin loans. The bank’s management recently announced that a credit card product will<br />
be established. We expect Al Jazira’s loan to remain strong, with a growth of 30% and 19% in 2012 and<br />
2013. On the liquidity front, the bank is still well positioned for growth with the loan to deposit ratio of<br />
76%, against 83% for the sector.<br />
FEE INCOME TO REMAIN ROBUST<br />
With a brokerage market share of 17%, <strong>Bank</strong> Al Jazira will benefit the most from the increasing<br />
trading volumes at the Tadawul. We believe Al Jazira’s high dependence on volume remains a core<br />
differentiating factor to its peers; the contribution of broking income to total income increased to<br />
11.8% last year. The rising trading volumes has a two-fold impact on the bank’s profitability: increasing<br />
brokerage commissions as well as rising demand for margin lending, which will feed into higher loan<br />
growth. Despite that monthly traded value dropped from their high of SAR 270 billion in March to<br />
SAR138 billion in June, we expect that earning momentum will still be lead by brokerage income, but<br />
at a slower pace than the first quarter of 2012.<br />
LAGGING ON ASSET QUALITY<br />
Al Jazira still lags its local peers on asset quality despite the improvement in NPL coverage achieved<br />
during 2011 and the first half of 2012. The bank’s non performing loans in percentage of gross loans<br />
have been showing improving trends after peaking in 2009. It fell from its high of 7.4% in 2009 to<br />
3.93% in Q1-12. The NPL coverage ratio remains one of the lowest in the sector at 121%. The bank will<br />
likely push through to improve its NPL coverage, to be in line with the sector’s average of 147%.<br />
NIM TO RECOVER<br />
Despite its effort in improving and diversifying its income sources, the growth in core banking revenues<br />
hasn’t been totally reflected in earnings and NIMs. Going forward, sustained loan growth in consumer<br />
lending, supported by growing demand for margin lending will push the bank’s margins upwards. We<br />
expect the bank’s NIM to reach 2.35% and 2.47% in 2012 and 2013 respectively.<br />
VALUATION<br />
The bank’s earnings growth, as well as its advantage in brokerage is partially reflected by its high<br />
valuation. Al Jazira trades at a PB 2012E of 1.60x a premium of 10% to the Saudi banking sector . The<br />
bank trades at PE 2013E of 11.7x. We initiate coverage on Al Jazira by assigning an Hold rating, with<br />
a fair value of SAR 30.8.<br />
FINANCIAL DATA<br />
BANK AL JAZIRA<br />
2011 2012e 2013e 2014e<br />
Net Income 303 530 725 900<br />
EPS 1.01 1.77 2.42 3.00<br />
P/B (x) 1.72 1.60 1.46 1.32<br />
P/E (x) 28.03 16.01 11.70 9.43<br />
Dividend Yield 1.9% 2.5% 3.2% 3.9%<br />
ROAE 6.1% 10.1% 12.7% 14.3%<br />
NPL Ratio 4.2% 3.7% 3.5% 3.4%<br />
NPL Coverage 117% 131% 142% 145%<br />
43
August 24, 2012<br />
FINANCIALS<br />
EQUITY RESEARCH<br />
BANK AL JAZIRA<br />
Income Statement 2010 2011 2012E 2013E 2014E 2015E 2016E<br />
Net Special Commission Income 717 781 950 1,157 1,359 1,574 1,964<br />
Fee and <strong>Bank</strong>ing Income 160 213 334 403 476 544 615<br />
Non Lending Fees and Commissions 106 144 316 348 382 421 463<br />
Exchange Income 18 20 25 25 25 25 25<br />
Trading Income 106 15 50 56 61 66 72<br />
Other Income 48 36 5 6 6 8 9<br />
Non Special Commission Income 438 427 729 837 951 1,063 1,184<br />
Total <strong>Bank</strong>ing Income 1,155 1,208 1,679 1,994 2,310 2,637 3,148<br />
Operating Expenses (764) (835) (952) (1,043) (1,143) (1,252) (1,359)<br />
Operating Profit Before Provisions 391 373 728 951 1,167 1,385 1,788<br />
Provision losses on loans& investments (362) (70) (197) (226) (267) (312) (359)<br />
Profit/Loss from Associates - - - - - - -<br />
Minority Interest - - - - - - -<br />
Net Income 29 303 530 725 900 1,073 1,429<br />
Balance Sheet Summary 2010 2011 2012E 2013E 2014E 2015E 2016E<br />
Cash and due from banks 8,188 8,710 5,446 3,377 3,455 3,124 3,343<br />
Loans and Advances (Net) 18,704 23,307 30,323 36,231 42,223 48,589 55,281<br />
Investments 4,546 5,397 7,710 10,479 11,343 12,288 13,288<br />
Prorperty Plant and Equipment 462 447 478 512 547 586 627<br />
Other Assets 1,117 1,037 1,626 1,952 2,244 2,581 2,968<br />
Total Assets 33,018 38,898 45,583 52,549 59,814 67,169 75,507<br />
Deposits 27,345 31,159 36,533 42,744 49,155 55,545 62,655<br />
Due to <strong>Bank</strong>s 389 1,306 2,220 2,442 2,637 2,822 3,019<br />
Other liabilities 478 497 522 548 575 604 634<br />
Total Liabilities 28,212 33,961 40,275 46,733 53,368 59,971 67,309<br />
Shareholder Equity 4,806 4,937 5,308 5,816 6,446 7,197 8,198<br />
Total Liabilities and Shareholders Equity 33,017 38,898 45,583 52,549 59,814 67,169 75,507<br />
Per Share Data 2010 2011 2012E 2013E 2014E 2015E 2016E<br />
EPS 0.10 1.01 1.77 2.42 3.00 3.58 4.76<br />
DPS - 0.53 0.70 0.90 1.10 1.30 1.40<br />
Growth 2010 2011 2012E 2013E 2014E 2015E 2016E<br />
Total Assets Growth 10% 18% 17% 15% 14% 12% 12%<br />
Loans Growth 21% 25% 30% 19% 17% 15% 14%<br />
Deposits Growth 23% 14% 17% 17% 15% 13% 13%<br />
EPS Growth 4% 960% 75% 37% 24% 19% 33%<br />
44
August 24, 2012<br />
FINANCIALS<br />
EQUITY RESEARCH<br />
BANK AL JAZIRA<br />
Balance Sheet Mix 2010 2011 2012E 2013E 2014E 2015E 2016E<br />
Loans to Deposits 68% 75% 83% 85% 86% 87% 88%<br />
Loans/ Assets 57% 60% 67% 69% 71% 72% 73%<br />
Assets/Equity 6.87 7.88 8.59 9.04 9.28 9.33 9.21<br />
(Cash + Net Interbank) /Assets 24% 19% 7% 2% 1% 0% 0%<br />
Deposits/ Total Funding 97% 92% 91% 91% 92% 93% 93%<br />
Asset Quality 2010 2011 2012E 2013E 2014E 2015E 2016E<br />
NPL Ratio 6.7% 4.2% 3.7% 3.5% 3.4% 3.3% 3.2%<br />
NPL Coverage Ratio 84% 117% 131% 141% 144% 147% 152%<br />
Cost of Risk (% of Gross Loans) 2.01% 0.32% 0.70% 0.70% 0.70% 0.70% 0.70%<br />
Capital Adequacy 2010 2011 2012E 2013E 2014E 2015E 2016E<br />
Tier 1 13.4% 13.5% 12.5% 12.6% 12.6% 12.6% 12.8%<br />
CAR 17.1% 17.2% 15.1% 15.3% 15.3% 15.3% 15.5%<br />
Profitability 2010 2011 2012E 2013E 2014E 2015E 2016E<br />
ROAE 0.6% 6.1% 10.1% 12.7% 14.3% 15.3% 18.1%<br />
ROAA 0.04% 0.4% 1.2% 1.4% 1.6% 1.6% 2.0%<br />
NIM 2.40% 2.27% 2.35% 2.47% 2.54% 2.60% 2.89%<br />
Cost to Income 66.2% 69.1% 56.7% 52.3% 49.5% 47.5% 43.2%<br />
Operating Income Attribution 2010 2011 2012E 2013E 2014E 2015E 2016E<br />
Net Interest Income 62% 65% 57% 58% 59% 60% 62%<br />
Fee Income 14% 18% 20% 20% 21% 21% 20%<br />
Other Income 15% 6% 5% 4% 4% 4% 3%<br />
45
CURRENT PRICE SAR 13.5<br />
FAIR VALUE SAR 15.6<br />
RATING ACCUMULATE<br />
Stock Data<br />
Ticker ALINMA AB<br />
Price 13.5<br />
Consensus Median Target<br />
Price (SAR)<br />
15.3<br />
Fair Value 15.6<br />
Upside Potential 16%<br />
Market Cap (SAR m) 20,175<br />
August 24, 2012<br />
HIGHLIGHTS<br />
Market Cap (USD m) 5,380<br />
Number of Shares (m) 1,500<br />
Free Float 69%<br />
Av Monthly Liquidity (SAR) 8,681<br />
52 week High (SAR) 16.9<br />
Major Shareholders<br />
Name Holding<br />
Public Pension Company 10.7%<br />
Public Investment Fund 10.0%<br />
GOSI 10.0%<br />
Public<br />
Source: Zawya<br />
69.3%<br />
Relative Share Price Performance<br />
ALINMA: ROBUST GROWTH PARTIALLY REFLECTED<br />
EQUITY RESEARCH<br />
Alinma, which was only established in 2008, is the fastest growing bank in KSA. In the first half of<br />
2012, the bank surprised the market on the upside by beating consensus estimates. In spite of its<br />
progressing return, almost clean loan portfolio as well as strong capital base, Alinma is still in its<br />
development phase and faces higher expansionary costs as well as NIM pressure. We believe Alinma<br />
has the ability to maintain its increasing profitability, driven by its strong loan growth as it moves<br />
from its development phase to a mature business.<br />
LOAN GROWTH TOPPING SAUDI BANKS<br />
Alinma’s 2011 loan growth has reached 62%, the highest among the Saudi banks. Its retail book<br />
grew by 6.1% year to date while its corporate loans increased by 13.2%. The bank’s management<br />
expressed its interest in real estate development projects. The bank recently signed an agreement<br />
to finance the purchase of real estate units in King Abdullah Economic City. In addition to that,<br />
recent announcements show that Alinma has been active in corporate finance as well as advisory<br />
business, such as Jabal Omar Development Co. and the Sadara Chemical Co. The majority of the<br />
bank’s financing, which is around 82% of total, is currently extended to the commercial segment. We<br />
expect a loan growth of 36% and 26% for 2012 and 2013 respectively.<br />
LOW LEVERAGED BANK WITH A STRONG CAPITAL BASE<br />
Following the Central <strong>Bank</strong> requirement, the bank will have to focus on raising its general provision<br />
reserve to 1% of gross loans, from 0.5% as at 2011. This increase is expected to continue in 2012, and<br />
will be translated into a higher cost of risk in 2012. The bank reported a Tier 1 ratio of 44%, one of the<br />
highest in the sector, with a leverage ratio at 2.31x. As the bank continues its aggressive expansion and<br />
starts paying dividends in the coming years, its capital adequacy ratio will decrease.<br />
LIQUIDITY AND SPREAD TO BE MONITORED<br />
Alinma’s loan to deposit ratio is one of the highest a 142% compared to the sector average of<br />
85%. However, the bank’s deposits have increased by 96.2% year to date and we believe the bank<br />
is capable of increasing its deposits at higher rates should the need arise to support incremental<br />
lending. According to our estimates, Alinma’s net interest spread suffered beginning of 2012 due<br />
to rising funding costs. Since it was only recently established, the bank didn’t reach its optimal cost<br />
of capital.<br />
ALMOST INTACT ASSET QUALITY<br />
While the bank’s financing portfolio climbed up by 62.7% in 2011, the bank’s existing portfolio<br />
remains almost free of NPLs, with a NPL ratio of 0.04% end of 2011. As the bank accomplishes its<br />
expansion and its business grow, we expect that it will start realizing higher impairment charges. It’s<br />
worth noting that the majority of the impairment allowance that was recorded last year was against<br />
retail loans. Our expectations for Alinma’s NPL is to rise to 0.25% at the end of 2012 and to keep its<br />
NPL coverage above 100%.<br />
PREMIUM VALUATION<br />
Alinma trades at a PB 2012E of 1.24x, on a sustainable ROE of 13.5% . The bank trades at a PE 2013E<br />
of 21.9x due to the high growth phase. We assess Alinma’s growth potential as partially priced in. We<br />
initiate coverage on Alinma by assigning an Accumulate rating, with a fair value of SAR 15.6.<br />
FINANCIAL DATA<br />
ALINMA BANK<br />
2011 2012e 2013e 2014e<br />
Net Income 428 652 924 1,405<br />
EPS 0.29 0.43 0.62 0.94<br />
P/B (x) 1.27 1.24 1.20 1.14<br />
P/E (x) 47.3 31.0 21.9 14.4<br />
ROAE 2.7% 3.9% 5.4% 7.9%<br />
NPL Ratio 0.0% 0.3% 0.3% 0.3%<br />
NPL Coverage nm 174% 149% 152%<br />
46
August 24, 2012<br />
FINANCIALS<br />
EQUITY RESEARCH<br />
ALINMA BANK<br />
Income Statement 2010 2011 2012E 2013E 2014E 2015E 2016E<br />
Net Special Commission Income 525 1,112 1,488 1,803 2,216 2,613 3,343<br />
Fee and <strong>Bank</strong>ing Income 129 257 333 425 517 607 700<br />
Exchange Income 5 12 12 12 12 12 12<br />
Trading Income - 6 12 13 14 15 17<br />
Other Income 4 (1) 0 1 1 1 1<br />
Non Special Commission Income 137 273 356 450 544 635 729<br />
Total <strong>Bank</strong>ing Income 662 1,385 1,844 2,253 2,760 3,248 4,073<br />
Operating Expenses (644) (832) (1,006) (1,107) (1,220) (1,292) (1,405)<br />
Operating Profit Before Provisions 18 553 838 1,145 1,540 1,957 2,667<br />
Provision losses on loans& investments (3) (125) (185) (221) (135) (152) (155)<br />
Profit/Loss from Associates - - - - - - -<br />
Minority Interest - - - - - - -<br />
Net Income 15 428 652 924 1,405 1,805 2,513<br />
Balance Sheet Summary 2010 2011 2012E 2013E 2014E 2015E 2016E<br />
Cash and due from banks 6,460 5,416 5,441 4,836 4,738 5,837 7,373<br />
Loans and Advances (Net) 15,593 25,259 34,274 43,272 52,521 60,918 70,665<br />
Investments 2,624 3,428 3,569 3,787 3,873 4,115 4,219<br />
Prorperty Plant and Equipment 1,193 1,379 1,448 1,521 1,597 1,676 1,760<br />
Other Assets 678 1,301 1,686 1,939 2,230 2,565 2,949<br />
Total Assets 26,549 36,783 46,419 55,355 64,959 75,111 86,968<br />
Deposits 8,316 17,776 26,664 34,664 42,983 51,580 61,380<br />
Due to <strong>Bank</strong>s 2,254 2,443 2,565 2,770 2,992 3,201 3,425<br />
Debt securities - - - - - - -<br />
Other liabilities 477 670 871 1,002 1,152 1,325 1,524<br />
Total Liabilities 11,047 20,889 30,101 38,436 47,127 56,106 66,329<br />
Shareholder Equity 15,501 15,894 16,318 16,919 17,832 19,005 20,639<br />
Total Liabilities and Shareholders Equity 26,548 36,783 46,419 55,355 64,959 75,111 86,968<br />
Per Share Data 2010 2011 2012E 2013E 2014E 2015E 2016E<br />
EPS 0.01 0.29 0.43 0.62 0.94 1.20 1.68<br />
Growth 2010 2011 2012E 2013E 2014E 2015E 2016E<br />
Total Assets Growth 53% 39% 26% 19% 17% 16% 16%<br />
Loans Growth 1302% 62% 36% 26% 21% 16% 16%<br />
Deposits Growth 455% 114% 50% 30% 24% 20% 19%<br />
EPS Growth nm 2714% 52% 42% 52% 28% 39%<br />
47
August 24, 2012<br />
FINANCIALS<br />
EQUITY RESEARCH<br />
ALINMA BANK<br />
Balance Sheet Mix 2010 2011 2012E 2013E 2014E 2015E 2016E<br />
Loans to Deposits 188% 142% 129% 125% 122% 118% 115%<br />
Loans/ Assets 59% 69% 74% 78% 81% 81% 81%<br />
Assets/Equity 1.71 2.31 2.84 3.27 3.64 3.95 4.21<br />
(Cash + Net Interbank) /Assets 16% 8% 6% 4% 3% 4% 5%<br />
Deposits/ Total Funding 75% 85% 89% 90% 91% 92% 93%<br />
Asset Quality 2010 2011 2012E 2013E 2014E 2015E 2016E<br />
NPL Ratio 0.00% 0.04% 0.25% 0.30% 0.30% 0.40% 0.50%<br />
NPL Coverage Ratio nm nm 173% 149% 152% 116% 93%<br />
Cost of Risk (% of Gross Loans) 0.0% 0.61% 0.62% 0.62% 0.31% 0.29% 0.25%<br />
Capital Adequacy 2010 2011 2012E 2013E 2014E 2015E 2016E<br />
Tier 1 75.0% 44.0% 41.0% 40.0% 35.0% 30.0% 26.0%<br />
CAR 75.0% 44.0% 41.0% 40.0% 35.0% 30.0% 26.0%<br />
Profitability 2010 2011 2012E 2013E 2014E 2015E 2016E<br />
ROAE 0.1% 2.7% 3.9% 5.4% 7.9% 9.6% 12.4%<br />
ROAA 0.1% 1.4% 1.5% 1.8% 2.3% 2.5% 3.0%<br />
NIM 2.56% 3.78% 3.84% 3.79% 3.92% 3.96% 4.37%<br />
Cost to Income 97.3% 60.1% 54.6% 49.2% 44.2% 39.8% 34.5%<br />
Operating Income Attribution 2010 2011 2012E 2013E 2014E 2015E 2016E<br />
Net Interest Income 79% 80% 81% 80% 80% 80% 82%<br />
Fee Income 19% 19% 18% 19% 19% 19% 17%<br />
Other Income 1% 1% 1% 1% 1% 1% 1%<br />
48
FAIR VALUE DEFINITION<br />
August 24, 2012<br />
RATING GUIDE<br />
ISSUER<br />
It is an unbiased estimate of the 12-month potential market price of the stock<br />
EQUITY RESEARCH<br />
SAUDI BANKS<br />
SELL REDUCE HOLD ACCUMULATE BUY<br />
Downside -30% -10% +10% +30% Upside<br />
BUY: Upside potential in share price is more than 30%<br />
ACCUMULATE: Upside potential in share price is between 10 and 30%<br />
HOLD: Upside or downside potential in share price less than 10%<br />
REDUCE: Downside potential in share price is between 10 and 30%<br />
SELL: Downside potential in share price is more than 30%<br />
<strong>Audi</strong> Saradar Investment <strong>Bank</strong><br />
<strong>Audi</strong> Saradar Investment <strong>Bank</strong> SAL • Lebanese joint stock company with a registered capital of<br />
10,000,000,000 Lebanese Pounds • Commercial Registrar in Beirut: 30812 • Holding number 33 on<br />
the Central <strong>Bank</strong>’s <strong>Bank</strong>s List.<br />
<strong>Bank</strong> <strong>Audi</strong> Plaza • Bab Idriss • Beirut 2021 8102 Lebanon • P.O. Box 11-2560 • Beirut 1107 2808 • Lebanon.<br />
Phone: +961 1 964072 • Fax: +961 1 970403 • Email: contactus@asib.com<br />
49
August 24, 2012<br />
DISCLAIMER<br />
EQUITY RESEARCH<br />
SAUDI BANKS<br />
“All rights reserved. This research document is prepared for the use of clients of <strong>Audi</strong> Saradar Investment <strong>Bank</strong> SAL and/or<br />
clients of any entity within the <strong>Audi</strong> Saradar group.<br />
This research document is disclosed to you on a confidential basis. Receipt and/or review of this research document<br />
constitute your agreement not to copy, modify, redistribute, retransmit, or disclose to others the contents, opinions,<br />
conclusion, or information contained in this document prior to public disclosure of the same by the <strong>Audi</strong> Saradar group or<br />
without the express written consent of <strong>Audi</strong> Saradar Investment <strong>Bank</strong> SAL.<br />
This material is not intended for dissemination, distribution to, or use by, any person or entity in any country or jurisdiction which<br />
would subject <strong>Audi</strong> Saradar Investment <strong>Bank</strong> SAL or any entity within the <strong>Audi</strong> Saradar group, to any registration or licensing<br />
requirements within these jurisdictions or where it might be considered as unlawful. Accordingly, this material is for distribution<br />
solely in jurisdictions where permitted and to persons who may receive it without breaching any applicable legal or regulatory<br />
requirements.<br />
Your attention is drawn to the fact that you should not access this material if the regulations of your country of citizenship<br />
and/or residency or any applicable regulations prohibit it. In any case, persons who are subject to any restrictions in any<br />
country, such as US persons are not permitted to access information contained herein.<br />
Neither the information, nor any opinion expressed herein constitute an offer or an invitation, or a recommendation to make<br />
an offer, to buy or sell any securities or other investment products related to such securities or investments. This research<br />
document provides general information only, is not intended to provide personal investment advice or recommendation<br />
and does not take into account the specific investment objectives, financial situation and the particular needs of any specific<br />
person who may receive it. Investors should seek financial, legal or tax advice regarding the appropriateness and suitability<br />
in investing in any securities, other investment or investment strategies discussed or forecasted in this document.<br />
The information herein was obtained from various public sources believed in good faith to be reliable but we do not<br />
guarantee its accuracy nor completeness. Neither <strong>Audi</strong> Saradar Investment <strong>Bank</strong> SAL nor any entity within the <strong>Audi</strong> Saradar<br />
group represent that the information contained in this document is complete, accurate or free from any error and make no<br />
representations or warranties whatsoever as to the data, information and opinions provided herein.<br />
This research document and any information, opinion, and prospect contained herein reflect a judgment at its original date<br />
of publication by <strong>Audi</strong> Saradar Investment <strong>Bank</strong> SAL and are subject to change without notice. <strong>Audi</strong> Saradar Investment<br />
<strong>Bank</strong> SAL and/or any entity within the <strong>Audi</strong> Saradar group may have issued, and may in the future issue, other research<br />
documents that are inconsistent with, and reach different conclusions from, the information and opinions presented in<br />
this research document. Those research documents reflect the different assumptions, views and analytical methods of the<br />
analysts who prepared them; <strong>Audi</strong> Saradar Investment <strong>Bank</strong> SAL and the <strong>Audi</strong> Saradar group are under no obligation to<br />
ensure that such other documents are brought to the attention of any recipient of this document.<br />
<strong>Audi</strong> Saradar Investment <strong>Bank</strong> SAL, any entity within the <strong>Audi</strong> Saradar group, their officers and/or one or more of their<br />
affiliates (including research analysts) may have a financial interest in securities of the issuer(s) or related investments. <strong>Audi</strong><br />
Saradar Investment <strong>Bank</strong> SAL and/or any entity within the <strong>Audi</strong> Saradar group may engage in securities transactions, on a<br />
proprietary basis or otherwise, in a manner inconsistent with the view taken in this document. In addition, <strong>Audi</strong> Saradar<br />
Investment <strong>Bank</strong> SAL, any entity within the <strong>Audi</strong> Saradar group and/or any of their strategists, analysts and sales staff, may<br />
take a view that is inconsistent with that taken in this research report.<br />
The price, value of and income from any of the securities or financial instruments mentioned in this document can<br />
fall as well as rise. The value of securities and financial instruments is subject to exchange rate fluctuation that may<br />
have a positive or adverse effect on the price or income of such securities or financial instruments. Any forecasts<br />
on the economy, stock market, bond market or the economic trends of the markets are not necessarily a guide<br />
to future returns. You should understand that statements regarding future prospects may not be realized. Past<br />
performance should not be taken as an indication or guarantee of future performance, and no representation or<br />
warranty, express or implied, is made regarding future returns. As a result of the preceding, you may lose, as the case<br />
may be, the amount originally invested.<br />
<strong>Audi</strong> Saradar Investment <strong>Bank</strong> SAL and any entity within the <strong>Audi</strong> Saradar group shall not be liable for any loss or<br />
damages that may arise, directly or indirectly, from any use of the information contained in this research document<br />
nor for any decision or investment made on the basis of information contained herein.”<br />
50