financials - Bank Audi
financials - Bank Audi
financials - Bank Audi

You also want an ePaper? Increase the reach of your titles
YUMPU automatically turns print PDFs into web optimized ePapers that Google loves.
August 24, 2012<br />
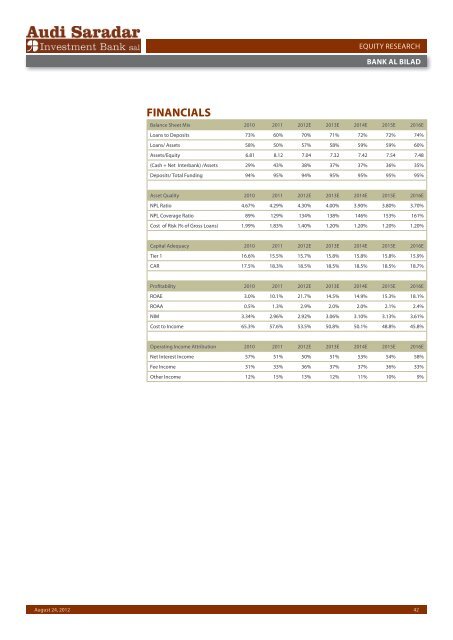
FINANCIALS<br />
EQUITY RESEARCH<br />
BANK AL BILAD<br />
Balance Sheet Mix 2010 2011 2012E 2013E 2014E 2015E 2016E<br />
Loans to Deposits 73% 60% 70% 71% 72% 72% 74%<br />
Loans/ Assets 58% 50% 57% 58% 59% 59% 60%<br />
Assets/Equity 6.81 8.12 7.04 7.32 7.42 7.54 7.48<br />
(Cash + Net Interbank) /Assets 29% 43% 38% 37% 37% 36% 35%<br />
Deposits/ Total Funding 94% 95% 94% 95% 95% 95% 95%<br />
Asset Quality 2010 2011 2012E 2013E 2014E 2015E 2016E<br />
NPL Ratio 4.67% 4.29% 4.30% 4.00% 3.90% 3.80% 3.70%<br />
NPL Coverage Ratio 89% 129% 134% 138% 146% 153% 161%<br />
Cost of Risk (% of Gross Loans) 1.99% 1.83% 1.40% 1.20% 1.20% 1.20% 1.20%<br />
Capital Adequacy 2010 2011 2012E 2013E 2014E 2015E 2016E<br />
Tier 1 16.6% 15.5% 15.7% 15.8% 15.8% 15.8% 15.9%<br />
CAR 17.5% 18.3% 18.5% 18.5% 18.5% 18.5% 18.7%<br />
Profitability 2010 2011 2012E 2013E 2014E 2015E 2016E<br />
ROAE 3.0% 10.1% 21.7% 14.5% 14.9% 15.3% 18.1%<br />
ROAA 0.5% 1.3% 2.9% 2.0% 2.0% 2.1% 2.4%<br />
NIM 3.34% 2.96% 2.92% 3.06% 3.10% 3.13% 3.61%<br />
Cost to Income 65.3% 57.6% 53.5% 50.8% 50.1% 48.8% 45.8%<br />
Operating Income Attribution 2010 2011 2012E 2013E 2014E 2015E 2016E<br />
Net Interest Income 57% 51% 50% 51% 53% 54% 58%<br />
Fee Income 31% 33% 36% 37% 37% 36% 33%<br />
Other Income 12% 15% 13% 12% 11% 10% 9%<br />
42