financials - Bank Audi
financials - Bank Audi
financials - Bank Audi

You also want an ePaper? Increase the reach of your titles
YUMPU automatically turns print PDFs into web optimized ePapers that Google loves.
August 24, 2012<br />
FINANCIALS<br />
EQUITY RESEARCH<br />
RIYAD BANK<br />
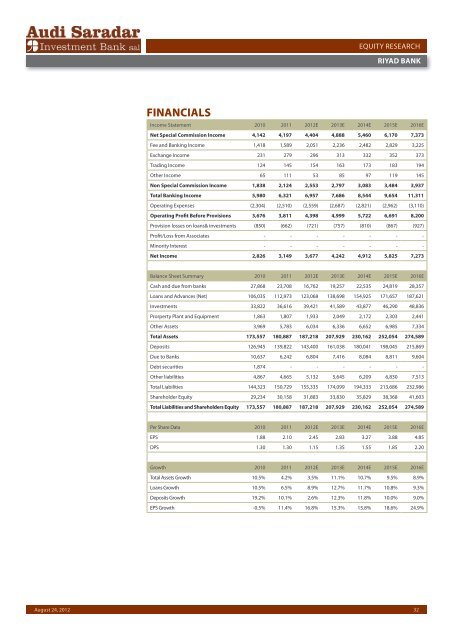
Income Statement 2010 2011 2012E 2013E 2014E 2015E 2016E<br />
Net Special Commission Income 4,142 4,197 4,404 4,888 5,460 6,170 7,373<br />
Fee and <strong>Bank</strong>ing Income 1,418 1,589 2,051 2,236 2,482 2,829 3,225<br />
Exchange Income 231 279 296 313 332 352 373<br />
Trading Income 124 145 154 163 173 183 194<br />
Other Income 65 111 53 85 97 119 145<br />
Non Special Commission Income 1,838 2,124 2,553 2,797 3,083 3,484 3,937<br />
Total <strong>Bank</strong>ing Income 5,980 6,321 6,957 7,686 8,544 9,654 11,311<br />
Operating Expenses (2,304) (2,510) (2,559) (2,687) (2,821) (2,962) (3,110)<br />
Operating Profit Before Provisions 3,676 3,811 4,398 4,999 5,722 6,691 8,200<br />
Provision losses on loans& investments (850) (662) (721) (757) (810) (867) (927)<br />
Profit/Loss from Associates - - - - - - -<br />
Minority Interest - - - - - - -<br />
Net Income 2,826 3,149 3,677 4,242 4,912 5,825 7,273<br />
Balance Sheet Summary 2010 2011 2012E 2013E 2014E 2015E 2016E<br />
Cash and due from banks 27,868 23,708 16,762 19,257 22,535 24,819 28,357<br />
Loans and Advances (Net) 106,035 112,973 123,068 138,698 154,925 171,657 187,621<br />
Investments 33,822 36,616 39,421 41,589 43,877 46,290 48,836<br />
Prorperty Plant and Equipment 1,863 1,807 1,933 2,049 2,172 2,303 2,441<br />
Other Assets 3,969 5,783 6,034 6,336 6,652 6,985 7,334<br />
Total Assets 173,557 180,887 187,218 207,929 230,162 252,054 274,589<br />
Deposits 126,945 139,822 143,400 161,038 180,041 198,045 215,869<br />
Due to <strong>Bank</strong>s 10,637 6,242 6,804 7,416 8,084 8,811 9,604<br />
Debt securities 1,874 - - - - - -<br />
Other liabilities 4,867 4,665 5,132 5,645 6,209 6,830 7,513<br />
Total Liabilities 144,323 150,729 155,335 174,099 194,333 213,686 232,986<br />
Shareholder Equity 29,234 30,158 31,883 33,830 35,829 38,368 41,603<br />
Total Liabilities and Shareholders Equity 173,557 180,887 187,218 207,929 230,162 252,054 274,589<br />
Per Share Data 2010 2011 2012E 2013E 2014E 2015E 2016E<br />
EPS 1.88 2.10 2.45 2.83 3.27 3.88 4.85<br />
DPS 1.30 1.30 1.15 1.35 1.55 1.85 2.20<br />
Growth 2010 2011 2012E 2013E 2014E 2015E 2016E<br />
Total Assets Growth 10.5% 4.2% 3.5% 11.1% 10.7% 9.5% 8.9%<br />
Loans Growth 10.5% 6.5% 8.9% 12.7% 11.7% 10.8% 9.3%<br />
Deposits Growth 19.2% 10.1% 2.6% 12.3% 11.8% 10.0% 9.0%<br />
EPS Growth -0.5% 11.4% 16.8% 15.3% 15.8% 18.6% 24.9%<br />
32