sabic - Search Center - Bank Audi
sabic - Search Center - Bank Audi
sabic - Search Center - Bank Audi

You also want an ePaper? Increase the reach of your titles
YUMPU automatically turns print PDFs into web optimized ePapers that Google loves.
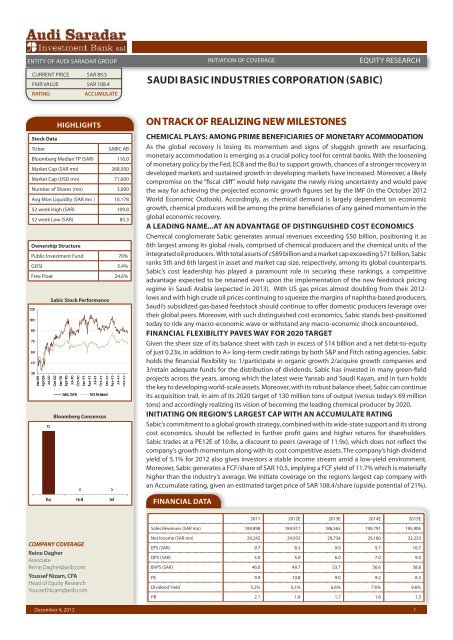
ENTITY OF AUDI SARADAR GROUP<br />
CURRENT PRICE SAR 89.5<br />
FAIR VALUE SAR 108.4<br />
RATING ACCUMULATE<br />
Stock Data<br />
December 4, 2012<br />
HIGHLIGHTS<br />
Ticker SABIC AB<br />
Bloomberg Median TP (SAR) 116.0<br />
Market Cap (SAR mn) 268,500<br />
Market Cap (USD mn) 71,600<br />
Number of Shares (mn) 3,000<br />
Avg Mon Liquidity (SAR mn ) 10,178<br />
52 week High (SAR) 109.8<br />
52 week Low (SAR) 85.3<br />
Ownership Structure<br />
Public Investment Fund 70%<br />
GOSI 5.4%<br />
Free Float 24.6%<br />
Sabic Stock Performance<br />
Bloomberg Consensus<br />
COMPANY COVERAGE<br />
Reine Dagher<br />
Associate<br />
Reine.Dagher@asib.com<br />
Youssef Nizam, CFA<br />
Head of Equity Research<br />
Youssef.Nizam@asib.com<br />
SAUDI BASIC INDUSTRIES CORPORATION (SABIC)<br />
ON TRACK OF REALIZING NEW MILESTONES<br />
EQUITY RESEARCH<br />
CHEMICAL PLAYS: AMONG PRIME BENEFICIARIES OF MONETARY ACOMMODATION<br />
As the global recovery is losing its momentum and signs of sluggish growth are resurfacing,<br />
monetary accommodation is emerging as a crucial policy tool for central banks. With the loosening<br />
of monetary policy by the Fed, ECB and the BoJ to support growth, chances of a stronger recovery in<br />
developed markets and sustained growth in developing markets have increased. Moreover, a likely<br />
compromise on the “fiscal cliff” would help navigate the newly rising uncertainty and would pave<br />
the way for achieving the projected economic growth figures set by the IMF (in the October 2012<br />
World Economic Outlook). Accordingly, as chemical demand is largely dependent on economic<br />
growth, chemical producers will be among the prime beneficiaries of any gained momentum in the<br />
global economic recovery.<br />
A LEADING NAME...AT AN ADVANTAGE OF DISTINGUISHED COST ECONOMICS<br />
Chemical conglomerate Sabic generates annual revenues exceeding $50 billion, positioning it as<br />
6th largest among its global rivals, comprised of chemical producers and the chemical units of the<br />
integrated oil producers. With total assets of c$89 billion and a market cap exceeding $71 billion, Sabic<br />
ranks 5th and 6th largest in asset and market cap size, respectively, among its global counterparts.<br />
Sabic’s cost leadership has played a paramount role in securing these rankings, a competitive<br />
advantage expected to be retained even upon the implementation of the new feedstock pricing<br />
regime in Saudi Arabia (expected in 2013). With US gas prices almost doubling from their 2012lows<br />
and with high crude oil prices continuing to squeeze the margins of naphtha-based producers,<br />
Saudi’s subsidized gas-based feedstock should continue to offer domestic producers leverage over<br />
their global peers. Moreover, with such distinguished cost economics, Sabic stands best-positioned<br />
today to ride any macro-economic wave or withstand any macro-economic shock encountered.<br />
FINANCIAL FLEXIBILITY PAVES WAY FOR 2020 TARGET<br />
Given the sheer size of its balance sheet with cash in excess of $14 billion and a net debt-to-equity<br />
of just 0.23x, in addition to A+ long-term credit ratings by both S&P and Fitch rating agencies, Sabic<br />
holds the financial flexibility to: 1/participate in organic growth 2/acquire growth companies and<br />
3/retain adequate funds for the distribution of dividends. Sabic has invested in many green-field<br />
projects across the years, among which the latest were Yansab and Saudi Kayan, and in turn holds<br />
the key to developing world-scale assets. Moreover, with its robust balance sheet, Sabic can continue<br />
its acquisition trail, in aim of its 2020 target of 130 million tons of output (versus today’s 69 million<br />
tons) and accordingly realizing its vision of becoming the leading chemical producer by 2020.<br />
INITIATING ON REGION’S LARGEST CAP WITH AN ACCUMULATE RATING<br />
Sabic’s commitment to a global growth strategy, combined with its wide-state support and its strong<br />
cost economics, should be reflected in further profit gains and higher returns for shareholders.<br />
Sabic trades at a PE12E of 10.8x, a discount to peers (average of 11.9x), which does not reflect the<br />
company’s growth momentum along with its cost competitive assets. The company’s high dividend<br />
yield of 5.1% for 2012 also gives investors a stable income stream amid a low-yield environment.<br />
Moreover, Sabic generates a FCF/share of SAR 10.5, implying a FCF yield of 11.7% which is materially<br />
higher than the industry’s average. We initiate coverage on the region’s largest cap company with<br />
an Accumulate rating, given an estimated target price of SAR 108.4/share (upside potential of 21%).<br />
FINANCIAL DATA<br />
INITIATION OF COVERAGE<br />
2011 2012E 2013E 2014E 2015E<br />
Sales Revenues (SAR mn) 189,898 184,917 186,565 190,791 195,906<br />
Net Income (SAR mn) 29,242 24,933 29,734 29,180 32,233<br />
EPS (SAR) 9.7 8.3 9.9 9.7 10.7<br />
DPS (SAR) 5.0 5.0 6.0 7.0 9.0<br />
BVPS (SAR) 46.0 49.7 53.7 56.6 58.8<br />
PE 9.9 10.8 9.0 9.2 8.3<br />
Dividend Yield 5.2% 5.1% 6.6% 7.6% 9.6%<br />
PB 2.1 1.8 1.7 1.6 1.5<br />
1
SABIC INITIATION OF COVERAGE<br />
EQUITY RESEARCH<br />
December 4, 2012<br />
FOOTNOTES<br />
INVESTMENT CASE<br />
CHEMICAL PLAYS: AMONG PRIME BENEFICIARIES OF MONETARY ACOMMODATION<br />
As the global recovery is losing its momentum and signs of sluggish growth are resurfacing, monetary<br />
accommodation is emerging as a crucial policy tool for central banks. Quantitative easing measures<br />
are already underway given: the unlimited bond-purchase program announced by the European<br />
Central <strong>Bank</strong> on September 6, the third round of bond-buying by the US Federal Reserve announced<br />
on September 13th, and the <strong>Bank</strong> of Japan following suit by expanding its asset-purchase fund by<br />
$264 billion. Positive stimulus signals have also extended from China with an infrastructure package<br />
of $158 billion approved in early September. As such, with the loosening of monetary policy by<br />
the Fed, ECB and the BoJ to support growth, chances of a stronger recovery in developed markets<br />
and sustained growth in developing markets have increased. Moreover, a likely compromise on the<br />
“fiscal cliff” would help navigate the newly rising uncertainty and would pave the way for achieving<br />
the projected economic growth figures set by the IMF (in the October 2012 World Economic<br />
Outlook). Accordingly, as chemical demand is largely dependent on economic growth and as<br />
earnings of chemical companies closely track the global manufacturing and industrial activities,<br />
chemical producers will be among the first and the largest to build on any gained momentum in the<br />
global economic recovery. Accordingly, the improvement in real demand for chemicals, combined<br />
with the well-paced capacity expansions, should elevate the global chemical utilization rate from its<br />
33-month low of 84.8%.<br />
Table 1: Projected Growth Rates of Key Economies<br />
Real GDP % 2011 2012E 2013E<br />
World 3.8% 3.3% 3.6%<br />
Advanced Economies 1.6% 1.3% 1.5%<br />
US 1.7% 2.2% 2.1%<br />
Euro Area 1.4% -0.4% 0.2%<br />
Emerging Economies 6.2% 5.3% 5.6%<br />
China 9.2% 7.8% 8.2%<br />
India 7.1% 4.9% 6.0%<br />
Source: IMF World Economic Outlook, October 2012<br />
KEY CHEMICAL MARKETS EXPECTED TO TIGHTEN<br />
Despite a bearish demand environment for crude oil, prices are not expected to subdue in the<br />
medium-term with projections signaling a c$110/bbl floor for Brent. The support for crude oil prices<br />
should stem from: 1/geo-political risks in the region 2/ stimulus effect of QE3 by the US Fed and<br />
3/ further stimulus measures by other key central banks. Not to mention that the first two factors<br />
are expected to linger for an undefined period of time, as geo-political tensions are escalating and<br />
the quantitative easing of the US Federal Reserve is widely expected to be the open-ended type of<br />
bond-buying.<br />
On another front, the oversupplied global chemical markets are expected to tighten over next 4-5<br />
years on the back of stronger chemical demand, as a recovery in developed markets and strong<br />
growth in emerging markets lead to additional demand. Global demand for ethylene, the most<br />
common basic chemical in the industry, is projected to grow at a CAGR of 4.53% for the period 2011<br />
till 2016. Global capacity for ethylene, on the other hand, is projected to grow at a CAGR of 3.05%<br />
for the same period given limited capacity additions across the globe. The excess oversupply of<br />
ethylene is expected to fall from an estimated 23 million tons in 2011 to an estimated 16 million tons<br />
in 2016. Accordingly, the share of the ethylene surplus of global supply will contract from 15.5% to<br />
9.3% for the same period 1 .<br />
1 Source: Braskem Investor Relations presentation, citing IHS<br />
2
SABIC<br />
December 4, 2012<br />
FOOTNOTES<br />
INITIATION OF COVERAGE EQUITY RESEARCH<br />
As a result, with a strong crude oil environment 2 and a tighter global chemical market, downside<br />
risk to chemical prices is limited, providing opportunities of wider margins for fixed-cost producers<br />
such as Sabic.<br />
Chart 1: Brent Price Forecasts ($/bbl) Chart 2: Global Ethylene Market<br />
Source: Bloomberg Commodity Price Forecasts Source: Braskem Investor Relations presentation, citing IHS<br />
On a further note, the global industry cost curve is being reshaped with the boom in shale gas<br />
development in the US and the coal-to-chemical technologies in China. The US, which historically<br />
dominated the production landscape, is regaining ground with a wave of new petrochemical<br />
investments estimated at $25 billion 3 . The boost in North American ethylene capacity, estimated at<br />
10 million tons through 2017 or 6.5% of global ethylene capacity 4 , is taking place as the country’s<br />
ethane is resurfacing as a globally competitive feedstock. China, already a leading producer<br />
of petrochemicals, is boosting its share as it is tapping into coal as a new feedstock (given its<br />
massive coal reserves and low prices of coal in the inland West of the country). Yet even with these<br />
developments, the Middle East and particularly Saudi Arabia will remain positioned at the bottom<br />
of the industry cost curve and will accordingly retain its cost leadership (for further details, please<br />
refer to p.13).<br />
Chart 3: Market Shares of Top Producers Chart 4: 2011 Chemical Output of GCC (mn MT)<br />
Source: KPMG, cited by Sixth Annual GPCA Forum Source: MEED<br />
2 Petrochemical prices have a propensity to trail crude oil prices, as the marginal cost of petrochemical production<br />
is determined by naphtha-based producers (mainly European producers)<br />
3 Source: American Chemistry Council, cited by Bloomberg<br />
4 Source: Nexant, cited by Bloomberg<br />
3
SABIC<br />
December 4, 2012<br />
FOOTNOTES<br />
INITIATION OF COVERAGE EQUITY RESEARCH<br />
FERTILIZER INDUSTRY FUNDAMENTALS STILL FIRM<br />
Agricultural market conditions have remained tight. Global grain stocks are still at a historical low,<br />
with the stocks-to-use ratio falling significantly over the past ten years. Corn, the most traded<br />
grain in the global coarse grain trade, is witnessing falling stock-to-consumption levels for the crop<br />
calendar year 2012/13, reaching historical lows again.<br />
Chart 5: Global Stocks-to-Use % of Corn<br />
Source: Bloomberg<br />
Moreover, the world population is progressively increasing and eating habits, especially in<br />
developing countries, are improving. In turn, and amid such low stock levels, there is a need for an<br />
increase in global grain production to counter the continuing growth in demand for food, feed and<br />
fuel. Strong grain prices in the markets today should also incentivize farmers to increase agricultural<br />
activity. With global grain production supported across the years, fertilizer demand should also<br />
remain strong. Global demand for nitrogen fertilizers is projected to grow at a CAGR of 1.5% for the<br />
period 2012-2016, with global demand for urea specifically projected to grow at a CAGR 2.1% for<br />
the same period. Global supply of nitrogen fertilizers is also expected to largely increase in parallel,<br />
particularly with the emergence of new capacity in China, with figures pointing to a CAGR 12-16 of<br />
3.6%. Global supply of urea is projected to grow at a CAGR of 4.1% for the period 2012-2016 5 .<br />
Although the growing surplus in the nitrogen fertilizer markets threatens the long-term outlook<br />
of the industry, this threat should be mitigated given that the fertilizer industry today is demanddriven.<br />
Moreover, support for the industry, particularly pricing support, should stem from:<br />
1 Limited export volumes from China, given its strict urea export policy, keeping global markets<br />
somewhat immune from its massive capacity additions<br />
1 Continued project delays slowing down projected capacity growth<br />
1 A tight global grain outlook keeping prices at historical highs<br />
1 Attractive grain prices incentivizing farmers<br />
1 Swing producers’ production cost remaining relatively high<br />
5 Fertilizer Outlook 2012-2016, IFA<br />
4
SABIC<br />
December 4, 2012<br />
FOOTNOTES<br />
INITIATION OF COVERAGE EQUITY RESEARCH<br />
These factors should continue supporting fertilizer prices, offsetting any downside risks originating<br />
from supply and demand imbalances in the market. In turn, fertilizer producers with both a cash<br />
cost advantage and a strong market presence, such as Sabic’s fertilizer SBU 6 , should stand best<br />
to capitalize on this stable industry environment and earn a stable income amidst such a volatile<br />
macro-economic environment.<br />
GCC STEEL MARKET STILL EXHIBITING BUOYANT FACTORS<br />
The global steel capacity utilization continues to be around 80%, reflecting weak demand and<br />
major overcapacity. These factors have exerted downward pressure on steel prices, reflected<br />
through a plunge of c14% over the course of the year. Iron ore prices have also fallen by c16% this<br />
year, with the industry expecting continued pricing weakness in the medium-term on the back of 1/<br />
an anemic global economic recovery and 2/ rising output for iron ore. As such, with iron ore prices<br />
continuing to decline in the medium term 7 , the iron ore industry is expected to face the longest bear<br />
market in two decades. The plunging raw material prices should drag steel prices further, given that<br />
the recovery in global steel demand seems distant especially with the faltering economic growth in<br />
China, the world’s largest steelmaker. Nevertheless, the long-term demand outlook for steel remains<br />
positive.<br />
The medium-term market dynamics of the GCC region differ somewhat from those abroad, given<br />
strong regional demand stemming from 1/ high oil prices 2/ government infrastructure projects<br />
and 3/ World Cup 2022 in Qatar, all coupled with a steel shortage in the region 8 . As such, steel<br />
demand in the region is projected to remain buoyant with this healthy pace of infrastructure, real<br />
estate and industrial investments (especially in Saudi Arabia and Qatar). Forecasted growth for<br />
rebar demand in the region is at 10%-15% over the next 5 years 9 . Moreover, the region’s significant<br />
growth potential for steel is reflected by the numerous steel projects on track, estimated at more<br />
than $18 billion worth of investments 10 (For a detailed list of the steel projects in the region, please<br />
refer to Appendix H). Accordingly, the region’s firm steel drive should somewhat support prices, over<br />
the next few years, despite the weaker global market picture. More specifically, in Saudi Arabia,<br />
Sabic’s Hadeed is the main provider of steel rebars, dictating the steel prices in the Kingdom and<br />
accordingly largely benefiting from this pricing power during weak global trends (especially when<br />
the Kingdom imposes import tariffs on steel rebars originating from outside the GCC). Furthermore,<br />
with iron ore as the primary raw material for region’s steelmakers and with the region holding little<br />
iron ore of its own, any decrease in the commodity’s price should result in wider margins for Sabic’s<br />
Hadeed and other steel manufacturers in the GCC.<br />
6 Sabic’s Fertilizer SBU represents 8% of Sabic›s total sales output<br />
7 Bloomberg commodity price forecasts point to a median of $137.5/mt, $130/mt and $115/mt for the years<br />
2013, 2014 and 2015 versus $179/ton average for 2012<br />
8 GCC’s annual steel production is c10 million tons vs annual consumption of c25 million tons (Source: MEED)<br />
9 Source: MEED 2012<br />
10 Source: MEED 2012<br />
5
SABIC<br />
December 4, 2012<br />
INITIATION OF COVERAGE EQUITY RESEARCH<br />
SABIC: POSITIONED AMONG LEADING NAMES OF THE INDUSTRY<br />
Sabic is one of the world’s leading diversified chemical companies. It generates annual revenues<br />
exceeding $50 billion, securing a position among the world’s largest chemical firms. The company<br />
ranks 6th largest in revenues against its global rivals, comprised of chemical producers and the<br />
chemical units of the integrated oil producers. Sabic is among the top producers of polyethylene,<br />
polypropylene, advanced thermoplastics, glycols, methanol and fertilizers.<br />
Chart 6: Top Companies by Chemical Sales (USD mn)<br />
Source: ICIS, Bloomberg<br />
With total assets of c$89 billion, Sabic ranks 5th largest amongst these firms. In terms of market cap,<br />
Sabic’s value exceeds $71 billion, which also makes it the 6th largest company in the industry. As a<br />
regional player, Sabic has grown, organically and via acquisitions, to reach the top ranks within its<br />
league. With a committed growth strategy in place, expansions underway and massive financial<br />
flexibility, Sabic is poised to retain its leading spot in the industry.<br />
Chart 7: Market Cap of Peers (USD mn)<br />
Source: Bloomberg<br />
6
SABIC<br />
December 4, 2012<br />
FOOTNOTES<br />
INITIATION OF COVERAGE EQUITY RESEARCH<br />
In terms of production volumes, Sabic is the world’s fifth largest producer of polyolefins, producing<br />
over 8 million tons of polyethylene and polypropylene. However, the bulk of Sabic’s polyolefins<br />
output is polyethylene, with output near 6 million tons.<br />
Chart 8: Approximate Production Capacities of Leading 5 Polyolefin Producers (mn tons)<br />
Source: Borealis Facts and Figures 2011/12<br />
Sabic’s product rankings are as follows:<br />
1 Sabic ranks as world’s largest producer of Ethylene glycol 11 , MTBE, Granular Urea, Polyphenylene<br />
and Polyether Imide 12 .<br />
1 Sabic ranks as world’s 2nd largest producer of Methanol and Polycarbonate 13 .<br />
1 Sabic ranks as world’s 3rd largest producer of Polyethylene, Polybutylene Terephtalate and<br />
Engineering plastics 14 .<br />
In regards to its steel business, Sabic owns one of the largest steel manufacturers in the MENA<br />
region. It has an annual production capacity of more than 5.2 million tons, whereby steel rebars<br />
make up c75% of total steel output. Moreover, Hadeed enjoys a market share of over 25% in the<br />
GCC rebar market 15 .<br />
With such rankings among its industry peers, Sabic is best-positioned to capitalize on any upturn in<br />
the global markets.<br />
11 Ethylene glycol output amounted to 6.7 million tons for 2011 or 9.7% of Sabic’s total output (Source: Sabic)<br />
12 Source: Sabic<br />
13 Source: Sabic<br />
14 Source: Sabic<br />
15 Source: MEED<br />
7
SABIC<br />
December 4, 2012<br />
FOOTNOTES<br />
INITIATION OF COVERAGE EQUITY RESEARCH<br />
FINANCIAL FLEXIBILITY PAVES WAY FOR 2020 TARGET<br />
Sabic’s balance sheet is fairly robust with cash exceeding $14 billion and a net debt-to-equity of<br />
just 0.23x vis-à-vis a peer average of 0.58x. The company’s Debt-to-Ebitda of 1.7x is also below<br />
the industry average of 2.2x, while enjoying double-digit interest coverage for over ten quarters.<br />
Moreover, Sabic’s interest coverage of 18.1x well exceeds its peer average of 8.8x. In parallel, Sabic<br />
enjoys A+ long-term credit ratings by both S&P and Fitch rating agencies. Given its strong financial<br />
position and favorable credit ratings, Sabic holds the financial flexibility to: 1/participate in organic<br />
growth 2/acquire growth companies 3/ invest in its innovation capability and 4/retain adequate<br />
funds for the distribution of dividends. It is noteworthy highlighting that Sabic has announced<br />
previously this year that it intends to repay $7 billion of debt in 2012. In turn, the significant<br />
deleveraging in 2012 and the years to come should increase notably its cash dividend pay-outs.<br />
Chart 9: Projected Gearing Level Chart 10: Projected Dividend Stream<br />
Source: ASIB Estimates Source: ASIB Estimates<br />
Sabic has invested in many green-field projects across the years, among which the latest were<br />
Yansab and Saudi Kayan, and in turn has the expertise of developing world-scale assets. Moreover,<br />
with its robust balance sheet, Sabic can continue its acquisition trail, in aim of its 2020 target of<br />
130 million tons of output (versus today’s 69 million tons) and accordingly realizing its vision of<br />
becoming the leading chemical producer by 2020. It is noteworthy to mention that Sabic is aiming<br />
to launch over 30 new performance chemicals and polymers in the coming several years, part of<br />
its 2020 vision where this new product line will represent 10% of the company’s revenues by that<br />
year 16 . Thus, the Performance Chemicals SBU will be one of the core drivers of growth.<br />
AN INDUSTRY LEADER WITH CONTINUOUS ACQUISITION APPETITE<br />
Sabic is one of the world’s largest and fastest-growing petrochemical producers, with its 2011<br />
production volume exceeding 69 million tons. With a global growth strategy intact, the company<br />
has been on an acquisition mode for years, making investments around the world. Through these<br />
acquisitions, Sabic has expanded its product portfolio, acquired world-class technology and<br />
boosted its market presence.<br />
16 Saudi Kayan was one of Sabic’s first projects in the performance chemicals arena. It represented the first company<br />
within the Middle East to produce and sell these specialty chemicals. The first shipment of ethanolamines<br />
and ethoxylates was made in June 2012.<br />
8
SABIC<br />
December 4, 2012<br />
FOOTNOTES<br />
Sabic’s most known for its acquisitions of:<br />
1 GE Plastics, US, in 2007 for $11.6 billion<br />
INITIATION OF COVERAGE EQUITY RESEARCH<br />
1 Huntsman Petrochemicals’ UK operations in 2006 for $685 million<br />
1DSM’s petrochemical unit, Europe, in 2002 for $2.1 billion<br />
Currently market sources are pointing out to another potential acquisition eyed by Sabic, most likely<br />
a company “with a large amount of its own licensed technology, especially in the specialty plastics<br />
sector” (MEED, August 2012). This will fasten Sabic’s path to securing the top spot in the industry, as<br />
it will obtain the technology expertise it misses across the chemical value chain 17 .<br />
NEW EXPANSIONS TAKING SABIC DOWNSTREAM<br />
Sabic has gone through three stages of major expansion since 1976. The company is operationally<br />
present in more than 40 countries, owning about 60 production plants across the globe The<br />
company’s fast expansion has allowed it to reach production volumes of c69 million tons for 2011.<br />
This compares with c47 million tons for 2005 and 6.3 million tons in 1983, when the first plant went<br />
onstream.<br />
Chart 11: Track Record of Events<br />
30% IPO<br />
1984<br />
Source: Sabic Capital<br />
DSM<br />
Petrochemicals<br />
2002<br />
Huntsman UK<br />
Petrochemicals<br />
2006<br />
The latest expansions to go online have been:<br />
GE Plastics<br />
2007<br />
Sinopec Sabic<br />
Tianjin<br />
Petrochemical Co.<br />
Yansab and<br />
Sharq<br />
2010 2010<br />
Saudi<br />
Kayan<br />
1 The integrated phosphate complex of Maaden Phosphate Company, a 70:30 joint venture<br />
between Maaden and Sabic (October 2011). The complex has an annual production capacity<br />
of 2.9 million tons of phosphate fertilizers and 1.1 million tons of ammonia. Investment cost<br />
of this project was $5.5 billion.<br />
1 Cracker of Saudi Kayan, the region’s first producer of polycarbonates (October 2011), followed<br />
by the downstream units. The project, a partnership between Sabic and Al Kayan Petrochemical<br />
Co., has an annual production capacity of 6 million tons of petrochemicals. Investment cost of<br />
this project was $10.8 billion.<br />
1 Phase I of Sinopec Sabic Tianjin Petrochemical Co., a 50-50 joint venture with Sinopec 18 (May<br />
2010). The Tianjin-based plant has an annual production capacity of 3.2 million tons of<br />
petrochemicals, comprised of a one-million ton ethylene cracker and eight downstream units.<br />
Investment cost of this project was $2.7 billion.<br />
1 Phase III of Sharq, a 50-50 joint venture with a group of Japanese companies (April 2010).<br />
This expansion added close to 3 million tons of various petrochemicals, mainly ethylene (1.3<br />
million tons), HDPE (400 thousand tons), LDPE (400 thousand tons) and ethylene glycol (700<br />
thousand tons). Sharq’s production capacity increased to 5 million tons/annum, confirming its<br />
status as the world’s largest producer of ethylene glycol.<br />
17 Sabic has already accelerated its quest for more technology licenses, signing licensing deals lately with technology<br />
providers, such as Mitsui and Linde, for the production of toluene diisocyanate (TDI) and methylene<br />
diphenyl diisocyanate (MDI).<br />
18 China Petroleum and Chemical Corporation<br />
2011<br />
9
SABIC<br />
December 4, 2012<br />
INITIATION OF COVERAGE EQUITY RESEARCH<br />
1 Yansab, another Sabic landmark project, with an annual production capacity of 4 million<br />
tons (March 1 2010). Key products are polyethylene (800 thousand tons), ethylene glycol (700<br />
thousand tons) and polypropylene (400 thousand tons). Investment cost for this project was<br />
$5.6 billion.<br />
Sales volumes have amounted to 54 million tons for 2011, versus 37 million tons for 2005. This<br />
growth translates into a CAGR of 6.7% and 6.8%, in production and sales volumes respectively,<br />
for the period 2005-11. Looking beyond, with the diverse expansions going online, Sabic should<br />
witness an estimated CAGR of 4.1% and 3.1% in production and sales volumes, respectively, for the<br />
period 2011-2015.<br />
A large part of the company’s production takes place in Saudi Arabia, with European operations<br />
contributing c20% to the total polymers output and c11% to total chemicals output. On a further<br />
note, European-produced basic chemicals account for 7% of Sabic’s total selling volumes, where as<br />
European-produced polymers account for 4% of Sabic’s total selling volumes.<br />
Chart 12: Production and Sales Volumes (million mt)<br />
Source: Company Reports<br />
Expansions coming onstream in the near-term include:<br />
1 Phase VIII of Gas is expected to begin production by year-end 2012. The expansion has a<br />
production capacity of 1.2 million tons of oxygen gas and 1 million tons of nitrogen gas.<br />
1 Hadeed new steel plant, with an annual production capacity of 1 million tons of steel billets and<br />
500 thousand of long steel products, is expected to be completed in September 2013. Once<br />
operational, Hadeed’s annual production capacity will rise to over 6 million tons, whereby<br />
long products will represent 4 million tons or a 67% share. According to Sabic, ‘the new plant<br />
will make Hadeed self-sufficient in feedstock, intermediate and finished products” and will<br />
therefore protect it to some extent from the fluctuations in the international steel market. The<br />
plant’s estimated investment cost is $630 million.<br />
1 A $400 million plant, for the production of purified terephthalic acid (PTA), is scheduled to<br />
begin production in early 2013. The plant, owned by Ibn Rushd, will have an annual production<br />
capacity of 350 thousand tons of PTA which will be used as feedstock for the production of<br />
polyethylene terepthalate (PET).<br />
1 A polyacetal production plant, in partnership with Celanese Corp., is expected to go onstream<br />
in 2013. The Jubail-based plant, with an annual production capacity of 50 thousand tons, will<br />
use in-house methanol as feedstock for the production of polyacetal. The plant is part of the<br />
National Methanol Co. (Ibn Sina) complex, which is 50% owned by Sabic and the remainder<br />
equally owned by Celanese Corp. and an affiliate of Duke Energy Corp. Total investment cost<br />
for this project is estimated at $400 million.<br />
10
SABIC<br />
December 4, 2012<br />
FOOTNOTES<br />
INITIATION OF COVERAGE EQUITY RESEARCH<br />
1 Safco V, a urea plant with an annual production capacity of 1.1 million tons, expected in the<br />
third quarter of 2014. Total investment cost of this expansion is estimated at USD 534 million.<br />
1 A methyl-methacrylate (MMA) and poly-methyl-methacrylate (PMMA) plant in Jubail, a 50-<br />
50 joint venture with Mitsubishi Rayon Company, is scheduled to go on-stream in 2013. The<br />
annual production capacity of the MMA plant will be 250 thousand tons, where as the PMMA<br />
plant will produce 40 thousand tons/annum. These products will be produced for the first time<br />
in the Middle East. The project’s estimated investment cost is $1 billion.<br />
1 A N-Butanol production facility, in equal partnership with Saudi Aramco, Dow Chemical and<br />
Tasnee, is scheduled to go online in late 2014. The plant, of an annual production capacity of<br />
330 thousand tons of N-Butanol, will be part of Saudi Kayan’s acrylic complex. The project’s<br />
investment cost is $500 million.<br />
1 A joint venture with Asahi Kasei and Mitsubishi Corp. to develop world-scale plants in Jubail<br />
Industrial City for the production of acrylonitrile and sodium cyanide. The new company will<br />
be named Saudi Japanese Acrylonitrile Co. (Shrouq). The annual production capacities will be<br />
200 thousand tons of acrylonitrile and 40 thousand tons of sodium cyanide. Total investment<br />
cost of this project is estimated at $561 million. Production is scheduled to start during the<br />
final quarter of 2014.<br />
1 Phase II of Sinopec Sabic Tianjin Petrochemical Co. , with an annual production capacity of<br />
260 thousand tons of polycarbonates, is expected to go fully onstream by 2015. Its investment<br />
cost is estimated at $1.7 billion. The Tianjin-based plant, once operational, will position Sabic<br />
among the world’s leading producers of polycarbonates.<br />
1 A world-scale elastomers project, a 50-50 joint venture with Exxon Chemical Arabia (an affiliate<br />
of ExxonMobil Chemical Co.), is scheduled to go online in 2H 2015. The plant is part of the<br />
Al-Jubail Petrochemical Co. (Kemya) complex. The project will have an annual production<br />
capacity of 400 thousand tons of specialty elastomers (poly-butadiene rubber, ethylene<br />
propylene diene monomer rubber, thermoplastic elastomer and MTBE). Total investment cost<br />
for this project is estimated at $3.4 billion.<br />
1 A joint-venture with Saudi Aramco to construct an aromatics plant near Aramco’s present<br />
Yanbu refinery. Tenders have not yet been made, with market expectations pointing to early<br />
2013 for the submission of the tenders. No additional details regarding this project have been<br />
released yet.<br />
Although the expansions that went online in 2010 and 2011 were larger in production scale than<br />
the upcoming ones, the new expansions will nevertheless give Sabic an additional competitive<br />
edge. These additions will be increasing the company’s footprint in the high-growth markets 19 of<br />
specialized chemicals, bringing it closer to the downstream industries such as the automotive and<br />
construction industries. The global markets for the above performance chemicals are exhibiting fast<br />
growth, as new uses for these high-value products are unfolding, thereby increasing their demand.<br />
As such, serving this high growth market will allow Sabic to 1/ largely diversify its income stream<br />
2/ reach its 2020 aim of specialized chemicals constituting 10% of the company’s revenues and 3/<br />
contribute to the Kingdom’s industrial diversification program and job creation.<br />
19 As an example of the high-growth markets for such products, polycarbonate demand in China is expected to<br />
grow annually by c 10%, reaching 1.78 million tons by 2015. Polycarbonate is China’s most imported engineering<br />
plastic, by volume, given domestic production of just 220 thousand tons. (Sabic)<br />
11
SABIC<br />
December 4, 2012<br />
FOOTNOTES<br />
INITIATION OF COVERAGE EQUITY RESEARCH<br />
IN CONTINUAL MODE OF SIGNING NEW DEALS<br />
Sabic has always been on the look-out for new investments and partnerships, however over the<br />
recent years has been focusing on performance chemicals, a new product line which will boost its<br />
competitive edge and take it closer to its 2020 objectives. As observed from the above expansions,<br />
the company has been eyeing several new projects in this specialty chemicals industry and boosting<br />
its dealmaking presence in such markets.<br />
DOMINATING THE DOMESTIC PRODUCTION LANDSCAPE<br />
The growing importance of the Middle East region was evident in its increasing share of global<br />
production over the past decade. From 2001 till 2010, the region’s share of global chemical output<br />
has increased from 10% to 20%, while the US and European share of global output has shrunk from<br />
36% to 24% and from 32% to 21%, respectively. The region’s expanding influence on the industry<br />
should continue in the medium term, as it is projected that the region’s production capacity of<br />
chemicals and petrochemicals will grow at annual rate of 6.6% up until 2016 20 .<br />
Chart 13: Country/Region’s Share of Global Chemical Production (Basic Chemicals)<br />
Source: Petrochemical Industry Overview, SRI Consulting, April 2011, cited by GPCA Sixth Annual Forum<br />
Sabic’s growth has originated from this region and has been a key contributor to the region’s<br />
petrochemical boom, while leading its own country Saudi Arabia’s diversification scheme away from<br />
crude oil. The company today has 15 petrochemical subsidiaries operating in Saudi Arabia, out of<br />
the country’s 42 existing ones (see Appendix G) 21 . Sabic has built chemical clusters in the Kingdom,<br />
with the output of its group representing 95% of the domestic petrochemical production 22 .<br />
Moreover, Saudi Arabia’s production capacity of downstream plastics constitutes c62% of the<br />
GCC’s total capacity. As such, Sabic dominates also the regional production landscape. With the<br />
Saudi government’s firm commitment to moving and expanding downstream (projects tendered<br />
in excess of $20 billion 23 ) and with Sabic’s growing participation in the Kingdom’s downstream<br />
projects, becoming the world’s leading producer of petrochemicals would not be far from reality.<br />
20 GPCA Sixth Annual Forum<br />
21 Source: MEED<br />
22 Source: US Saudi Arabian Business Council<br />
23 Source: MEED, May 2011<br />
12
SABIC<br />
December 4, 2012<br />
FOOTNOTES<br />
INITIATION OF COVERAGE EQUITY RESEARCH<br />
STRATEGIC PARTNERSHIPS WITH INDUSTRY LEADERS<br />
Sabic’s growth has leveraged on long-term strategic partnerships with industry leaders. Investing in<br />
joint ventures, Sabic has established companies in the MENA region, Asia, US and Europe. Sabic has<br />
projects in partnership with companies such as Shell, Exxonmobil Chemical, Mitsubishi Chemicals<br />
and Sinopec. Partnering with such names has boosted its competitiveness and strengthened its<br />
market presence, allowing it to reach the ranks it has reached today. Lately, the company announced<br />
its intention to invest further in the US, this time in the country’s shale gas projects. This strategic<br />
aim will give Sabic the opportunity to partner again with leading energy firms and to be part of the<br />
US shale gas epoch.<br />
COMPETITIVELY POSITIONED REGIONALLY AND GLOBALLY<br />
As raw materials and utilities are the largest component of production costs in the petrochemical<br />
industry, with capital and labor playing a minor role, a producer’s competitiveness is then mainly<br />
determined by the type of hydrocarbon feedstock it uses and its pricing structure.<br />
Chart 14: Global Ethylene Production by Feedstock<br />
Source: IHS, Global Olefins Update, 6th Annual GPCA Forum<br />
Saudi producers’ access to subsidized gas-based feedstock, has positioned them at the low-end<br />
of the production cost curve, as the bulk of the country’s petrochemical output is produced from<br />
ethane and methane feedstock. According to our estimates, Sabic’s domestic operations account<br />
for c80% of total output, hence a large portion of its total feedstock cost is relatively fixed, leaving<br />
only its European, US and Asian operations 24 , with a variable cost structure. As such, for the bulk of<br />
its operations, its domestic production, Sabic obtains its ethane and methane feedstock at a set<br />
price of $0.75/mmbtu, at the lowest price worldwide 25 , fixed until 2012-2015 depending on the<br />
project. The heavier feedstocks propane and butane are supplied at a 30% discount to C&F Japan<br />
Naphtha price. This vast cost advantage has allowed Sabic during cycles to maintain operating rates<br />
above 90% at its production plants in Saudi Arabia 26 .<br />
24 Output from European plants, which are Sabic’s only pure naphtha-based facilities, represent around 11% of<br />
the company’s total output. US operations represent around 2% and Asian operations represent around 7%.<br />
25 Its GCC neighbors obtain ethane feedstock at a cost ranging between $1.25/mmbtu-$2.50/mmbtu (MEED)<br />
26 Source: Sabic Capital Presentation, 2010<br />
13
SABIC<br />
December 4, 2012<br />
FOOTNOTES<br />
INITIATION OF COVERAGE EQUITY RESEARCH<br />
Further to Saudi Arabia holding one-fifth of the world’s proven oil reserves 27 , with Saudi Aramco<br />
producing c12% of the world’s crude oil 28 , the Kingdom holds the world’s fourth largest proven<br />
gas reserves. As such, the government is largely committed to growing its gas infrastructure,<br />
which should in turn reduce the gas shortage risk constraining the ethane supply for domestic<br />
petrochemical producers. This sustained competiveness, accordingly, will allow key players such as<br />
Sabic to withstand any global oversupply threats and to remain best positioned to capitalize on any<br />
upturn in the global economy.<br />
On a further note, worries around the price increase of ethane in the Kingdom are exaggerated.<br />
Despite the increase of ethane prices most likely to $1.5/mmbtu, from the current $0.75/mmbtu,<br />
there will remain a price advantage over US gas-based feedstocks and the naphtha-based<br />
feedstocks used by its European peers (which are highly correlated to crude oil prices). Based on<br />
an ethane price of $0.75/mmbtu, the production cost of one ton of ethylene would amount to $90-<br />
$100, whereas if the ethane price jumps to $1.5/mmbtu, ethylene production cost would only rise<br />
to $160/mt. These numbers compare very favorably with average production costs of $700-$800/mt<br />
for naphtha-based operators in Europe and $600/mt for gas-based operators in the US 29 .<br />
In turn, Saudi producers will retain the cost leadership advantage over rivals even upon the<br />
implementation of the new pricing regime (expected in 2013). Moreover, with naphtha-based<br />
producers expected to remain price-setters, profit margins for ethane-based producers such as<br />
Sabic should remain supported across time.<br />
Chart 15: Feedstock Cost Advantage (Ethylene Production Cost)<br />
Source: Bloomberg Commodity Price Forecasts, ASIB estimates Source: MEED, ASIB estimates<br />
LEADING ITS COUNTERPARTS WITH SUPERIOR MARGINS<br />
Generating an operating margin close to 30%, Sabic stands apart from major counterparts who<br />
generate an average operating margin of 11%. With an Ebitda margin of over 30%, Sabic also leads<br />
its peer group who hold an average Ebitda margin of 15%. This wide gap between Sabic and its<br />
global counterparts is in large due to: 1/ the competitive feedstock cost structure 2/ economies of<br />
scale 3/ logistics advantage and 4/ the integrated facilities employing world-scale plants it operates<br />
within Saudi Arabia, which account for the bulk of the company’s total production (17 out of the 23<br />
manufacturing affiliates are based in the KSA). As Sabic is expected to retain this competitiveness,<br />
mainly feedstock competitiveness, the impact on profitability from threats such as cyclical<br />
downturns and increasing competition should be contained.<br />
27 Source: US Energy Information Administration<br />
28 Source: Energy Intelligence, cited by US Energy Information Administration<br />
29 Source: MEED, February 2012<br />
14
SABIC<br />
December 4, 2012<br />
FOOTNOTES<br />
INITIATION OF COVERAGE EQUITY RESEARCH<br />
Chart 16: Peer EBIT Margins (%) Chart 17: Peer EBITDA Margins (%)<br />
Source: Bloomberg Source: Bloomberg<br />
EXPOSED TO OVER 10 INDUSTRIES<br />
Sabic’s product portfolio ranges from chemicals (basic and performance chemicals) to plastics<br />
(polymers and innovative plastics) to fertilizers to steel, whereby an entire range of sub-products<br />
fall under these categories.<br />
The largest strategic business unit (SBU) is the Chemicals SBU, whereby it represents 64% of<br />
production volumes and 58% of sales volumes. This SBU includes performance chemicals or<br />
specialty chemicals, which were first introduced by Saudi Kayan. Having these products in Sabic’s<br />
portfolio will assist in mitigating the company’s exposure to price swings, as specialty chemicals are<br />
less cyclical than traditional or commodity petrochemicals. Moreover, the market for specialized<br />
chemicals does not face an excess oversupply risk, a threat faced by the basic or traditional<br />
petrochemical producers. Finally, specialized chemicals are produced in much smaller volumes,<br />
owing to their specialized structure & functions and are of higher value, with their demand linked<br />
more to performance specifications than price 30 . In turn, brighter and more opportunistic prospects<br />
exist for producers with a portfolio mix that includes these performance chemicals.<br />
Next in line is the Polymers SBU, whereby the bulk pertains to polyethylene and polypropylene<br />
production. Although innovative plastics (dominated by polycarbonates) are the smallest<br />
contributors to Sabic’s total output and sales volume, the contribution of this SBU to total sales<br />
revenues should not be underestimated at all. Products such as polycarbonates and innovative<br />
plastics in general are high-value products, thus they enjoy prices equal to a manifold of those of<br />
commodity or traditional chemicals.<br />
Chart 18: Production Breakdown by SBU Chart 19: Sales Output Breakdown by SBU<br />
*Includes Performance Chemicals *Includes Performance Chemicals<br />
Source: Company Reports 2011 Source: Company Reports 2011<br />
30 Bloomberg BusinessWeek<br />
15
SABIC<br />
December 4, 2012<br />
FOOTNOTES<br />
INITIATION OF COVERAGE EQUITY RESEARCH<br />
Sabic’s exposure to so many industries, with different fundamentals, should largely reduce the<br />
company’s market risk.<br />
A BROAD AND DIVERSIFIED MARKET PRESENCE<br />
Given its global reach of more than 100 countries, Sabic faces limited country risk. In terms of<br />
regions, Asia represents the largest market for Sabic, generating 35% of sales, with the Middle<br />
East making up for the next largest market. Sabic has been continuously seeking new markets and<br />
strengthening its presence in existing home markets, especially in key market China. Its JV in China<br />
with Sinopec, along with its 41 offices, 10 production sites and 5 T&I centers in Asia, has solidified<br />
the company’s foothold in one of the world’s highest growth markets. The geographical proximity<br />
of Asia to Saudi Arabia has given domestic producers a material advantage over European and US<br />
counterparts.<br />
Attractive growth dynamics are also present in the MENA region, as the per capita consumption of<br />
various polymers is significantly below that of North America and Europe 31 . Hence, with ambitious<br />
global growth initiatives set, robust emerging market demand and growth potential in the MENA<br />
region, Sabic’s market share is expected to grow.<br />
Chart 20: Geographical Market Segmentation of Sales Revenues<br />
Source: Company Reports 2011<br />
A STATE-OWNED ASSET CONTRIBUTING TO THE KINGDOM’S WELL-BEING<br />
A stake of 30% was floated to the public in 1984. Since then the Saudi government has retained its<br />
70% of Sabic, through the Public Investment Fund, thus granting Sabic the backing of the world’s<br />
largest holder of oil reserves (KSA’s S&P Credit Rating: AA- for Local and Foreign Currency LT Debt ).<br />
Government support for Sabic has been evident in “feedstock supply, funding and infrastructure”<br />
(Sabic). About 11% of Sabic’s loan book is through funding from government-related agencies.<br />
Moreover, as a state-owned asset, Sabic is leading the country’s industrial diversification program<br />
and developing its downstream industries.<br />
By investing increasingly in the specialty chemicals sector, Sabic is establishing the groundworks<br />
for the government’s drive to add more value to its crude oil. This vision will be realized by taking<br />
the petrochemical industry downstream (key examples are Sabic, Saudi Kayan and Tasnee) and<br />
developing industrial parks at proximity to petrochemical complexes. Such integrated sites should<br />
in turn attract multinational names in prime manufacturing industries such as the automotive and<br />
electronics industries. With these industries developed, and additional jobs created for the young<br />
and unemployed, a large part of the government’s economic program would be implemented.<br />
31 Source: MEED, May 2011<br />
16
SABIC<br />
December 4, 2012<br />
FOOTNOTES<br />
INITIATION OF COVERAGE EQUITY RESEARCH<br />
Finally, it is worth noting that Sabic is a key employer in the Kingdom, having over 15,000 employees<br />
in the country alone 32 . With job creation a top priority for the government of Saudi Arabia, Sabic’s<br />
move downstream will play a major role in meeting these targets. As such Sabic will remain an<br />
integral asset for the Kingdom and will accordingly continue to leverage on its wide state-support,<br />
leading its country’s largest non-oil sector and contributing to the Kingdom’s overall well-being.<br />
TECHNOLOGY & INNOVATION UNIT 33: CONSTANTLY EVOLVING IN AIM OF 2020 VISION<br />
Research, technology and innovation are among the key determinants of a company’s<br />
competitiveness and in turn success. Sabic is constantly investing in new technologies and innovative<br />
solutions, a practice that has given the company its leading status today. Its growing investment in<br />
T&I, with technological fixed assets representing investments of c$90 billion until today 34 , will allow<br />
Sabic to develop the new products targeted by 2020 and in turn realize its objectives. Sabic has its<br />
12 T&I centers spread globally, with ones in Saudi Arabia, the US, Europe, China, Japan, Korea and<br />
India. These centers are present in such countries to make Sabic closer to its partners and more so<br />
to its clients, to better meet their needs. Furthermore, Sabic’s T&I unit “develops more than 150 new<br />
products every year” and enjoys the backing of over 8000 global patents, with Sabic Innovative<br />
Plastics (SIP) holding the lion share as it is supported by more than 5000 global patents 35 . The highperformance<br />
engineered plastics SIP offers are marketed under well-known brands, especially in<br />
the automotive industry, with names such as Lexan, Xenoy, Noryl and Valox. Out of the c$6 billion<br />
worth of intangibles on Sabic’s books, representing 6.8% of total assets, patents and trademarks<br />
constituted around 24% of total intangibles or $1.4 billion (as of September-end 2012).<br />
Despite, Sabic’s current R&D to sales of 0.4% being below the industry average of 1.6% 36 , the<br />
company is increasingly strengthening its focus on R&D. It has three technology centers under<br />
construction and research programs constantly underway.<br />
UNDER-PERFORMER OVER COURSE OF YEAR<br />
Over the course of the year, Sabic’s shares have under-performed global peers (represented by<br />
the Bloomberg World, Americas and EMEA Chemical indices). This could be partially explained by<br />
the region’s social, economic and political instability. However, the unjustified performance gap<br />
should narrow given Sabic’s inherent competitiveness, margin expansion and earnings/cash flow<br />
generating power. Moreover, Sabic, which is down by 7% YTD, has also underperformed Brent crude<br />
oil on a YTD basis by c11% aggregate.<br />
Chart 21: Price Performance (Rebased) Chart 22: Price Performance (Rebased)<br />
Source: Bloomberg Source: Bloomberg<br />
32 Source: Sabic Capital<br />
33 Sabic has restructured its Research & Technology unit, changing its name to Technology & Innovation unit (T&I)<br />
34 Source: Sabic<br />
35 Source: Sabic<br />
36 Source: Bloomberg<br />
17
SABIC<br />
December 4, 2012<br />
FOOTNOTES<br />
INITIATION OF COVERAGE EQUITY RESEARCH<br />
TRADING AT A DISCOUNT TO ITS 10-YEAR HISTORICAL AVERAGE AND TO ITS PEERS<br />
Sabic is trading at PE 12E of 10.8x and a PE 13E of 9.0x, reflecting a discount to the weighted peer<br />
average 37 of 11.9 x and 9.8x, respectively. The discount to peers is not justified owing to its various<br />
competitive advantages, most importantly its cost leadership. Moreover, Sabic is trading at relative<br />
historical lows, trading at 40% discount to its 10-year historical average of 17.8x, signaling the extent<br />
to which global macro-economic and industry threats are factored in its current price. In turn, these<br />
levels provide an attractive entry point for investors.<br />
Chart 23: Sabic Historical PE’s<br />
Source: Bloomberg<br />
INITIATING COVERAGE WITH AN ACCUMULATE RATING<br />
Despite reduced growth prospects for domestic petrochemical producers given feedstock<br />
constraints in Saudi Arabia, Sabic is adamant in pursuing its growth objectives. The company is<br />
delving downstream into new product lines and extending its portfolio. With the company’s growth<br />
momentum expected to continue, and given Sabic’s 1/ secured access to low-cost feedstock 2/ widestate<br />
support 3/ strong balance sheet (net debt-to-equity of just 0.23x), we project further profit<br />
gains in the medium term and higher returns for shareholders. Sabic trades at a PE 12E of 10.8x,<br />
a discount to peers (average of 11.9x), which does not reflect the company’s growth momentum<br />
along with its cost competitive assets. The company’s high dividend yield of 5.1% for 2012 also gives<br />
investors a stable income stream amid a low-yield environment. Moreover, Sabic generates a FCF/<br />
share of SAR 10.5, implying a FCF yield of 11.7% which is materially higher than the industry (peer<br />
average of 8.0%). We initiate coverage on the region’s largest cap company, with an Accumulate<br />
rating given its estimated target price of SAR 108.4/share (upside potential of 21%).<br />
37 The peer group, used to calculate the weighted peer average, is comprised of leading names across all<br />
industries Sabic pertains to.<br />
18
SABIC<br />
December 4, 2012<br />
VALUATION<br />
FCFF VALUATION<br />
INITIATION OF COVERAGE EQUITY RESEARCH<br />
We valued Sabic using the Free Cash Flow to the Firm (FCFF) model, given its strong earnings and<br />
free cash flow power. We accounted for Sabic’s expansions, in addition to the double-edge effect<br />
of crude oil prices on the prices of Sabic’s products together with its impact on the production<br />
cost of mainly its European operations. We ran a regression on petrochemical prices, using oil as<br />
the independent variable given that the marginal cost of petrochemical production is determined<br />
by naphtha-based producers. Furthermore, we included an adjustment factor to account for the<br />
demand/supply imbalances in the various petrochemical markets, and the economic growth outlook<br />
of major end-markets. For the fertilizer and steel SBU, a similar approach was adopted, however we<br />
used the anthracite coal as the independent variable in our regression model for fertilizers and for<br />
the steel SBU we used iron ore as the independent variable for deriving steel prices (both long and<br />
flat). The model was based on a 4-year forecast period, with the below oil prices used and the below<br />
prices for key commodities and products derived.<br />
Table 2: Projected Product Prices<br />
2012E 2013 E 2014 E 2015 E<br />
Brent Crude Oil ($/bbl) 113 109 110 115<br />
Ethylene ($/mt) 1,188 1,124 1,140 1,220<br />
MEG ($/mt) 1,011 992 997 1,021<br />
LDPE ($/mt) 1,330 1,302 1,309 1,344<br />
HDPE ($/mt) 1,355 1,333 1,339 1,365<br />
PP ($/mt) 1,393 1,374 1,378 1,403<br />
Anthracite Coal ($/mt) 207 227 235 236<br />
Urea ($/mt) 489 492 504 506<br />
Ammonia ($/mt) 496 523 529 531<br />
Iron Ore ($/mt) 179 138 130 115<br />
Long Steel ($/mt) 621 512 492 453<br />
Source: Bloomberg Commodity Price Forecasts, ASIB Estimates<br />
Using a long-term expected profitability of 8.9% and a retention rate of 15%, a perpetual growth<br />
rate of 1.3% was derived. The profitability accounted for the premium Sabic retains due to its cost<br />
leadership in the chemical industry, state-of-the-art production plants in addition to its firm statesupport.<br />
For the discount rate, we used a WACC of 10.3%, based on a cost of equity of 14% and a cost<br />
of debt of 2%. The FCFF model resulted in an estimated target price of SAR 112.4/share, implying<br />
upside potential of 26%.<br />
19
SABIC<br />
December 4, 2012<br />
Table 3: FCFF Model<br />
INITIATION OF COVERAGE EQUITY RESEARCH<br />
SAR mn 2012 E 2013 E 2014 E 2015 E<br />
Net Income 24,933 29,734 29,180 32,233<br />
Change in Working Capital (6,087) (1,095) 1,197 952<br />
Non-Cash Charges 12,459 12,570 12,855 13,200<br />
Capex (10,034) (10,124) (10,353) (10,630)<br />
Interest Expense (2,282) (1,841) (1,504) (1,098)<br />
Free Cash Flow to the Firm 35,728 35,118 31,989 34,948<br />
Present Value of Free Cash Flow to the Firm 35,728 28,885 23,863 23,644<br />
Present Value of Terminal Value 268,426<br />
Intrinsic Value of the Firm 380,546<br />
Net Debt 43,268<br />
Intrinsic Value of Equity 337,278<br />
WACC 10.3%<br />
Terminal Growth Rate 1.3%<br />
Shares Outstanding (mn) 3,000<br />
NAV per share (SAR) 112.4<br />
Source: ASIB Estimates<br />
SENSITIVITY ANALYSIS<br />
The data table below presents a sensitivity analysis to our price target valuation assuming various<br />
growth and discount rates. Our calculated fair value of SAR 112.4 /share, for the base case scenario, was<br />
based on a WACC of 10.3 % and a terminal growth rate of 1.3%.<br />
Table 4: Sensitivity Analysis<br />
WACC<br />
Terminal Growth Rate<br />
1.0% 1.5% 2.0% 2.5% 3.0%<br />
8.0% 145.4 155.5 167.4 181.4 198.2<br />
8.5% 135.0 143.7 153.7 165.4 179.3<br />
9.0% 126.0 133.5 142.1 152.0 163.5<br />
9.5% 118.1 124.6 132.0 140.5 150.2<br />
10.0% 111.1 116.9 123.3 130.6 138.9<br />
10.5% 104.9 110.0 115.6 122.0 129.1<br />
11.0% 99.3 103.8 108.8 114.4 120.6<br />
11.5% 94.3 98.3 102.8 107.7 113.2<br />
12.0% 89.8 93.4 97.4 101.7 106.6<br />
Source: ASIB Estimates<br />
20
SABIC<br />
December 4, 2012<br />
RELATIVE VALUATION<br />
INITIATION OF COVERAGE EQUITY RESEARCH<br />
We valued Sabic on an equal basis with selected global peers from across the three industries:<br />
chemical, fertilizer and steel. Our peer group included companies such as Dow Chemical, BASF,<br />
DuPont, Total, Yara, CF Industries and Tata Steel. Again, Sabic should be trading at a premium given<br />
that it: 1/ is positioned at the low-end of the production cost curve 2/ enjoys superior profitability<br />
levels in contrast to its counterparts 3/ has very strong government support and 4/ plays a strategic<br />
role in the country’s economic and social development.<br />
Global peers trade at a weighted average of 11.9x estimated 2012 earnings, opposed to Sabic trading<br />
at 10.8x, implying an unjustified discount. In turn, a fair value of SAR 98.8/share is derived, based on<br />
our 2012 earnings per share (EPS) estimate of SAR 8.31.<br />
On an EV/EBITDA 12E basis, Sabic trades at a multiple of 6.5x versus a weighted peer average of 6.2x.<br />
Yet, given Sabic’s trading premium historically to the industry average, we added this premium which<br />
resulted into a weighted peer average EV/EBITDA 12E of 7.3x Accordingly, based on EBITDA 12E of SAR<br />
54,293 million, a fair value of SAR 105.7/share was obtained.<br />
Table 5: EV/EBITDA Valuation<br />
SAR mn<br />
EBITDA 2012E 54,293<br />
Enterprise Value 396,618<br />
Net Debt as of YE12E 25,210<br />
Minority Interest as of YE12E 54,294<br />
Market Capitalization 317,115<br />
Shares Outstanding 3,000<br />
Source: ASIB Estimates<br />
FINAL VALUATION<br />
NAV per Share (SAR) 105.7<br />
Attributing a 60% weight to the FCFF valuation and a 40% weight to the relative valuation, a final fair<br />
value of SAR 108.4/share was derived for Sabic, offering an upside potential of 21%.<br />
Table 6: Final Valuation<br />
Fair Value (SAR) Weight<br />
FCFF Valuation 112.4 60%<br />
Relative Valuation<br />
Source: ASIB Estimates<br />
P/E 98.8 20%<br />
EV/EBITDA 105.7 20%<br />
Final Fair Value per Share (SAR) 108.4<br />
21
SABIC<br />
December 4, 2012<br />
INVESTMENT RISKS<br />
1 Cyclicality of industry<br />
1 Recessionary threats in US and Europe<br />
1 Hard landing in China<br />
1 Reduced import demand from Asia<br />
INITIATION OF COVERAGE EQUITY RESEARCH<br />
1 Increase of US competitiveness given access to low-cost gas-based feedstocks<br />
1 Dwindling availability of gas feedstock in the Kingdom<br />
1 Upward revision to gas prices in the Kingdom<br />
1 Increasing use of NGL’s (propane, butane and naphtha) in the feedstock mix<br />
1 Rise in costs of feedstocks benzene and propylene (where not entire rise can be passed on to<br />
customers) for US operations<br />
1 Rise in naphtha costs for European operations<br />
1 Price increase in iron ore imports<br />
1 Rise in steel imports from neighboring producers<br />
1 Unannounced plant stoppages<br />
1 Increase in competition from local and neighboring expansions (Borouge, Qatar Petroleum...)<br />
22
SABIC<br />
December 4, 2012<br />
FOOTNOTES<br />
COMPANY PROFILE<br />
INITIATION OF COVERAGE EQUITY RESEARCH<br />
1 Saudi Basic Industries Corp. (Sabic) was established in September 1976 through a royal decree,<br />
with the first plant beginning production in 1981. The company’s capital has been raised<br />
several times, amounting today to SAR 30,000 million comprised of 3,000 million shares of<br />
SAR 10/share.<br />
1 Sabic is a heavy-weight on several regional market indices. The stock represents c10% of the<br />
Tadawul All Share Index and 40% of the Tadawul All Share Petrochemical Index. Furthermore,<br />
it represents c12% of the Bloomberg EMEA Chemicals Index.<br />
1 The company has five strategic business units, whose combined output amounted to 69.1<br />
million tons for the full year 2011. Although separated into two different SBU’s, polymers and<br />
innovative plastics fall under the same product range of plastics. As such, the product range<br />
of Sabic could be narrowed down to: Chemicals-Plastics-Fertilizers-Metals (for a detailed<br />
summary of Sabic’s products, please refer to Appendix C).<br />
Table 7: Breakdown of Production and Sales Volumes (for FY 2011)<br />
(Million Mt) Chemicals* Polymers Fertilizers Metals Innovative<br />
Plastics<br />
Production 44.5 11.3 6.7 5.4 1.1 69.1<br />
Sales 31.4 11.4 4.5 5.5 1.4 54.2<br />
* Includes Performance Chemicals of 439 thousand tons; Performance Chemicals were introduced to Sabic’s portfolio for first<br />
time in 2010<br />
Source: Company Reports 2011<br />
1 Sabic has over 40,000 employees today (versus 790 employees in 1980). There are more<br />
than 15,000 employees in Saudi Arabia, around 11,000 employees in the US, around 6000<br />
employees in Europe, with the remainder spread across various countries.<br />
1 Sabic has operations across 40 countries. The company operates :<br />
- 2 massive production sites in Saudi Arabia (Al-Jubail and Yanbu) comprising 19 world-scale<br />
complexes<br />
- 10 manufacturing sites in Asia<br />
- 17 manufacturing sites in the US<br />
- 13 manufacturing sites in Europe<br />
Overall, Sabic operates a total of 60 world-scale plants 38 .<br />
1 Most of the subsidiaries consolidated in Sabic’s books pertain to the management and<br />
operations of its Chemicals, Polymers and Innovative Plastics SBUs. Among these subsidiaries<br />
are: Sharq, Ar-Razi, Ibn Zahr, Ibn Sina, Kemya, Yanpet, Sadaf, Yansab and Kayan (for a summary<br />
of the subsidiaries consolidated in Sabic’s consolidated financial statements, please refer to<br />
Appendix D).<br />
1 Out of Sabic’s 24 manufacturing affiliates, 18 affiliates are for the production of petrochemicals,<br />
three affiliates are for the production of fertilizers and the remaining three are for the<br />
production of steel. Moreover, most of Sabic’s manufacturing affiliates are based in Saudi<br />
Arabia (for a summary of Sabic’s manufacturing affiliates, please refer to Appendix F).<br />
38 Source: Sabic<br />
Total<br />
23
SABIC<br />
December 4, 2012<br />
FOOTNOTES<br />
INITIATION OF COVERAGE EQUITY RESEARCH<br />
Table 8: Geographic Presence of Manufacturing Affiliates<br />
KSA Bahrain Europe USA Asia<br />
# of Manufacturing Affiliates 17 3 1 1 1<br />
Source: Company Reports<br />
The bulk of production takes place in the Kingdom. The output of Sabic Europe approximates 8<br />
million tpa or 11% of total output (for 2011), comprised of almost 5 million tons of basic chemicals<br />
(10% of consolidated basic chemicals output) and 3 million tons of polymers 39 (27% of consolidated<br />
polymers output). US operations account for around 1 million tons of output or c2% of output,<br />
whereas Asian operations account to approx. 5 million tons or c7% of total output 40 .<br />
1 Sabic ‘s hydrocarbon feedstock mix includes ethane, methane, propane, butane and naphtha.<br />
From these feedstocks, Sabic produces its basic chemicals such as olefins and aromatics<br />
which in turn are used to produce polyolefins and other polymers.<br />
1 Sabic’s top-line and bottom-line figures are foremost derived from the sale of chemicals,<br />
polymers and innovative plastics. Below is a comprehensive breakdown, prior to the<br />
consolidation adjustments and eliminations (based on 2011 report).<br />
Table 9: Breakdown of Operations (for FY 2011)<br />
(SAR million) Chemicals* Fertilizers Metals Corporate** Total***<br />
Sales 218,725 8,654 15,532 17,877 260,788<br />
Gross profit 47,038 5,706 2,829 5,104 60,677<br />
Net profit 32,618 5,952 2,036 30,854 71,460<br />
*Chemicals Segment account for basic chemicals, performance chemicals, polymers and innovative plastics.<br />
**Corporate Segment “includes the corporate operations, technology and innovation centers, the investment activities<br />
and Sabic Industrial Investments Co. “ (Sabic)<br />
***Prior to Consolidation Adjustments and Eliminations<br />
Source: Company Reports<br />
39 Sabic Europe produces mainly HDPE, LDPE, LLDPE and Polypropylene<br />
40 Source: Sabic, ASIB Estimates<br />
24
SABIC<br />
December 4, 2012<br />
INITIATION OF COVERAGE EQUITY RESEARCH<br />
APPENDIX A: PRO-FORMA INCOME STATEMENT<br />
(SAR mn) 2011 2012E 2013E 2014E 2015E<br />
Sales revenues 189,898 184,917 186,565 190,791 195,906<br />
Cost of sales (127,768) (132,350) (126,411) (128,721) (129,342)<br />
Gross profit 62,130 52,567 60,154 62,069 66,565<br />
S,G&A expenses (13,292) (12,954) (13,069) (16,217) (16,652)<br />
Operating income 48,838 39,613 47,085 45,852 49,913<br />
Other income 2,039 2,221 1,629 1,711 1,652<br />
Finance charges (2,993) (2,282) (1,841) (1,504) (1,098)<br />
Income before minority interests and zakat 47,885 39,552 46,873 46,060 50,467<br />
Minority interests (16,043) (12,673) (15,019) (14,759) (16,171)<br />
Income before zakat 31,842 26,878 31,853 31,301 34,296<br />
Zakat (2,600) (1,945) (2,119) (2,121) (2,063)<br />
Net Income 29,242 24,933 29,734 29,180 32,233<br />
APPENDIX B: PRO-FORMA BALANCE SHEET<br />
(SAR mn) 2011 2012E 2013E 2014E 2015E<br />
Cash and cash equivalents 50,389 51,011 53,221 55,907 53,972<br />
Accounts receivables 31,426 29,303 29,564 30,234 31,044<br />
Inventories 31,464 32,718 31,250 31,821 31,974<br />
Other receivables and prepayments 19,122 14,907 14,238 14,498 14,568<br />
Total current assets 132,401 127,939 128,273 132,459 131,559<br />
Investments 9,701 9,013 9,060 9,825 10,444<br />
Property, plant and equipment 165,805 164,590 163,363 162,109 160,822<br />
Intangible assets 21,891 21,529 20,396 19,262 18,129<br />
Other non-current assets 2,986 3,658 3,879 4,113 4,361<br />
Total non-current assets 200,382 198,789 196,697 195,310 193,756<br />
Total Assets 332,784 326,728 324,970 327,769 325,315<br />
Accounts payable 16,388 17,391 16,610 16,914 16,996<br />
Short-term bank facilities 1,333 1,299 1,311 1,627 1,670<br />
Current portion of long-term debt 13,264 14,735 11,600 13,597 13,029<br />
Accrued liabilities and other payables 8,944 13,906 10,176 10,362 10,412<br />
Zakat payable 3,140 2,810 3,797 5,129 6,928<br />
Total current liabilities 43,070 50,142 43,494 47,629 49,035<br />
Long-term debt 87,907 60,187 48,586 34,989 21,960<br />
Employees' service benefits payable 8,555 9,071 9,618 10,199 10,814<br />
Other non-current liabilities 4,046 3,793 3,514 3,257 3,018<br />
Total non-current liabilities 100,508 73,050 61,719 48,445 35,793<br />
Share capital 30,000 30,000 30,000 30,000 30,000<br />
Statutory reserve 15,000 15,000 15,000 15,000 15,000<br />
General reserve 69,781 80,242 92,136 100,890 107,337<br />
Retained earnings 23,242 24,000 24,000 24,000 24,000<br />
Total shareholders' equity 138,022 149,242 161,136 169,890 176,337<br />
Minority interests 51,183 54,294 58,620 61,805 64,150<br />
Total Liabilities and Equity 332,784 326,728 324,970 327,769 325,315<br />
25
SABIC<br />
December 4, 2012<br />
APPENDIX C: SABIC’S PORTFOLIO<br />
INITIATION OF COVERAGE EQUITY RESEARCH<br />
Chemicals Plastics Fertilizers Steel<br />
Olefins PVC Urea Long Steel<br />
Ethylene Polyester Ammonia Rebars<br />
Propylene Polystyrene DAP Wire Rod<br />
Butadiene Polyolefins MAP Rebar in Coil<br />
Butane-1 HDPE Billets<br />
Oxygenates LDPE Flat Products<br />
Methanol LLDPE Hot Rolled Coil<br />
MTBE PP Cold Rolled Coil<br />
Aromatics Advanced thermoplastic<br />
sheet and film materials<br />
Hot Dip Galvanized Coil<br />
Styrene Monomer Polycarbonates Pre-Painted Coil<br />
Benzene ABS<br />
Pyrolysis Gasoline Resins<br />
PTA Lexan<br />
Chemical Intermediates Noryl<br />
Caustic Acid Ultem<br />
Ethylene Di-chloride Valox<br />
Vinyl Chloride Monomer Xenoy<br />
Glycols Xylex<br />
Mono-ethylene Glycol<br />
Di-ethylene Glycol<br />
Tri-ethylene Glycol<br />
Industrial Gases<br />
Gaseous Nitrogen<br />
Liquid Nitrogen<br />
Liquid Argon<br />
Crude Krypton/Xenon<br />
Gaseous Hydrogen<br />
Linear Alpha Olefins<br />
Performance Chemicals<br />
Ethoxylates<br />
Ethanolamines<br />
Source: Sabic<br />
26
SABIC<br />
December 4, 2012<br />
FOOTNOTES<br />
INITIATION OF COVERAGE EQUITY RESEARCH<br />
APPENDIX D: SABIC’S CONSOLIDATED SUBSIDIARIES 41<br />
Company Name* Direct and Indirect Shareholding<br />
Sabic Industrial Investments Company (SIIC) and its subsidiaries 100%<br />
Sabic Luxembourg (SLUX) and its subsidiaries 100%<br />
Sabic Asia Pacific Pte. (SAPPL) and its subsidiaries 100%<br />
Arabian Petrochemical Company and its subsidiary (Petrokemya) 100%<br />
Saudi Iron and Steel Company (Hadeed) 100%<br />
Sabic Sukuk Company (SUKUK) 100%<br />
Sabic Industrial Catalyst Co. (Sabcat) 100%<br />
Saudi European Petrochemical Company (Ibn Zahr) 80%<br />
Jubail United Petrochemical Company (United) 75%<br />
National Chemical Fertilizer Company (Ibn Al-Baytar) 72%<br />
National Industrial Gases Company (Gas) 70%<br />
Yanbu National Petrochemical Company (Yansab) 52%<br />
Saudi Methanol Company (Ar-Razi) 50%<br />
Al-Jubail Fertilizer Company (Al-Bayroni) 50%<br />
Saudi Yanbu Petrochemical Company (Yanpet) 50%<br />
National Methanol Company (Ibn Sina) 50%<br />
Saudi Petrochemical Company (Sadaf) 50%<br />
Eastern Petrochemical Company (Sharq) 50%<br />
Al-Jubail Petrochemical Company (Kemya) 50%<br />
Arabian Industrial Fiber Company (Ibn Rushd) 47%<br />
Saudi Arabian Fertilizer Company (Safco) 43%<br />
Saudi Kayan Petrochemical Company (Saudi Kayan) 35%<br />
Source: Sabic Report 2011<br />
*17 companies out of these consolidated subsidiaries are manufacturing subsidiaries<br />
APPENDIX E: SABIC’S INVESTMENTS<br />
Associated Companies Shareholding<br />
Gulf Petrochemical Industries Co. (GPIC) 33%<br />
Gulf Aluminum Rolling Mills Co. (Garmco) 31%<br />
Maaden Phosphate Company 30%<br />
Power and Water Utilities Company 25%<br />
Aluminum Bahrain BSC (Alba) 21%<br />
National Chemical Carrier Company 20%<br />
Source: Sabic Report 2011<br />
41 Tianjin Petrochemical Company, owned by Sabic, SIIC and Sinopec, is proportionately consolidated in Sabic›s<br />
consolidated financial statements.<br />
27
SABIC<br />
December 4, 2012<br />
INITIATION OF COVERAGE EQUITY RESEARCH<br />
APPENDIX F: SABIC’S MANUFACTURING AFFILIATES<br />
Location Est.<br />
Date<br />
Onstream<br />
Date<br />
SBU Products<br />
Ar-Razi KSA 1979 1983 Chemicals Methanol<br />
Sadaf KSA 1980 1985 Chemicals Ethylene,Styrene,Caustic<br />
Soda,Ethylene Di-chloride, MTBE<br />
Ibn-Sina KSA 1981 1985 Chemicals Methanol, MTBE<br />
Yanpet KSA 1980 1985 Polymers Ethylene, Propylene,MEG,<br />
Polyethylene, Polypropylene<br />
Petrokemya KSA 1981 1985 Chemicals Ethylene,Polystyrene,Butene-1,<br />
Propylene,Butadiene,Benzene,<br />
Polyethylene, PVC,ABS<br />
Kemya KSA 1979 1985 Polymers Ethylene, Polyethylene<br />
Sharq KSA 1981 1985 Chemicals Ethylene,Propylene,MEG,DEG,<br />
TEG,LLDPE,HDPE<br />
Ibn Zahr KSA 1984 1988 Polymers MTBE,Polypropylene<br />
Ibn Rushd KSA 1993 1995 Polymers Aromatics, PTA,PET,Acetic Acid<br />
Al-Bayroni KSA 1979 1983 Fertilizers Ammonia,Urea,DOP<br />
Safco KSA 1965 1969 Fertilizers Ammonia,Urea<br />
Ibn Al-Baytar KSA 1985 1987 Fertilizers Ammonia,Urea,Phosphate<br />
Hadeed KSA 1979 1983 Metals Steel Rebars,HRC,CRC,Wire<br />
Rod,Flat Steel products<br />
Gas KSA 1983 1984 Chemicals Hydrogen,Oxygen,Nitrogen<br />
United KSA 2001 2004 Chemicals Ethylene,Polyethylene,MEG,LAO<br />
Yansab KSA 2004 2008 Polymers Ethylene,Propylene,LLDPE,<br />
HDPE, MEG, MTBE,<br />
Polypropylene, Butene-1,Butane-<br />
2,TolueneXylene<br />
Kayan KSA 2007 2011 Performance<br />
Chemicals<br />
Ethylene,Propylene, LDPE,HDPE,<br />
Polypropylene,MEG,Acetone,PC<br />
and other specialty products<br />
Garmco Bahrain 1981 1985 Metals Aluminum Sheet, Can Stocks<br />
GPIC Bahrain 1979 1985 Chemicals Ammonia,Methanol,Urea<br />
Alba Bahrain 1968 1971 Metals Liquid Metal,Ingots,Billets<br />
Sabic Europe Netherlands<br />
Sabic<br />
Innovative<br />
Plastics<br />
Tianjin<br />
Petrochemical<br />
Co.<br />
Source: Sabic<br />
UK<br />
Germany<br />
US<br />
Netherlands<br />
Spain<br />
NA NA Polymers Ethylene,Propylene,Aromatics<br />
Polyethylene,Polypropylene<br />
NA NA Innovative<br />
Plastics<br />
Thermoplastic resins,<br />
Coatings,Specialty Compounds,<br />
Film,Sheet<br />
China 2008 2010 Polymers Ethylene, MEG, Polypropylene,<br />
Polyethylene,Butatiene,Phenol,<br />
Butene-1<br />
28
SABIC<br />
December 4, 2012<br />
INITIATION OF COVERAGE EQUITY RESEARCH<br />
APPENDIX G: SAUDI ARABIA’S PETROCHEMICAL LANDSCAPE<br />
Source: Middle East Economic Digest (MEED)<br />
29
SABIC<br />
December 4, 2012<br />
INITIATION OF COVERAGE EQUITY RESEARCH<br />
APPENDIX H: STEEL PROJECTS IN THE MIDDLE EAST<br />
Project Country Est. Cost<br />
($m)<br />
Status Award Completion<br />
Sefid Dasht steel plant Iran 300 Design Q4 2012 2014<br />
Rolling mill plant expansion Iran 500 EPC bid Q1 2012 2014<br />
Direct reduction iron (DRI) plant Iran 350 EPC bid Q1 2012 2014<br />
Torbat Heydariyeh DRI Plant Iran 2,330 EPC bid Q1 2012 2014<br />
Yazd blast furnace steel plant Iran 500 EPC bid Q1 2012 2014<br />
Gol-e-Gohar DRI plant Iran 500 EPC bid Q3 2012 2014<br />
Ahwaz steel plant expansion Iran 200 EPC bid Q1 2012 2014<br />
Khorasan Razavi steel plant Iran 1,000 EPC bid Q1 2012 2014<br />
Steel plant Iran 325 Study Q4 2012 2014<br />
Meltshop expansion Iran 615 Study Q4 2012 2014<br />
Qaenat steel plant Iran 300 Study Q4 2012 2014<br />
Erbil steel plant Iraq 100 Feed Q4 2012 2014<br />
Sulaimaniyeh steel mill Iraq 130 Study Q4 2012 2015<br />
Basra steel plant rehabilitation Iraq 1,000 Study Q4 2012 2014<br />
Doukkala steel plant Morocco 172 Study Q3 2012 2015<br />
Sohar Ferrochrome smelter Oman 85 Study Q4 2012 2014<br />
Gas-fired steel plant Oman 3,000 Study Q1 2013 2015<br />
Sohar steel complex expansion phase III Oman 600 Study Q4 2012 2015<br />
Meltshop upgrade Qatar 1,000 EPC bid Q1 2012 2013<br />
King Abdullah Economic City steel plant KSA 3,000 EPC PQ Q3 2012 2015<br />
DRI plant KSA 500 Study Q4 2012 2014<br />
Pipe mill KSA 70 Study Q4 2012 2014<br />
Pipe mill KSA 50 Study Q4 2012 2014<br />
Dammam steel billet plant KSA 700 Study Q4 2013 2014<br />
Jubail Industrial City billet caster and<br />
rolling mill<br />
KSA 240 Study Q3 2012 2014<br />
Steel plant expansion Tunisia 200 Study Q4 2012 2016<br />
Emirates Steel plant phase III UAE 1,000 EPC bid Q1 2012 2014<br />
Al-Ghurair Iron & Steel plant phase II UAE 40 Study Q3 2012 2014<br />
Steel plant expansion Yemen 1,600 Study Q3 2013 2015<br />
Integrated steel plant Yemen 250 Study Q3 2012 2015<br />
Source: Middle East Economic Digest (MEED)<br />
30
SABIC<br />
FAIR VALUE DEFINITION<br />
December 4, 2012<br />
RATING GUIDE<br />
ISSUER<br />
INITIATION OF COVERAGE EQUITY RESEARCH<br />
It is an unbiased estimate of the 12-month potential market price of the stock<br />
SELL REDUCE HOLD ACCUMULATE BUY<br />
Downside -30% -10% +10% +30% Upside<br />
BUY: Upside potential in share price is more than 30%<br />
ACCUMULATE: Upside potential in share price is between 10 and 30%<br />
HOLD: Upside or downside potential in share price less than 10%<br />
REDUCE: Downside potential in share price is between 10 and 30%<br />
SELL: Downside potential in share price is more than 30%<br />
<strong>Audi</strong> Saradar Investment <strong>Bank</strong><br />
<strong>Audi</strong> Saradar Investment <strong>Bank</strong> SAL • Lebanese joint stock company with a registered capital of<br />
10,000,000,000 Lebanese Pounds • Commercial Registrar in Beirut: 30812 • Holding number 33 on<br />
the Central <strong>Bank</strong>’s <strong>Bank</strong>s List.<br />
Address: <strong>Bank</strong> <strong>Audi</strong> Plaza • Bab Idriss • Beirut 2021 8102 Lebanon • P.O. Box 11-2560 • Beirut 1107<br />
2808 • Lebanon. Phone: +961 1 964072 • Fax: +961 1 970403 • Email: contactus@asib.com<br />
31
SABIC<br />
December 4, 2012<br />
DISCLAIMER<br />
INITIATION OF COVERAGE EQUITY RESEARCH<br />
“All rights reserved. This research document (the “Document”) is prepared by <strong>Audi</strong> Saradar Investment <strong>Bank</strong> SAL (“ASIB”),<br />
being an entity of <strong>Audi</strong> Saradar Group, for the use of the clients of ASIB and/or the clients of any entity within the <strong>Audi</strong><br />
Saradar Group.<br />
This Document is disclosed to you on a confidential basis. Receipt and/or review of this Document constitute your agreement<br />
not to copy, modify, redistribute, retransmit, or disclose to others the contents, opinions, conclusion, or information<br />
contained in this Document prior to public disclosure of the same by ASIB or the <strong>Audi</strong> Saradar Group or without the express<br />
prior written consent of ASIB.<br />
This Document is not intended for dissemination, distribution to, or use by, any person or entity in any country or jurisdiction<br />
which would subject ASIB or any entity within the <strong>Audi</strong> Saradar Group, to any registration or licensing requirements within<br />
these jurisdictions or where it might be considered as unlawful. Accordingly, this Document is for distribution solely in<br />
jurisdictions where permitted and to persons who may receive it without breaching any applicable legal or regulatory<br />
requirements. In any case, this Document shall not be distributed in the Republic of Egypt.<br />
Your attention is drawn to the fact that you should not access this Document if the regulations of your country of citizenship<br />
and/or residency or any applicable regulations prohibit it. In any case, persons who are subject to any restrictions in any<br />
country, such as US persons are not permitted to access information contained herein.<br />
Neither the information, nor any opinion expressed herein constitutes an offer or an invitation or a recommendation to<br />
make an offer, to buy or sell any security or other investment product related to such security or investment. This Document<br />
provides general information only, is not intended to provide personal investment advice or recommendation and does not<br />
take into account the specific investment objectives, financial situation and the particular needs of any specific person who<br />
may receive it. You should seek financial, legal or tax advice regarding the appropriateness and suitability in investing in any<br />
security, other investment or investment strategy discussed or forecasted in this Document.<br />
You should carefully read the definitions of the Rating Guide provided in this Document. In addition you should read this<br />
Document in its entirety and not conclude its contents from the ratings solely.<br />
The information herein was obtained from various public sources believed in good faith to be reliable. Neither ASIB nor any<br />
entity within the <strong>Audi</strong> Saradar Group represents that the information contained in this Document is complete, accurate<br />
or free from any error and makes no representations or warranties whatsoever as to the data, information and opinions<br />
provided herein.<br />
This Document and any information, opinion and prospect contained herein reflect a judgment at its original date<br />
of publication by ASIB and are subject to change without notice. ASIB and/or any entity within the <strong>Audi</strong> Saradar Group<br />
may have issued, and may in the future issue, other research documents that are inconsistent with, and reach different<br />
conclusions from, the information, opinions and prospects presented in this Document.<br />
This Document reflects the different assumptions, views and analytical methods of the analysts who prepared them; ASIB,<br />
and the <strong>Audi</strong> Saradar Group are under no obligation to ensure that such other research documents are brought to the<br />
attention of any recipient of this Document.<br />
ASIB, any entity within the <strong>Audi</strong> Saradar Group, one or more of their affiliates and/or their officers (including but not limited<br />
to their strategists, analysts and sales staff) may have a financial interest in securities of the issuer(s) or related investments,<br />
may engage in securities transactions, on a proprietary basis or otherwise, in a manner inconsistent with the view taken in<br />
this Document and may take a view that is inconsistent with that taken herein.<br />
The price, value of and income from any of the securities or financial instruments mentioned in this Document can fall as well<br />
as rise. The value of securities and financial instruments is subject to market conditions, volatility, exchange rate fluctuation<br />
and credit quality of any issuer that may have a positive or adverse effect on the price or income of such securities or<br />
financial instruments. Any forecasts on the economy, stock market, bond market or the economic trends of the markets are<br />
not necessarily a guide to future returns. You should understand that statements regarding future prospects may not be<br />
realized. Past performance should not be taken as an indication or guarantee of future performance, and no representation<br />
or warranty, express or implied, is made regarding future returns. As a result of the preceding, you may lose, as the case may<br />
be, the amount originally invested.<br />
None of ASIB, any entity within the <strong>Audi</strong> Saradar Group, any of their affiliates and/or their officers (including but not limited<br />
to their strategists, analysts and sales staff) shall be held liable for any loss or damage that may arise, directly or indirectly,<br />
from any use of the information contained in this Document nor for any decision or investment made on the basis of<br />
information contained herein.”<br />
32