AlMarai-CompanyUpdate(Nov12) - Bank Audi
AlMarai-CompanyUpdate(Nov12) - Bank Audi
AlMarai-CompanyUpdate(Nov12) - Bank Audi

You also want an ePaper? Increase the reach of your titles
YUMPU automatically turns print PDFs into web optimized ePapers that Google loves.
ENTITY OF AUDI SARADAR GROUP<br />
CURRENT PRICE SAR 69.25<br />
FAIR VALUE SAR 66.30<br />
RATING HOLD<br />
Stock Data<br />
November 02, 2012<br />
HIGHLIGHTS<br />
Ticker Almarai AB<br />
Bloomberg Median TP (SAR) 67.07<br />
Market Cap (SAR mn) 27,700<br />
Market Cap (USD mn) 7,387<br />
Number of Shares (mn) 400.0<br />
Av. Monthly Liquidity (SAR mn) 786<br />
52 Week High (SAR) 72.00<br />
52 Week Low (SAR) 49.45<br />
YTD Return 23%<br />
Ownership Structure<br />
Stock Performance<br />
Bloomberg Consensus<br />
SECTOR COVERAGE<br />
Alaa Ghanem, CFA, CVA<br />
Senior Equity Analyst<br />
Alaa.Ghanem@asib.com<br />
Youssef Nizam, CFA<br />
Head of Equity Research<br />
Youssef.Nizam@asib.com<br />
EQUITY RESEARCH<br />
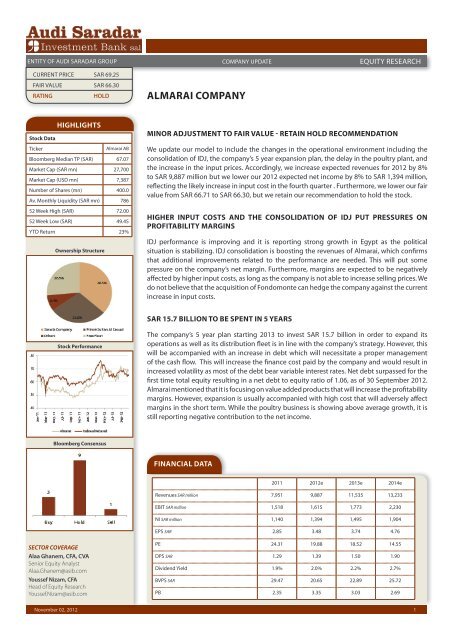
MINOR ADJUSTMENT TO FAIR VALUE - RETAIN HOLD RECOMMENDATION<br />
We update our model to include the changes in the operational environment including the<br />
consolidation of IDJ, the company’s 5 year expansion plan, the delay in the poultry plant, and<br />
the increase in the input prices. Accordingly, we increase expected revenues for 2012 by 8%<br />
to SAR 9,887 million but we lower our 2012 expected net income by 8% to SAR 1,394 million,<br />
reflecting the likely increase in input cost in the fourth quarter . Furthermore, we lower our fair<br />
value from SAR 66.71 to SAR 66.30, but we retain our recommendation to hold the stock.<br />
HIGHER INPUT COSTS AND THE CONSOLIDATION OF IDJ PUT PRESSURES ON<br />
PROFITABILITY MARGINS<br />
IDJ performance is improving and it is reporting strong growth in Egypt as the political<br />
situation is stabilizing. IDJ consolidation is boosting the revenues of Almarai, which confirms<br />
that additional improvements related to the performance are needed. This will put some<br />
pressure on the company’s net margin. Furthermore, margins are expected to be negatively<br />
affected by higher input costs, as long as the company is not able to increase selling prices. We<br />
do not believe that the acquisition of Fondomonte can hedge the company against the current<br />
increase in input costs.<br />
SAR 15.7 BILLION TO BE SPENT IN 5 YEARS<br />
The company’s 5 year plan starting 2013 to invest SAR 15.7 billion in order to expand its<br />
operations as well as its distribution fleet is in line with the company’s strategy. However, this<br />
will be accompanied with an increase in debt which will necessitate a proper management<br />
of the cash flow. This will increase the finance cost paid by the company and would result in<br />
increased volatility as most of the debt bear variable interest rates. Net debt surpassed for the<br />
first time total equity resulting in a net debt to equity ratio of 1.06, as of 30 September 2012.<br />
Almarai mentioned that it is focusing on value added products that will increase the profitability<br />
margins. However, expansion is usually accompanied with high cost that will adversely affect<br />
margins in the short term. While the poultry business is showing above average growth, it is<br />
still reporting negative contribution to the net income.<br />
FINANCIAL DATA<br />
COMPANY UPDATE<br />
ALMARAI COMPANY<br />
2011 2012e 2013e 2014e<br />
Revenues SAR million 7,951 9,887 11,535 13,233<br />
EBIT SAR million 1,518 1,615 1,773 2,230<br />
NI SAR million 1,140 1,394 1,495 1,904<br />
EPS SAR 2.85 3.48 3.74 4.76<br />
PE 24.31 19.88 18.52 14.55<br />
DPS SAR 1.29 1.39 1.50 1.90<br />
Dividend Yield 1.9% 2.0% 2.2% 2.7%<br />
BVPS SAR 29.47 20.65 22.89 25.72<br />
PB 2.35 3.35 3.03 2.69<br />
1
ALMARAI COMPANY UPDATE<br />
EQUITY RESEARCH<br />
November 02, 2012<br />
VALUATION<br />
We value the company using the DDM and FCFE methods. An equal weight is assigned for each<br />
method. We lower the cost of equity used by 101 bps to 10.67% and terminal growth rate by 85 bps<br />
to 4.15% to account to the expected drop in sustainable ROE. Accordingly, we slightly lower our fair<br />
value to SAR 66.30 from SAR 66.71 and we retain our recommendation to hold the stock.<br />
Table 3: DDM<br />
SAR unless otherwise stated 2012e 2013e 2014e 2015e<br />
EPS 3.48 3.74 4.76 6.11<br />
DPS 1.40 1.60 2.00 5.10<br />
PV of DPS 1.39 1.43 1.62 3.73<br />
PV of TV 59.67<br />
Cost of Equity 10.67%<br />
Shares Outstanding million 400<br />
Terminal Growth Rate 4.15%<br />
Fair Value 67.84<br />
Table 4: FCFE Valuation<br />
SAR million unless otherwise stated 2012e 2013e 2014e 2015e<br />
NI 1,394 1,495 1,904 2,442<br />
NCC 675 756 858 953<br />
Capex 2,800 3,100 3,100 3,040<br />
Change in WC 735 165 211 43<br />
Change in Debt 2,015 1,560 1,250 1,650<br />
FCFE 548 546 701 1,962<br />
PV of FCFE 544 489 568 1,435<br />
PV of TV 22,911<br />
Cost of Equity 10.67%<br />
Shares Outstanding million 400<br />
Fair Value SAR 64.87<br />
2
ALMARAI<br />
November 02, 2012<br />
CHANGES TO OUR FORECASTS<br />
COMPANY UPDATE EQUITY RESEARCH<br />
SAR million unless otherwise stated Changes to Our Forecasts<br />
2011 2012e 2013e 2014e 2015e 2012e 2013e 2014e 2015e<br />
Sales 7,951 9,887 11,535 13,233 14,524 8% 7% 6% 8%<br />
Sales Growth 14.7% 24.4% 16.7% 14.7% 9.8%<br />
COGS (4,954) (6,367) (7,565) (8,482) (8,990) 12% 14% 11% 10%<br />
Gross Profit 2,997 3,521 3,970 4,751 5,534 1% -4% -2% 5%<br />
Gross Margin 37.7% 35.6% 34.4% 35.9% 38.1%<br />
Selling & Distribution<br />
Expenses<br />
(1,213) (1,582) (1,811) (2,078) (2,222) 13% 10% 9% 9%<br />
G&A Expenses (266) (323) (386) (443) (479) 4% 7% 6% 8%<br />
Share of Loss from<br />
Associates<br />
(42) (26) 0 20 50 -15% 0% 0% 0%<br />
EBIT 1,518 1,615 1,773 2,230 2,833 -8% -16% -11% 2%<br />
EBIT Margin 19.1% 16.3% 15.4% 16.9% 19.5%<br />
<strong>Bank</strong> Charges (135) (157) (231) (287) (367) -4% 14% 19% 25%<br />
Zakat (33) (43) (39) (49) (63) 10% -20% -15% -1%<br />
Impairment of<br />
Investments<br />
Income before<br />
Minority Interest<br />
(160) 0 0 0 0 0% 0% 0% 0%<br />
1,147 1,390 1,503 1,914 2,452 -9% -20% -15% -1%<br />
Minority Interest (7) 4 (8) (10) (10) -158% 0% 0% 0%<br />
Net Income 1,140 1,394 1,495 1,904 2,442 -8% -20% -15% -1%<br />
NI Growth -11.4% 22.3% 7.3% 27.4% 28.3%<br />
Net Margin 14.3% 14.1% 13.0% 14.4% 16.8%<br />
3
ALMARAI<br />
November 02, 2012<br />
COMPANY UPDATE EQUITY RESEARCH<br />
SAR million Changes to Our Forecasts<br />
2011 2012e 2013e 2014e 2015e 2012e 2013e 2014e 2015e<br />
Cash & Equivalents 272 202 228 276 279 -27% -24% -16% -25%<br />
Inventories 1,697 2,165 2,496 2,799 2,922 12% 14% 11% 8%<br />
Others 624 1,080 1,174 1,323 1,409 75% 89% 110% 135%<br />
Total Current Assets 2,593 3,446 3,898 4,398 4,609 22% 25% 26% 26%<br />
PPE net 10,508 13,373 15,637 17,779 19,747 7% 10% 14% 19%<br />
Biological Assets 818 900 980 1,080 1,200 -8% -11% -11% -7%<br />
Goodwill 821 1,383 1,383 1,383 1,383 65% 61% 59% 59%<br />
Others 917 345 324 277 286 -63% -66% -70% -67%<br />
Total Non Current<br />
Assets<br />
13,064 16,001 18,324 20,519 22,616 5% 7% 11% 15%<br />
Total Assets 15,656 19,447 22,222 24,918 27,225 7% 10% 13% 17%<br />
Short Term Loans 1,209 1,609 1,785 1,880 2,144 28% 36% 34% 40%<br />
Payables & Accruals 1,516 1,700 1,967 2,205 2,364 12% 28% 52% 58%<br />
Others 96 101 94 97 103 0% 0% 0% 0%<br />
Total Current<br />
Liabilities<br />
2,821 3,410 3,846 4,182 4,611 19% 31% 42% 47%<br />
Long Term Loans 5,717 7,331 8,715 9,870 11,256 3% 8% 15% 20%<br />
Employees' Termination<br />
Benefits<br />
Total Non Current<br />
Liabilities<br />
243 300 360 430 500 9% 23% 43% 62%<br />
6,058 7,777 9,221 10,446 11,902 4% 10% 16% 22%<br />
Total Liabilities 8,879 11,187 13,067 14,628 16,513 8% 15% 23% 28%<br />
Total Equity 6,778 8,260 9,155 10,290 10,712 6% 4% 2% 3%<br />
2011 2012e 2013e 2014e 2015e<br />
ROAA 8.1% 7.9% 7.2% 8.1% 9.4%<br />
ROAE 17.7% 19.5% 18.7% 21.3% 25.2%<br />
Net Debt to Equity 1.0 1.1 1.1 1.1 1.2<br />
Interest Coverage Ratio 2.9 3.0 1.4 1.0 1.1<br />
4
ALMARAI<br />
FAIR VALUE DEFINITION<br />
November 02, 2012<br />
RATING GUIDE<br />
ISSUER<br />
COMPANY UPDATE EQUITY RESEARCH<br />
It is an unbiased estimate of the 12-month potential market price of the stock<br />
SELL REDUCE HOLD ACCUMULATE BUY<br />
Downside -30% -10% +10% +30% Upside<br />
BUY: Upside potential in share price is more than 30%<br />
ACCUMULATE: Upside potential in share price is between 10 and 30%<br />
HOLD: Upside or downside potential in share price less than 10%<br />
REDUCE: Downside potential in share price is between 10 and 30%<br />
SELL: Downside potential in share price is more than 30%<br />
<strong>Audi</strong> Saradar Investment <strong>Bank</strong><br />
<strong>Audi</strong> Saradar Investment <strong>Bank</strong> SAL • Lebanese joint stock company with a registered capital of<br />
10,000,000,000 Lebanese Pounds • Commercial Registrar in Beirut: 30812 • Holding number 33 on<br />
the Central <strong>Bank</strong>’s <strong>Bank</strong>s List.<br />
<strong>Bank</strong> <strong>Audi</strong> Plaza • Bab Idriss • Beirut 2021 8102 Lebanon • P.O. Box 11-2560 • Beirut 1107 2808 •<br />
Lebanon. Phone: +961 1 964072 • Fax: +961 1 970403 • Email: contactus@asib.com<br />
5
ALMARAI<br />
November 02, 2012<br />
DISCLAIMER<br />
COMPANY UPDATE EQUITY RESEARCH<br />
“All rights reserved. This research document (the “Document”) is prepared by <strong>Audi</strong> Saradar Investment <strong>Bank</strong> SAL (“ASIB”),<br />
being an entity of <strong>Audi</strong> Saradar Group, for the use of the clients of ASIB and/or the clients of any entity within the <strong>Audi</strong><br />
Saradar Group.<br />
This Document is disclosed to you on a confidential basis. Receipt and/or review of this Document constitute your agreement<br />
not to copy, modify, redistribute, retransmit, or disclose to others the contents, opinions, conclusion, or information<br />
contained in this Document prior to public disclosure of the same by ASIB or the <strong>Audi</strong> Saradar Group or without the express<br />
prior written consent of ASIB.<br />
This Document is not intended for dissemination, distribution to, or use by, any person or entity in any country or jurisdiction<br />
which would subject ASIB or any entity within the <strong>Audi</strong> Saradar Group, to any registration or licensing requirements within<br />
these jurisdictions or where it might be considered as unlawful. Accordingly, this Document is for distribution solely in<br />
jurisdictions where permitted and to persons who may receive it without breaching any applicable legal or regulatory<br />
requirements. In any case, this Document shall not be distributed in the Republic of Egypt.<br />
Your attention is drawn to the fact that you should not access this Document if the regulations of your country of citizenship<br />
and/or residency or any applicable regulations prohibit it. In any case, persons who are subject to any restrictions in any<br />
country, such as US persons are not permitted to access information contained herein.<br />
Neither the information, nor any opinion expressed herein constitutes an offer or an invitation or a recommendation to<br />
make an offer, to buy or sell any security or other investment product related to such security or investment. This Document<br />
provides general information only, is not intended to provide personal investment advice or recommendation and does not<br />
take into account the specific investment objectives, financial situation and the particular needs of any specific person who<br />
may receive it. You should seek financial, legal or tax advice regarding the appropriateness and suitability in investing in any<br />
security, other investment or investment strategy discussed or forecasted in this Document.<br />
You should carefully read the definitions of the Rating Guide provided in this Document. In addition you should read this<br />
Document in its entirety and not conclude its contents from the ratings solely.<br />
The information herein was obtained from various public sources believed in good faith to be reliable. Neither ASIB nor any<br />
entity within the <strong>Audi</strong> Saradar Group represents that the information contained in this Document is complete, accurate<br />
or free from any error and makes no representations or warranties whatsoever as to the data, information and opinions<br />
provided herein.<br />
This Document and any information, opinion and prospect contained herein reflect a judgment at its original date<br />
of publication by ASIB and are subject to change without notice. ASIB and/or any entity within the <strong>Audi</strong> Saradar Group<br />
may have issued, and may in the future issue, other research documents that are inconsistent with, and reach different<br />
conclusions from, the information, opinions and prospects presented in this Document.<br />
This Document reflects the different assumptions, views and analytical methods of the analysts who prepared them; ASIB,<br />
and the <strong>Audi</strong> Saradar Group are under no obligation to ensure that such other research documents are brought to the<br />
attention of any recipient of this Document.<br />
ASIB, any entity within the <strong>Audi</strong> Saradar Group, one or more of their affiliates and/or their officers (including but not limited<br />
to their strategists, analysts and sales staff) may have a financial interest in securities of the issuer(s) or related investments,<br />
may engage in securities transactions, on a proprietary basis or otherwise, in a manner inconsistent with the view taken in<br />
this Document and may take a view that is inconsistent with that taken herein.<br />
The price, value of and income from any of the securities or financial instruments mentioned in this Document can fall as well<br />
as rise. The value of securities and financial instruments is subject to market conditions, volatility, exchange rate fluctuation<br />
and credit quality of any issuer that may have a positive or adverse effect on the price or income of such securities or<br />
financial instruments. Any forecasts on the economy, stock market, bond market or the economic trends of the markets are<br />
not necessarily a guide to future returns. You should understand that statements regarding future prospects may not be<br />
realized. Past performance should not be taken as an indication or guarantee of future performance, and no representation<br />
or warranty, express or implied, is made regarding future returns. As a result of the preceding, you may lose, as the case may<br />
be, the amount originally invested.<br />
None of ASIB, any entity within the <strong>Audi</strong> Saradar Group, any of their affiliates and/or their officers (including but not limited<br />
to their strategists, analysts and sales staff) shall be held liable for any loss or damage that may arise, directly or indirectly,<br />
from any use of the information contained in this Document nor for any decision or investment made on the basis of<br />
information contained herein.”<br />
6