swot analysis - Search Center - Bank Audi
swot analysis - Search Center - Bank Audi
swot analysis - Search Center - Bank Audi

You also want an ePaper? Increase the reach of your titles
YUMPU automatically turns print PDFs into web optimized ePapers that Google loves.
ENTITY OF AUDI SARADAR GROUP<br />
CURRENT PRICE EGP 5.00<br />
FAIR VALUE EGP 5.01<br />
RATING HOLD<br />
Stock Data<br />
Ownership Structure<br />
Stock Performance<br />
Bloomberg Consensus<br />
September 14, 2012<br />
HIGHLIGHTS<br />
Ticker JUFO EY<br />
Bloomberg Median TP (EGP) 5.71<br />
Market Cap (EGP mn) 3,531<br />
Market Cap (USD mn) 579<br />
Number of Shares (mn) 706.1<br />
Av. Monthly Liquidity (EGP mn) 54.9<br />
52 Week High (EGP) 5.05<br />
52 Week Low (EGP) 3.69<br />
COMPANY COVERAGE<br />
Alaa Ghanem, CFA, CVA<br />
Senior Equity Analyst<br />
Alaa.Ghanem@asib.com<br />
Youssef Nizam, CFA<br />
Head of Equity Research<br />
Youssef.Nizam@asib.com<br />
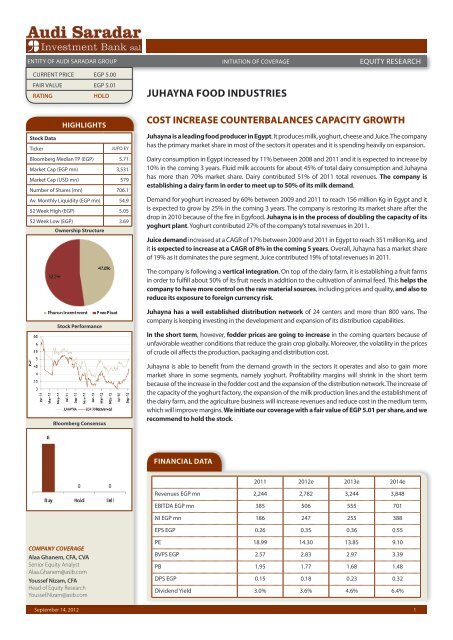
INITIATION OF COVERAGE<br />
JUHAYNA FOOD INDUSTRIES<br />
EQUITY RESEARCH<br />
COST INCREASE COUNTERBALANCES CAPACITY GROWTH<br />
Juhayna is a leading food producer in Egypt. It produces milk, yoghurt, cheese and Juice. The company<br />
has the primary market share in most of the sectors it operates and it is spending heavily on expansion.<br />
Dairy consumption in Egypt increased by 11% between 2008 and 2011 and it is expected to increase by<br />
10% in the coming 3 years. Fluid milk accounts for about 45% of total dairy consumption and Juhayna<br />
has more than 70% market share. Dairy contributed 51% of 2011 total revenues. The company is<br />
establishing a dairy farm in order to meet up to 50% of its milk demand.<br />
Demand for yoghurt increased by 60% between 2009 and 2011 to reach 156 million Kg in Egypt and it<br />
is expected to grow by 25% in the coming 3 years. The company is restoring its market share after the<br />
drop in 2010 because of the fire in Egyfood. Juhayna is in the process of doubling the capacity of its<br />
yoghurt plant. Yoghurt contributed 27% of the company’s total revenues in 2011.<br />
Juice demand increased at a CAGR of 17% between 2009 and 2011 in Egypt to reach 351 million Kg, and<br />
it is expected to increase at a CAGR of 8% in the coming 5 years. Overall, Juhayna has a market share<br />
of 19% as it dominates the pure segment. Juice contributed 19% of total revenues in 2011.<br />
The company is following a vertical integration. On top of the dairy farm, it is establishing a fruit farms<br />
in order to fulfill about 50% of its fruit needs in addition to the cultivation of animal feed. This helps the<br />
company to have more control on the raw material sources, including prices and quality, and also to<br />
reduce its exposure to foreign currency risk.<br />
Juhayna has a well established distribution network of 24 centers and more than 800 vans. The<br />
company is keeping investing in the development and expansion of its distribution capabilities.<br />
In the short term, however, fodder prices are going to increase in the coming quarters because of<br />
unfavorable weather conditions that reduce the grain crop globally. Moreover, the volatility in the prices<br />
of crude oil affects the production, packaging and distribution cost.<br />
Juhayna is able to benefit from the demand growth in the sectors it operates and also to gain more<br />
market share in some segments, namely yoghurt. Profitability margins will shrink in the short term<br />
because of the increase in the fodder cost and the expansion of the distribution network. The increase of<br />
the capacity of the yoghurt factory, the expansion of the milk production lines and the establishment of<br />
the dairy farm, and the agriculture business will increase revenues and reduce cost in the medium term,<br />
which will improve margins. We initiate our coverage with a fair value of EGP 5.01 per share, and we<br />
recommend to hold the stock.<br />
FINANCIAL DATA<br />
2011 2012e 2013e 2014e<br />
Revenues EGP mn 2,244 2,782 3,244 3,848<br />
EBITDA EGP mn 385 506 555 701<br />
NI EGP mn 186 247 255 388<br />
EPS EGP 0.26 0.35 0.36 0.55<br />
PE 18.99 14.30 13.85 9.10<br />
BVPS EGP 2.57 2.83 2.97 3.39<br />
PB 1.95 1.77 1.68 1.48<br />
DPS EGP 0.15 0.18 0.23 0.32<br />
Dividend Yield 3.0% 3.6% 4.6% 6.4%<br />
1
JUHAYNA FOOD INDUSTRIES INITIATION OF COVERAGE<br />
EQUITY RESEARCH<br />
TABLE OF CONTENTS<br />
Company Overview 2<br />
Investment Case 3<br />
Dairy 3<br />
Yoghurt 4<br />
Juice 5<br />
SWOT Analysis 8<br />
Valuation 9<br />
Pro Forma Financials 10<br />
Appendix 11<br />
September 14, 2012<br />
COMPANY OVERVIEW<br />
Established in 1983, Juhayna is a leading food producer in Egypt. The company mainly operates in<br />
producing and packaging various kinds of dairy and juice products. Production began in 1987 with<br />
a capacity of 35 tons/day and total sales of EGP 2.4 million. Currently, Juhayna with a paid up capital<br />
of EGP 706 million, employing a work force of 3,700 employees and having a daily production<br />
capacity of 2,900 tons.<br />
Chart 1: 2011 Sales by Sector<br />
Source: Company Financials<br />
Most of the sales are in the local market and exports accounts for just 5% of total revenues in H1 12.<br />
Juhayna has leading market shares in most of the segments it operates and it is in the process of<br />
increasing its capacity in the milk and yoghurt sectors.<br />
The company is establishing dairy and fruit farms in addition to the cultivation of animal feed in a<br />
step to have more control on the raw material sources, including prices and quality.<br />
Juhayna has also a well established distribution channel with more than 800 vehicles and 24<br />
distribution centers and it is in the process of opening additional distribution centers.<br />
Table 1: Group Legal Structure<br />
Juhayna Food Industries SAE<br />
(Milk & cream)<br />
Subsidiaries Ownership Products<br />
Dawleya Company 99.9% Juice<br />
Egyptian Food Industries<br />
(Egyfood)<br />
99.9% Yoghurt<br />
Masreya Dairy 99.9% Milk & Cheese<br />
El Marwa Food Industries Co. 99.9% Fruit Juice & Concentrates<br />
Modern Concentrate Co. 99.9% Fruit Juice & Concentrates<br />
Al Enmaa For Agricultural<br />
Development<br />
Enmaa For Reclamation &<br />
Agriculture<br />
99.9% Agriculture Land<br />
development<br />
99.9% Agriculture Land<br />
development<br />
Enmaa For Livestock 99.9% Dairy Farm<br />
Milkys Dairy Co. 40.0% Dairy Farm<br />
Tiba For Trading & Distribution 99.9% Sales & Distribution<br />
2
JUHAYNA FOOD INDUSTRIES<br />
Imports are increasing at a decreasing<br />
rate<br />
September 14, 2012<br />
INVESTMENT CASE<br />
DAIRY SEGMENT<br />
INITIATION OF COVERAGE EQUITY RESEARCH<br />
Demand for milk and dairy products in Egypt is increasing due to two main reasons:<br />
1 Population growth: annual historical rate averaged 1.9% during the last 10 years, according to<br />
IMF, and expected to increase slightly to 2% in the coming 6 years.<br />
1 Rising per capita consumption: from 47.6kg in 2007 to 49.8kg in 2010 and it is expected to reach<br />
53.6kg in 2015, according to Fapri.<br />
Chart 2: Dairy Consumption<br />
Source: Fapri<br />
Fluid milk accounts for about 45% of total dairy consumption. Local production, on the other hand,<br />
depends on 2 main factors:<br />
1 The number of milking cow heads: expected to increase slightly from 1.62 million in 2006 to 1.69<br />
million in 2015.<br />
1 Yield per cow: showing a noticeable improvement from 2.48 kg per day in 2007 to 2.75 in 2010,<br />
and expected to reach 3.48 in 2015 (CAGR of 4.8%), according to Fapri.<br />
Chart 3: Milk Production<br />
Source: Fapri<br />
Despite this increase, local production just covers a portion of total demand. Both local and foreign<br />
companies are eyeing the dairy market in Egypt to benefit from the deficit in the production<br />
capacity. Egyptian Dina Farms, for example, aims to double its 11,000 milking and non-milking cows<br />
herd by 2014. Juhayna is establishing its own dairy farm of 14,000 heads. Saudi Almarai plans to<br />
invest heavily in Egypt in order to gain a large market share. Therefore, imports are expected to keep<br />
increasing in the coming years but at a decreasing rate.<br />
3
JUHAYNA FOOD INDUSTRIES<br />
Conversion rate toward packaged milk<br />
is slow<br />
Emphasizing on cost efficient products<br />
On track to reduce reliance on 3 rd party<br />
suppliers<br />
September 14, 2012<br />
Chart 4: Imports<br />
Source: Fapri<br />
INITIATION OF COVERAGE EQUITY RESEARCH<br />
Important to note that the drop in production and consumption in 2009 was due to various kinds of<br />
diseases that affected the livestock in Egypt. Disease is a continuous risk that threats animal farms in<br />
Egypt which could lead to death and reproduction failure, and some limited cases were discovered<br />
in small farms in Egypt in 2012.<br />
Around 85% of the market is loose milk and just 15% is packaged milk. Different campaigns are<br />
done in collaboration between the private sector (including Juhayna) and the government in<br />
order to raise awareness among the public of the advantage of using packaged milk. However, the<br />
conversion toward the use of packaged milk is still slow mainly because of the price difference and<br />
it is expected to reach 20% in 2014.<br />
Juhayna is a main player in the plain packaged milk industry in Egypt with a market share of 70%<br />
followed by Beyti, indirectly owned by Almarai (8%). Juhayna is also the main player in the flavored<br />
packaged milk with a market share of 74% in 2011. In addition to milk, which is the largest contributor<br />
to the dairy revenues, Juhayna produces white cheese and cream. The company is increasing its<br />
dairy capacities - new production lines were installed during H1 12 and others will be installed in<br />
the coming quarters - and emphasizing on cost efficient and small size product. The dairy segment<br />
contributed more than 50% of the company’s total revenues in 2011. About 170 thousand tons were<br />
sold in 2011, recognizing revenues of EGP 1.1 billion.<br />
In order to reduce reliance on third parties, Juhayna is in the process of establishing its own dairy<br />
farms of 14,000 cows, allowing it to satisfy up to 50% of its raw milk needs – construction to begin in<br />
2013. This comes after the previous acquisition of 40% of Milkys Dairy, satisfying 10% of milk needs.<br />
In addition, it is in the process of the cultivation of animal feeds in order to have more control on raw<br />
material sources, including prices and quality.<br />
YOGHURT<br />
Demand for yoghurt increased by 60% between 2009 and 2011 to reach 156 million Kg in Egypt and<br />
it is expected to grow by 25% in the coming 3 years. However, per capita consumption remains one of<br />
the lowest in the world.<br />
Chart 5: Yoghurt Per Capita Consumption<br />
Source: Juhayna<br />
4
JUHAYNA FOOD INDUSTRIES<br />
Fast conversion toward packaged<br />
yogurt<br />
Juhayna has the capability to expand<br />
in the juice sector<br />
September 14, 2012<br />
INITIATION OF COVERAGE EQUITY RESEARCH<br />
Changing lifestyle, increasing health awareness and the entrance of international brands resulted in<br />
aggressive conversion from loose to packaged yoghurt, especially that there is little price difference.<br />
Packaged yoghurt accounted for 66% of total market in 2011 compared to 44% in 2008.<br />
Juhayna produced 61 million Kg of yoghurt in 2011, 39% higher than 2010. The company has a<br />
leading share of 73% in the drinkable market but it ranks second in the spoonable market with a<br />
31% share, after Danone (35%), according to MEMRB.<br />
The company’s share in the yoghurt market dropped from 44% in 2009 to 39% in 2011 due to the<br />
fire in its factory in 2010. In order to restore and also to increase its share, Juhayna is in the process<br />
of establishing a new EGP 330 million yoghurt factory in order to double its capacity. Operations are<br />
expected to start in mid 2013 and the company took a loan of EGP 300 million to finance the project.<br />
Chart 6: Juhayna Market Share in the Yoghurt Segment<br />
Source: Juhayna<br />
JUICE<br />
Juice demand increased at a CAGR of 17% between 2009 and 2011 in Egypt to reach 351 million Kg,<br />
but per capita consumption remains low at about 4 liters/year. Consumption is expected to increase<br />
at a CAGR of 8% in the coming 5 years, according to FAPRI.<br />
Chart 7: Juice Per Capita Consumption<br />
Source: Juhayna<br />
While the pure share remains constant at about 3% of total juice market, the nectar share is increasing<br />
(from 56% in 2009 to 59% in 2011) at the cost of drink. The juice market is fragmented with more<br />
than 300 players. Juhayna produced 67 million kg of juice in 2011 with an overall market share<br />
of 19%. Because the juice market is fragmented, and because Juhayna has the needed expertise<br />
and most importantly a well established distribution network, we believe that the company should<br />
expand in this sector in order to gain more market share in the nectar and drink segments.<br />
5
JUHAYNA FOOD INDUSTRIES<br />
September 14, 2012<br />
Chart 8: Juhayna Market Share in the Juice Sector<br />
Source: Juhayna, ASIB<br />
Table 2: Summary of Financials<br />
Revenues<br />
EGP million<br />
INITIATION OF COVERAGE EQUITY RESEARCH<br />
2008 2009 2010 2011 H1 12<br />
Dairy 918 907 1,037 1,135 644<br />
Yoghurt 262 364 402 614 346<br />
Juice 264 287 384 421 240<br />
Concentrate 18 20 39 45 17<br />
Agriculture 0 0 0 29 20<br />
Total 1462 1578 1861 2244 1267<br />
% of Total Revenues Dairy 63% 57% 56% 51% 51%<br />
Yoghurt 18% 23% 22% 27% 27%<br />
Juice 18% 18% 21% 19% 19%<br />
Concentrate 1% 1% 2% 2% 1%<br />
Agriculture 0% 0% 0% 1% 2%<br />
Gross Margin Dairy 8.0% 16.4% 16.2% 13.8% 27.0%<br />
Source: Juhayna, ASIB<br />
Yoghurt 22.4% 38.1% 36.8% 34.6% 35.0%<br />
Juice 34.3% 33.7% 32.2% 27.0% 29.0%<br />
Concentrate -5.1% -18.9% -16.3% 14.6% 21.0%<br />
Agriculture NA NA NA 34.6% 8.0%<br />
Total 20.0% 32.5% 31.3% 28.3% 28.2%<br />
Despite that dairy revenues are increasing, its contribution to total revenues is dropping while<br />
yoghurt contribution is increasing for 4 main reasons:<br />
1 Overall demand for yoghurt in Egypt is expected to increase at a faster pace than that of dairy<br />
in the coming few years.<br />
1 The conversion rate to packaged products is higher for the yoghurt than that of milk. As such,<br />
Juhayna has a greater ability to pass the increase in raw material costs to end consumers in the<br />
yoghurt products than that in the dairy products, as the price difference between loose and<br />
packaged products is smaller for yoghurt than that of milk. Average price for dairy products<br />
increased by 4% between Q1 11 and Q1 12, while it increased by 10% for yoghurt products,<br />
despite the higher competition in this sector.<br />
1 Gross margin of the Yoghurt segment is much higher than that of dairy.<br />
6
JUHAYNA FOOD INDUSTRIES<br />
Backward integration reduces the<br />
company’s volatility of earnings<br />
September 14, 2012<br />
INITIATION OF COVERAGE EQUITY RESEARCH<br />
1 Juhayna has a leading market share in the milk (plain and flavored) which is much higher than<br />
its share in the yoghurt segment.As such, Juhayna is in the process of doubling its yoghurt capacity<br />
in order to gain market share in this segment, which will increase yoghurt contribution to<br />
total revenues. At the same time, the company is working to maintain its leading market share<br />
in other segments.<br />
The volatility of the cost of fruits and animal feeds highly affects the performance of Juhayna. As<br />
such, the company is trying to secure parts of its needs by establishing a fruit farm, allowing it to<br />
secure about half of its fruit needs for concentrate plants, in addition to the cultivation of animal<br />
feeds. In the short term, however, the increase in the price of grains due to bad weather (including<br />
US and India) is expected to be reflected negatively in the company’s performance in the coming<br />
quarters.<br />
Juhayna has also a well established distribution channel with more than 800 vehicles and 24<br />
distribution centers and it is in the process of opening additional distribution centers.<br />
On the other hand, local currency devaluation is a main risk that threatens the company especially<br />
that more than 25% of raw materials are imported.<br />
In addition to local sales, Juhayna exports to neighborhood countries. Exports contributed 7.8%<br />
of total revenues in 2010, but it dropped to 4.1% in 2011, mainly due to the war in Libya, which<br />
accounted for 70% of total exports. In addition, gross margin dropped from 14% in 2010 to 8% in<br />
2011. Exports has started to improve in H1 12, and it contributed 5.2% of total revenues.<br />
Chart 9: Exports<br />
Source: Juhayna<br />
Juhayna was accused of violating of Anti-Monopolistic Law in pricing milk as well as many of<br />
its raw milk competitors such as Beyti and Enjoy. The Egyptian Competition Authority (ECA) has<br />
revealed that the three companies fixed the prices of raw milk bought from farmers. If proven true,<br />
a maximum fine of EGP 300 million will be imposed on Juhayna according to the law of punishment<br />
for any anti-competitive and monopolistic practices.<br />
7
JUHAYNA FOOD INDUSTRIES<br />
September 14, 2012<br />
SWOT ANALYSIS<br />
STRENGTHS<br />
1 Leading market shares<br />
1 Well established distribution channel<br />
1 Establishing of dairy and fruit farms<br />
1 Pricing flexibility<br />
WEAKNESSES<br />
1 High Inflation in Egypt<br />
1 Slow conversion to packaged milk<br />
1 Increase of fodder cost<br />
OPPORTUNITIES<br />
1 Restoring of exports<br />
1 Increasing capacity<br />
1 Fast conversion to packaged yoghurt<br />
THREATS<br />
1 Animal Disease<br />
INITIATION OF COVERAGE EQUITY RESEARCH<br />
1 High competition in the yoghurt and juice segments<br />
1 Fluctuation of costs of raw materials, including oil<br />
1 Currency devaluation<br />
1 Anti-monopoly case<br />
8
JUHAYNA FOOD INDUSTRIES<br />
September 14, 2012<br />
VALUATION<br />
INITIATION OF COVERAGE EQUITY RESEARCH<br />
The company has managed to benefit from the demand growth in the sectors it operates and also<br />
to gain more market share in some segments, namely yoghurt. According to our model, profitability<br />
margins will shrink in the short term because of the increase in the fodder cost and the expansion<br />
of the distribution network. The increase of the capacity of the yoghurt factory, the expansion of<br />
the milk production lines and the establishment of the dairy farm, and the agriculture business will<br />
increase revenues and reduce cost in the medium term, which will improve margins. We rely on the<br />
FCFF model to value the company’s share. We initiate our coverage with a fair value of EGP 5.01 per<br />
share, and we recommend to hold the stock.<br />
Table 3: FCFF<br />
EGP million unless otherwise stated 2012e 2013e 2014e<br />
Net Income 247 255 388<br />
Non-Cash Charges 172 203 212<br />
Fixed Capital Investment 500 500 300<br />
Change in Working Capital 70 82 53<br />
After Tax Interest 55 64 57<br />
FCFF (95) (60) 303<br />
PV of Terminal Value 3,613<br />
Net Debt 183<br />
Shares Outstanding (million) 706<br />
WACC 13.5%<br />
Terminal Growth 4.1%<br />
Fair Value (EGP) 5.01<br />
9
JUHAYNA FOOD INDUSTRIES<br />
September 14, 2012<br />
PRO FORMA FINANCIALS<br />
INITIATION OF COVERAGE EQUITY RESEARCH<br />
EGP million unless otherwise stated 2010 2011 2012e 2013e 2014e<br />
Sales 1,861 2,244 2,782 3,244 3,848<br />
Growth 18% 21% 24% 17% 19%<br />
COGS (1,279) (1,609) (1,973) (2,347) (2,733)<br />
Gross profit 582.7 635.0 809.6 897.3 1,115.1<br />
Growth 14% 9% 28% 11% 24%<br />
Gross margin 31.3% 28.3% 29.1% 27.7% 29.0%<br />
S&D expenses (205) (255) (356) (406) (462)<br />
G&A expenses (82) (98) (121) (141) (169)<br />
Others* 19 (35) 2 2 5<br />
EBITDA 441 385 506 555 701<br />
EBITDA margin 23.7% 17.2% 18.2% 17.1% 18.2%<br />
EBIT 315 246 334 353 489<br />
EBIT margin 16.9% 11.0% 12.0% 10.9% 12.7%<br />
Net finance cost (59) (39) (59) (68) (60)<br />
Taxes (28) (23) (28) (29) (40)<br />
NI to shareholders 228 186 247 255 388<br />
Growth 23% -18% 33% 3% 52%<br />
Net margin 12.2% 8.3% 8.9% 7.9% 10.1%<br />
*2011 figure included EGP 41 million factory fire losses<br />
EGP million unless otherwise stated 2010 2011 2012e 2013e 2014e<br />
PPE 1,151 1,329 1,657 1,954 2,042<br />
Under construction 138 214 300 200 140<br />
Goodwill 97 97 97 97 97<br />
Investments 39 42 44 45 47<br />
Others 1 1 1 1 1<br />
Total non current assets 1,425 1,683 2,099 2,297 2,327<br />
Cash & equivalents 724 691 533 543 666<br />
Inventories 280 397 468 556 629<br />
AR 299 188 231 273 316<br />
Others 1 1 2 2 2<br />
Total current assets 1,303 1,278 1,233 1,373 1,612<br />
Total assets 2,728 2,961 3,332 3,670 3,940<br />
LT loans 384 252 299 320 320<br />
Other Liabilities 77 81 85 93 104<br />
Total non current liabilities 461 334 384 413 424<br />
Short term debt 377 647 739 898 798<br />
Trade balances 217 149 187 235 287<br />
Others 29 20 26 27 37<br />
Total current liabilities 623 816 952 1,160 1,123<br />
Total liabilities 1,084 1,149 1,336 1,573 1,547<br />
Total equity 1,644 1,812 1,996 2,097 2,393<br />
ROAE 20.5% 10.8% 13.0% 12.5% 17.3%<br />
ROAA 9.8% 6.5% 7.8% 7.3% 10.2%<br />
Net debt to equity 0.02 0.11 0.25 0.32 0.19<br />
10
JUHAYNA FOOD INDUSTRIES<br />
September 14, 2012<br />
APPENDIX I<br />
RELATIVE VALUATION<br />
INITIATION OF COVERAGE EQUITY RESEARCH<br />
Below are some food producers with similar business model in the world. We include these figures<br />
for comparative purposes only. Calculation is based on 2011 numbers, except PE, PB and EV/EBITDA<br />
ratios which are based on trailing figures ending Q1 or Q2 12 (according to the availability of data).<br />
Table 4: Relative valuation<br />
PE PB EV/EBITDA DVD ROE ROA Net Debt<br />
to Equity<br />
Net<br />
Margin<br />
Gross<br />
Margin<br />
Alaska Milk Corp 10.58 3.16 5.47 4.5% 18.0% 11.9% (0.61) 9.4% 28.2%<br />
Nestle Lanka PLC 22.57 12.89 16.09 5.4% 79.0% 29.5% (0.02) 10.2% 33.3%<br />
JM Smucker Co 15.60 1.60 8.54 2.5% 8.9% 5.0% 0.36 8.3% 34.2%<br />
Dean Foods Co 14.94 NA 8.14 0.0% 6.0% 1.1% 2.63 0.8% 24.8%<br />
Agrana AG 7.77 1.14 5.83 4.5% 14.2% 6.5% 0.54 5.9% NA<br />
Oarmalat SpA 11.34 0.74 4.97 3.9% 6.0% 4.7% (0.41) 5.0% 20.6%<br />
Almarai 15.24 3.06 11.87 2.3% 16.8% 7.3% 0.98 14.3% 37.7%<br />
Nadec 28.01 1.51 10.09 5.1% 8.6% 3.9% 0.83 5.9% 35.2%<br />
Halwani Brothers 14.30 1.98 7.59 3.7% 15.0% 11.7% (0.20) 9.9% 29.9%<br />
Average 15.60 3.26 8.73 0.04 19.2% 9.1% 0.45 7.7% 30.5%<br />
Juhayna 17.10 1.85 8.13 3.8% 10.3% 6.3% 0.12 8.3% 28.3%<br />
APPENDIX II<br />
SCENARIO ANALYSIS<br />
We run scenario <strong>analysis</strong> concerning the major economic risks that threaten Juhayna’s operating<br />
environment - the depreciation of the Egyptian Pound and the change in the interest rate – and how<br />
they affect the valuation of Juhayna.<br />
EGP/USD<br />
WACC<br />
12.0% 13.0% 13.5% 14.0% 15.0%<br />
5.5 7.09 6.15 5.76 5.41 4.82<br />
6.1 6.08 5.31 5.01 4.69 4.19<br />
6.7 6.08 5.31 4.98 4.69 4.19<br />
7.3 5.61 4.9 4.61 4.34 3.88<br />
7.9 2.61 2.31 2.17 2.05 1.83<br />
11
JUHAYNA FOOD INDUSTRIES<br />
FAIR VALUE DEFINITION<br />
September 14, 2012<br />
RATING GUIDE<br />
ISSUER<br />
INITIATION OF COVERAGE EQUITY RESEARCH<br />
It is an unbiased estimate of the 12-month potential market price of the stock<br />
SELL REDUCE HOLD ACCUMULATE BUY<br />
Downside -30% -10% +10% +30% Upside<br />
BUY: Upside potential in share price is more than 30%<br />
ACCUMULATE: Upside potential in share price is between 10 and 30%<br />
HOLD: Upside or downside potential in share price less than 10%<br />
REDUCE: Downside potential in share price is between 10 and 30%<br />
SELL: Downside potential in share price is more than 30%<br />
<strong>Audi</strong> Saradar Investment <strong>Bank</strong><br />
<strong>Audi</strong> Saradar Investment <strong>Bank</strong> SAL • Lebanese joint stock company with a registered capital of<br />
10,000,000,000 Lebanese Pounds • Commercial Registrar in Beirut: 30812 • Holding number 33 on<br />
the Central <strong>Bank</strong>’s <strong>Bank</strong>s List.<br />
<strong>Bank</strong> <strong>Audi</strong> Plaza • Bab Idriss • Beirut 2021 8102 Lebanon • P.O. Box 11-2560 • Beirut 1107 2808 •<br />
Lebanon. Phone: +961 1 964072 • Fax: +961 1 970403 • Email: contactus@asib.com<br />
12
JUHAYNA FOOD INDUSTRIES<br />
September 14, 2012<br />
DISCLAIMER<br />
INITIATION OF COVERAGE EQUITY RESEARCH<br />
“All rights reserved. This research document (the “Document”) is prepared by <strong>Audi</strong> Saradar Investment <strong>Bank</strong> SAL (“ASIB”),<br />
being an entity of <strong>Audi</strong> Saradar Group, for the use of the clients of ASIB and/or the clients of any entity within the <strong>Audi</strong><br />
Saradar Group.<br />
This Document is disclosed to you on a confidential basis. Receipt and/or review of this Document constitute your agreement<br />
not to copy, modify, redistribute, retransmit, or disclose to others the contents, opinions, conclusion, or information<br />
contained in this Document prior to public disclosure of the same by ASIB or the <strong>Audi</strong> Saradar Group or without the express<br />
prior written consent of ASIB.<br />
This Document is not intended for dissemination, distribution to, or use by, any person or entity in any country or jurisdiction<br />
which would subject ASIB or any entity within the <strong>Audi</strong> Saradar Group, to any registration or licensing requirements within<br />
these jurisdictions or where it might be considered as unlawful. Accordingly, this Document is for distribution solely in<br />
jurisdictions where permitted and to persons who may receive it without breaching any applicable legal or regulatory<br />
requirements. In any case, this Document shall not be distributed in the Republic of Egypt.<br />
Your attention is drawn to the fact that you should not access this Document if the regulations of your country of citizenship<br />
and/or residency or any applicable regulations prohibit it. In any case, persons who are subject to any restrictions in any<br />
country, such as US persons are not permitted to access information contained herein.<br />
Neither the information, nor any opinion expressed herein constitutes an offer or an invitation or a recommendation to<br />
make an offer, to buy or sell any security or other investment product related to such security or investment. This Document<br />
provides general information only, is not intended to provide personal investment advice or recommendation and does not<br />
take into account the specific investment objectives, financial situation and the particular needs of any specific person who<br />
may receive it. You should seek financial, legal or tax advice regarding the appropriateness and suitability in investing in any<br />
security, other investment or investment strategy discussed or forecasted in this Document.<br />
You should carefully read the definitions of the Rating Guide provided in this Document. In addition you should read this<br />
Document in its entirety and not conclude its contents from the ratings solely.<br />
The information herein was obtained from various public sources believed in good faith to be reliable. Neither ASIB nor any<br />
entity within the <strong>Audi</strong> Saradar Group represents that the information contained in this Document is complete, accurate<br />
or free from any error and makes no representations or warranties whatsoever as to the data, information and opinions<br />
provided herein.<br />
This Document and any information, opinion and prospect contained herein reflect a judgment at its original date<br />
of publication by ASIB and are subject to change without notice. ASIB and/or any entity within the <strong>Audi</strong> Saradar Group<br />
may have issued, and may in the future issue, other research documents that are inconsistent with, and reach different<br />
conclusions from, the information, opinions and prospects presented in this Document.<br />
This Document reflects the different assumptions, views and analytical methods of the analysts who prepared them; ASIB,<br />
and the <strong>Audi</strong> Saradar Group are under no obligation to ensure that such other research documents are brought to the<br />
attention of any recipient of this Document.<br />
ASIB, any entity within the <strong>Audi</strong> Saradar Group, one or more of their affiliates and/or their officers (including but not limited<br />
to their strategists, analysts and sales staff) may have a financial interest in securities of the issuer(s) or related investments,<br />
may engage in securities transactions, on a proprietary basis or otherwise, in a manner inconsistent with the view taken in<br />
this Document and may take a view that is inconsistent with that taken herein.<br />
The price, value of and income from any of the securities or financial instruments mentioned in this Document can fall as well<br />
as rise. The value of securities and financial instruments is subject to market conditions, volatility, exchange rate fluctuation<br />
and credit quality of any issuer that may have a positive or adverse effect on the price or income of such securities or<br />
financial instruments. Any forecasts on the economy, stock market, bond market or the economic trends of the markets are<br />
not necessarily a guide to future returns. You should understand that statements regarding future prospects may not be<br />
realized. Past performance should not be taken as an indication or guarantee of future performance, and no representation<br />
or warranty, express or implied, is made regarding future returns. As a result of the preceding, you may lose, as the case may<br />
be, the amount originally invested.<br />
None of ASIB, any entity within the <strong>Audi</strong> Saradar Group, any of their affiliates and/or their officers (including but not limited<br />
to their strategists, analysts and sales staff) shall be held liable for any loss or damage that may arise, directly or indirectly,<br />
from any use of the information contained in this Document nor for any decision or investment made on the basis of<br />
information contained herein.”<br />
13