
You also want an ePaper? Increase the reach of your titles
YUMPU automatically turns print PDFs into web optimized ePapers that Google loves.
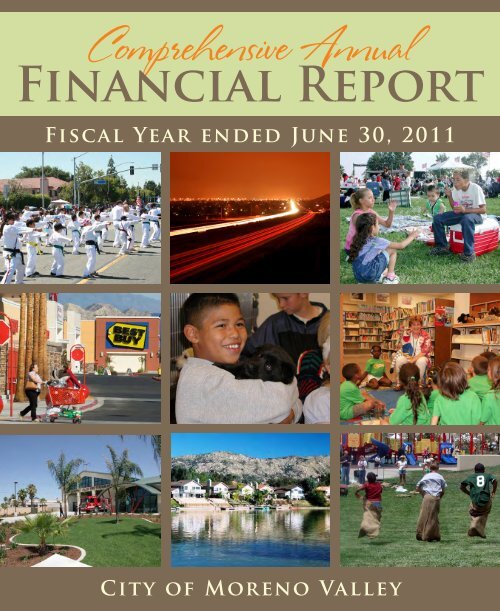
Comprehensive Annual<br />
<strong>Financial</strong> <strong>Report</strong><br />
Fiscal Year ended June 30, 2011<br />
City of <strong>Moreno</strong> <strong>Valley</strong>
CITY OF MORENO VALLEY, CALIFORNIA<br />
COMPREHENSIVE ANNUAL FINANCIAL REPORT<br />
YEAR ENDED JUNE 30, 2011
INTRODUCTORY SECTION<br />
City of <strong>Moreno</strong> <strong>Valley</strong><br />
Comprehensive Annual <strong>Financial</strong> <strong>Report</strong><br />
Fiscal Year Ended June 30, 2011<br />
Table of Contents<br />
Page<br />
Number<br />
Letter of Transmittal .................................................................................................................................. i<br />
Municipal Officials .................................................................................................................................... iv<br />
Organization Chart .................................................................................................................................. v<br />
GFOA Certificate of Achievement for Excellence in <strong>Financial</strong> <strong>Report</strong>ing................................................ vi<br />
FINANCIAL SECTION<br />
INDEPENDENT AUDITOR’S REPORT ........................................................................................................ 1<br />
MANAGEMENT’S DISCUSSION AND ANALYSIS ...................................................................................... 3<br />
BASIC FINANCIAL STATEMENTS<br />
Government-Wide <strong>Financial</strong> Statements:<br />
Statement of Net Assets ................................................................................................................. 15<br />
Statement of Activities .................................................................................................................... 16<br />
Fund <strong>Financial</strong> Statements:<br />
Balance Sheet – Governmental Funds ............................................................................................ 20<br />
Reconciliation of the Balance Sheet of Governmental Funds to the<br />
Statement of Net Assets .................................................................................................................. 23<br />
Statement of Revenues, Expenditures and Changes in Fund<br />
Balances – Governmental Funds ..................................................................................................... 24<br />
Reconciliation of the Statement of Revenues, Expenditures and Changes<br />
in Fund Balances of Governmental Funds to the Statement of Activities ........................................ 26<br />
Budgetary Comparison Statement – General Fund ......................................................................... 27<br />
Budgetary Comparison Statement – CSD Zones Special Revenue Fund ...................................... 28<br />
Budgetary Comparison Statement – Development Impact Fees<br />
Special Revenue Fund ..................................................................................................................... 29<br />
Proprietary Funds:<br />
Statement of Fund Net Assets – Proprietary Funds ........................................................................ 32<br />
Statement of Revenues, Expenses and Changes in Fund Net<br />
Assets – Proprietary Funds .............................................................................................................. 33<br />
Statement of Cash Flows – Proprietary Funds ................................................................................ 34
FINANCIAL SECTION (CONTINUED)<br />
City of <strong>Moreno</strong> <strong>Valley</strong><br />
Comprehensive Annual <strong>Financial</strong> <strong>Report</strong><br />
Fiscal Year Ended June 30, 2011<br />
Table of Contents (Continued)<br />
Page<br />
Number<br />
Fiduciary Funds:<br />
Statement of Fiduciary Net Assets – Fiduciary Funds ..................................................................... 36<br />
Notes to <strong>Financial</strong> Statements ................................................................................................................ 37<br />
COMBINING AND INDIVIDUAL FUND STATEMENTS AND SCHEDULES<br />
Nonmajor Governmental Funds:<br />
Combining Balance Sheet – Nonmajor Governmental Funds ......................................................... 80<br />
Combining Statement of Revenues, Expenditures and Changes in<br />
Fund Balances – Nonmajor Governmental Funds ........................................................................... 98<br />
Budgetary Comparison Schedules – Special Revenue Funds:<br />
State Gasoline Tax .......................................................................................................................... 116<br />
Measure A ....................................................................................................................................... 117<br />
Law Enforcement ............................................................................................................................ 118<br />
Other Grants ................................................................................................................................... 119<br />
Air Quality Management.................................................................................................................. 120<br />
Community Development Block Grant ............................................................................................ 121<br />
Special Districts Administration ....................................................................................................... 122<br />
Storm Water Management .............................................................................................................. 123<br />
HOME.............................................................................................................................................. 124<br />
Child Care Grant ............................................................................................................................. 125<br />
Used Oil Recycling .......................................................................................................................... 126<br />
Traffic Congestion Relief ................................................................................................................. 127<br />
Storm Water Maintenance .............................................................................................................. 128<br />
H.E.A.L. ........................................................................................................................................... 129<br />
ASES Program Grants .................................................................................................................... 130<br />
CFD # 4M ........................................................................................................................................ 131<br />
Neighborhood Stabilization Grant ................................................................................................... 132<br />
Homelessness Prevention Program ............................................................................................... 133<br />
CDBG Recovery Act of 2009 .......................................................................................................... 134<br />
Prop 1B ........................................................................................................................................... 135<br />
FHWA TRANSIMS .......................................................................................................................... 136<br />
TRI16-06-1 Target Rubberized ....................................................................................................... 137<br />
Civil Penalties .................................................................................................................................. 138<br />
Emergency Services Agency Fines ................................................................................................ 139<br />
Disaster ........................................................................................................................................... 140<br />
Budgetary Comparison Schedules – Capital Projects Funds:<br />
Community Redevelopment Agency Capital Projects .................................................................... 141<br />
City Hall Capital / Administration ..................................................................................................... 142<br />
Public Works Capital Projects ......................................................................................................... 143<br />
Fire Services Capital Projects ......................................................................................................... 144
City of <strong>Moreno</strong> <strong>Valley</strong><br />
Comprehensive Annual <strong>Financial</strong> <strong>Report</strong><br />
Fiscal Year Ended June 30, 2011<br />
Table of Contents (Continued)<br />
COMBINING AND INDIVIDUAL FUND STATEMENTS AND SCHEDULES (CONTINUED)<br />
Page<br />
Number<br />
Budgetary Comparison Schedules – Capital Projects Funds (Continued):<br />
Towngate Capital / Administration .................................................................................................. 145<br />
Warner Ranch Capital / Development ............................................................................................ 146<br />
Auto Mall Capital / Administration ................................................................................................... 147<br />
Parks and Community Services Capital Projects ........................................................................... 148<br />
TUMF Capital Projects .................................................................................................................... 149<br />
DIF Capital Projects ........................................................................................................................ 150<br />
Lease Revenue Bonds 2005 Capital Projects ................................................................................ 151<br />
Budgetary Comparison Schedules – Debt Service Funds:<br />
Community Redevelopment Agency Debt Service ......................................................................... 152<br />
OPA Sales Tax Agreements ........................................................................................................... 153<br />
City Hall COPs Series 1997 ............................................................................................................ 154<br />
Auto Mall Special Tax Bonds .......................................................................................................... 155<br />
Public Safety Lease Revenue Bonds 1997..................................................................................... 156<br />
Lease Revenue Bonds 2005 Debt Service ..................................................................................... 157<br />
2007 Towngate Improvement Refunding ........................................................................................ 158<br />
2007 Towngate Refunding .............................................................................................................. 159<br />
Budgetary Comparison Schedule – Permanent Funds:<br />
Celebration Park Endowment ......................................................................................................... 160<br />
Internal Service:<br />
Combining Statement of Net Assets – Internal Service Funds ...................................................... 162<br />
Combining Statement of Revenues, Expenses and Changes in<br />
Fund Net Assets – Internal Service Funds .................................................................................... 164<br />
Combining Statement of Cash Flows – Internal Service Funds ..................................................... 166<br />
Agency Funds:<br />
Combining Balance Sheet – All Agency Funds .............................................................................. 170<br />
Combining Statement of Changes in Assets and<br />
Liabilities – All Agency Funds ......................................................................................................... 172<br />
Schedule of General Capital Assets by Function and Activity .............................................................. 176
STATISTICAL SECTION<br />
City of <strong>Moreno</strong> <strong>Valley</strong><br />
Comprehensive Annual <strong>Financial</strong> <strong>Report</strong><br />
Fiscal Year Ended June 30, 2011<br />
Table of Contents (Continued)<br />
Page<br />
Number<br />
Statistical Section Table of Contents ..................................................................................................... 179<br />
Net Assets by Component ..................................................................................................................... 180<br />
Change in Net Assets ............................................................................................................................ 181<br />
Fund Balances - Governmental Funds .................................................................................................. 184<br />
Changes in Fund Balances - Governmental Funds .............................................................................. 185<br />
Tax Revenues by Source – Governmental Funds ................................................................................ 187<br />
Key Revenues ....................................................................................................................................... 188<br />
Assessed Value and Estimated Actual Value of Taxable Property ....................................................... 189<br />
Property Tax Rates ................................................................................................................................ 190<br />
Principal Property Tax Payers ............................................................................................................... 191<br />
Property Tax Levies and Collections ..................................................................................................... 192<br />
Direct and Overlapping Debt ................................................................................................................. 193<br />
Legal Debt Margin ................................................................................................................................. 194<br />
Ratios of Outstanding Debt by Type...................................................................................................... 195<br />
Ratio of Bonded Debt ............................................................................................................................ 196<br />
Pledged Revenue Coverage ................................................................................................................. 197<br />
Demographic and Economic Statistics .................................................................................................. 198<br />
Principal Employers ............................................................................................................................... 199<br />
Full-time and Part-time City Employees by Function ............................................................................ 200<br />
Capital Asset Statistics .......................................................................................................................... 201<br />
Operating Indicators by Function ........................................................................................................... 202
Introductory Section
The City operates under the council-manager form of government with a five-member council elected by<br />
district for four-year overlapping terms. Each year the council elects the mayor for a one-year term. The<br />
City Council is responsible for, among other things, passing ordinances, adopting the budget, appointing<br />
committees, and hiring the City Manager, City Attorney and City Clerk. The City Manager is responsible<br />
for carrying out the policies and ordinances of the Council, for overseeing the day-to-day operations of<br />
the City, and for appointing the heads of the various departments.<br />
The City provides a wide range of services, which include general government, public safety (police, fire,<br />
code enforcement, animal control services, disaster preparedness, and school crossing guards),<br />
construction and maintenance of highways and streets, economic development, library, an electric utility<br />
which primarily serves the newly developed areas of the City, parks, and a wide range of recreation<br />
programs. In addition to general City activities, the Council is financially accountable for the Community<br />
Redevelopment Agency of the City of <strong>Moreno</strong> <strong>Valley</strong>, the <strong>Moreno</strong> <strong>Valley</strong> Community Services District,<br />
the <strong>Moreno</strong> <strong>Valley</strong> Public Financing Authority, the <strong>Moreno</strong> <strong>Valley</strong> Public Facilities Financing<br />
Corporation, the Housing Authority, and several Community Facilities Districts. These entities are<br />
included as an integral part of the City’s financial statements. Additional information on these legally<br />
separate entities can be found in Note 1a of the Notes to Basic <strong>Financial</strong> Statements.<br />
The annual budget serves as the foundation for the City’s financial planning and control. The City<br />
Manager presents the proposed budget to the City Council for review in April/May of each year. The<br />
Council holds a series of public meetings on the proposed budget, and generally adopts a final budget no<br />
later than June 30 th . The City’s fiscal year is July 1 st through June 30 th . The appropriated budget is<br />
prepared by fund, department and program, and is controlled at the department level. The City Manager<br />
can approve transfers between programs, departments or funds, provided that such transfers do not<br />
increase the overall budget. Appropriations that increase the budget require City Council approval.<br />
Budget-to-actual comparisons are provided in this report for each individual governmental fund for which<br />
an appropriated annual budget has been adopted. The budget-to-actual comparisons for the general fund<br />
and the major governmental funds can be found in the Basic <strong>Financial</strong> Statements section of this report.<br />
The budget-to-actual comparisons for the non-major governmental funds can be found in the Non-Major<br />
governmental funds section of this report.<br />
Factors Affecting <strong>Financial</strong> Condition<br />
The information presented in the financial statements is perhaps best understood when it is considered<br />
from the broader perspective of the specific environment within which the City of <strong>Moreno</strong> <strong>Valley</strong><br />
operates.<br />
Local economy. The City of <strong>Moreno</strong> <strong>Valley</strong> is located in the Inland Empire, which consists of Riverside<br />
and San Bernardino Counties. The Inland Empire had experienced a vibrant economic environment from<br />
the mid 90’s to mid 2000’s, and during this period the City experienced strong residential and commercial<br />
growth. With the current economic situation, the growth rate has slowed considerably.<br />
For six years, from 2002 to 2008, the City experienced double-digit growth in many of the key factors<br />
that generate revenue for the City. During this six-year period assessed valuations of property increased<br />
by 136%. However, during fiscal year 2007-08 the City began to see the developing weakness in the<br />
economy that is now evident on a national basis. Assessed valuations of property decreased in <strong>Moreno</strong><br />
<strong>Valley</strong> in FY 2009-10 and have continued to decline through fiscal year 2010-11. For FY 2011-12 and the<br />
following few years, the regions are expected to see flat to moderate levels of growth in assessed<br />
valuations.<br />
ii
iii
CITY OF MORENO VALLEY<br />
MUNICIPAL OFFICIALS<br />
June 30, 2011<br />
_______________________________________________________<br />
CITY COUNCIL<br />
Richard A. Stewart, Mayor<br />
Jesse L. Molina, Mayor Pro Tem<br />
William H. Batey II, Councilmember<br />
Marcelo Co, Councilmember<br />
Robin N. Hastings, Councilmember<br />
_______________________________________________________<br />
EXECUTIVE OFFICERS<br />
Henry Garcia, City Manager<br />
Michelle Dawson, Assistant City Manager<br />
Robert L. Hansen, City Attorney<br />
Jane Halstead, City Clerk<br />
Barry Foster, Community & Economic Development Director<br />
Richard Teichert, <strong>Financial</strong> & Administrative Services Director<br />
Steve Curley, Fire Chief<br />
Sonny Morkus, Human Resources Director<br />
Michael McCarty, Parks & Community Services Director<br />
John Anderson, Police Chief<br />
Chris A. Vogt, Public Works Director/City Engineer<br />
iv
City of <strong>Moreno</strong> <strong>Valley</strong> Organization Chart<br />
Citizens<br />
Library Board of Trustees<br />
(City Council)<br />
City Council Community Services<br />
District<br />
(City Council)<br />
MV Public Financing Authority<br />
(City Council)<br />
Redevelopment Agency (RDA)<br />
(City Council)<br />
Executive Director - (City Manager)<br />
City Clerk Commissions<br />
City Manager<br />
Boards City Attorney<br />
Library Commission Arts Commission<br />
Recreational Trails<br />
Board<br />
Accessibility Appeals<br />
Board<br />
Planning Commission Parks & Recreation<br />
Commission<br />
Assistant City Manager<br />
Senior Citizens’ Board<br />
Traffic Safety<br />
Commission<br />
<strong>Financial</strong> &<br />
Administrative Services<br />
Community & Economic<br />
Development<br />
Environmental &<br />
Historical Preservation<br />
Board<br />
Animal Services <strong>Financial</strong> Operations<br />
Building & Safety Planning<br />
Technology Services<br />
Purchasing &<br />
Facilities<br />
Neighborhood<br />
Preservation/<br />
Redevelopment<br />
Code & Neighborhood<br />
Services<br />
v<br />
Treasury Operations<br />
Human Resources Fire Department<br />
Risk Management Fire Operations Fire Prevention<br />
Parks & Community Services<br />
Recreation<br />
Parks<br />
Library<br />
Police Public Works<br />
Administration Detective Capital Projects Electric Utility<br />
Maintenance &<br />
Operations<br />
Land Development<br />
Patrol Special Teams<br />
Special Districts Transportation<br />
Traffic
<strong>Financial</strong> Section
Brandon W. Burrows, CPA<br />
David E. Hale, CPA, CFP<br />
A Professional Corporation<br />
Donald G. Slater, CPA<br />
Richard K. Kikuchi, CPA<br />
Susan F. Matz, CPA<br />
Shelly K. Jackley, CPA<br />
Bryan S. Gruber, CPA<br />
Deborah A. Harper, CPA<br />
INDEPENDENT AUDITOR'S REPORT<br />
To the Honorable Mayor and Members of City Council<br />
City of <strong>Moreno</strong> <strong>Valley</strong>, California<br />
We have audited the accompanying financial statements of the governmental activities, the business-type<br />
activities, each major fund, and the aggregate remaining fund information of the City of <strong>Moreno</strong> <strong>Valley</strong>,<br />
California, as of and for the year ended June 30, 2011, which collectively comprise the City's basic<br />
financial statements as listed in the table of contents. These financial statements are the responsibility of<br />
City of <strong>Moreno</strong> <strong>Valley</strong>, California's management. Our responsibility is to express opinions on these<br />
financial statements based on our audit.<br />
We conducted our audit in accordance with auditing standards generally accepted in the United States of<br />
America and the standards applicable to financial audits contained in Government Auditing Standards,<br />
issued by the Comptroller General of the United States. Those standards require that we plan and<br />
perform the audit to obtain reasonable assurance about whether the financial statements are free of<br />
material misstatement. An audit includes examining, on a test basis, evidence supporting the amounts<br />
and disclosures in the financial statements. An audit also includes assessing the accounting principles<br />
used and the significant estimates made by management, as well as evaluating the overall financial<br />
statement presentation. We believe that our audit provides a reasonable basis for our opinion.<br />
In our opinion, the financial statements referred to above present fairly, in all material respects, the<br />
respective financial position of the governmental activities, the business-type activities, each major fund,<br />
and the aggregate remaining fund information of the City of <strong>Moreno</strong> <strong>Valley</strong>, California, as of<br />
June 30, 2011, and the respective changes in financial position, and cash flows, where applicable, thereof<br />
and the respective budgetary comparison for the General Fund, CSD Zones Special Revenue Fund and<br />
the Development Impact Fees Special Revenue Fund for the year then ended in conformity with<br />
accounting principles generally accepted in the United States of America.<br />
We would like to draw the reader’s attention to Note 14 – “California Redevelopment Agency<br />
Dissolution.” The note provides information on two bills passed, AB X1 26 and AB X1 27 which dissolve<br />
redevelopment agencies and provide an option to avoid dissolution by making certain defined payments.<br />
The Note also provides further information on the California Supreme Court ruling dated<br />
December 29, 2011 in regards to these two bills.<br />
In accordance with Government Auditing Standards, we have also issued our report dated<br />
January 12, 2012, on our consideration of the City of <strong>Moreno</strong> <strong>Valley</strong>, California’s internal control over<br />
financial reporting and on our tests of its compliance with certain provisions of laws, regulations,<br />
contracts, and grant agreements and other matters. The purpose of that report is to describe the scope<br />
of our testing of internal control over financial reporting and compliance and the results of that testing, and<br />
not to provide an opinion on internal control over financial reporting or on compliance. That report is an<br />
integral part of an audit performed in accordance with Government Auditing Standards and should be<br />
considered in assessing the results of our audit.<br />
Lance, Soll & Lunghard, LLP 203 North Brea Boulevard • Suite 203 • Brea, CA 92821 • TEL: 714.672.0022 • Fax: 714.672.0331 www.lslcpas.com<br />
Orange County Temecula <strong>Valley</strong> Silicon <strong>Valley</strong>
To the Honorable Mayor and Members of City Council<br />
City of <strong>Moreno</strong> <strong>Valley</strong>, California<br />
Accounting principles generally accepted in the United States of America require that the management's<br />
discussion and analysis as listed in the table of contents be presented to supplement the basic financial<br />
statements. Such information, although not a part of the basic financial statements, is required by the<br />
Governmental Accounting Standards Board, who considers it to be an essential part of financial reporting<br />
for placing the basic financial statements in an appropriate operational, economic, or historical context.<br />
We have applied certain limited procedures to the required supplementary information in accordance with<br />
auditing standards generally accepted in the United States of America, which consisted of inquiries of<br />
management about the methods of preparing the information and comparing the information for<br />
consistency with management's responses to our inquiries, the basic financial statements, and other<br />
knowledge we obtained during our audit of the basic financial statements. We do not express an opinion<br />
or provide any assurance on the information because the limited procedures do not provide us with<br />
sufficient evidence to express an opinion or provide any assurance.<br />
Our audit was conducted for the purpose of forming opinions on the financial statements that collectively<br />
comprise the City of <strong>Moreno</strong> <strong>Valley</strong>, California's financial statements as a whole. The introductory<br />
section, combining and individual nonmajor fund financial statements and schedules and statistical<br />
section are presented for purposes of additional analysis and are not a required part of the financial<br />
statements. The combining and individual nonmajor fund financial statements are the responsibility of<br />
management and were derived from and relate directly to the underlying accounting and other records<br />
used to prepare the financial statements. The information has been subjected to the auditing procedures<br />
applied in the audit of the financial statements and certain additional procedures, including comparing and<br />
reconciling such information directly to the underlying accounting and other records used to prepare the<br />
financial statements or to the financial statements themselves, and other additional procedures in<br />
accordance with auditing standards generally accepted in the United States of America. In our opinion,<br />
the information is fairly stated in all material respects in relation to the financial statements as a whole.<br />
The introductory and statistical sections have not been subjected to the auditing procedures applied in the<br />
audit of the basic financial statements and, accordingly, we do not express an opinion or provide any<br />
assurance on them.<br />
Brea, California<br />
January 12, 2012<br />
2
Management’s Discussion and Analysis<br />
As management of the City of <strong>Moreno</strong> <strong>Valley</strong> (the City), we offer this narrative overview and analysis of<br />
financial activities for the fiscal year ended June 30, 2011. We encourage readers to consider the information<br />
presented here in conjunction with additional information furnished in our letter of transmittal, which can be<br />
found in the Introductory Section of this Comprehensive Annual <strong>Financial</strong> <strong>Report</strong>. All amounts, unless otherwise<br />
indicated, are expressed in thousands of dollars.<br />
<strong>Financial</strong> Highlights<br />
• The assets of the City of <strong>Moreno</strong> <strong>Valley</strong> exceeded its liabilities at June 30, 2011 by $958.5 million (net<br />
assets). Of this amount, $51.2 million (unrestricted net assets) may be used to meet the City’s ongoing<br />
obligations to citizens and creditors.<br />
• The City’s governmental activities’ net assets increased by $6.8 million, which is largely attributable to an<br />
increase in capital assets.<br />
• During the year, the City (which includes the Community Redevelopment Agency of the City of <strong>Moreno</strong><br />
<strong>Valley</strong> and the City of <strong>Moreno</strong> <strong>Valley</strong> Community Services District) had revenues that were $8.2 million<br />
more than the $165.3 million expenses recorded by the City in its governmental and business-type activities.<br />
• The total debt of the City showed a net decrease of $0.6 million (0.5%) during the current fiscal year. The<br />
decrease in debt was a result of normal maturity on existing debt.<br />
• The General Fund had an end of year fund balance of $46.4 million. This was a decrease of $4.9 million and a<br />
decrease of 9.6% over FY 2009-10.<br />
Overview of <strong>Financial</strong> Statements<br />
This discussion and analysis is intended to serve as an introduction to the City’s basic financial statements,<br />
comprised of three components: 1) government-wide financial statements, 2) fund financial statements, and 3)<br />
notes to the financial statements. This report also contains certain supplementary information.<br />
Government-wide financial statements. The government-wide financial statements are designed to provide<br />
readers with a broad overview of the City’s finances, in a manner similar to a private-sector business.<br />
The statement of net assets presents information on all of the City’s assets and liabilities, with the difference<br />
between the two reported as net assets. Over time, increases or decreases in the net assets may serve as a useful<br />
indicator of whether the financial position of the City is improving or deteriorating.<br />
The statement of activities presents information showing how the City’s net assets changed during the most recent<br />
fiscal year. All changes in net assets are reported as soon as the underlying event giving rise to the change occurs,<br />
regardless of the timing of related cash flows. Thus, revenues and expenses are reported in this statement for<br />
some items that will only result in cash flows in future fiscal periods (e.g., uncollected taxes and earned but<br />
unused vacation leave).<br />
The government-wide financial statements display functions of the City that are principally supported by taxes<br />
and intergovernmental revenues (governmental activities) from other functions that are intended to recover all or a<br />
significant portion of their costs through user fees and charges (business-type activities). The governmental<br />
activities of the City include general government, public safety, community development, community and<br />
cultural, public works, and interest on long-term debt. The business-type activities of the City include the Electric<br />
Utility.<br />
3
The government-wide financial statements include the City and its component units. The City’s component units<br />
are the Community Redevelopment Agency of the City of <strong>Moreno</strong> <strong>Valley</strong>, <strong>Moreno</strong> <strong>Valley</strong> Community Services<br />
District, <strong>Moreno</strong> <strong>Valley</strong> Public Financing Authority, and the <strong>Moreno</strong> <strong>Valley</strong> Public Facilities Financing<br />
Corporation. Although legally separate, for all practical purposes these entities function as departments of the<br />
City and therefore have been blended as part of the primary government.<br />
Fund financial statements. A fund is a grouping of related accounts that is used to maintain control over<br />
resources that have been segregated for specific activities or objectives. The City, like other state and local<br />
governments, uses fund accounting to ensure and demonstrate compliance with finance-related legal<br />
requirements. All of the funds of the City can be divided into three categories: governmental, proprietary and<br />
fiduciary.<br />
Governmental funds. Governmental funds are used to account for the same functions reported as governmental<br />
activities in the government-wide financial statements. However, unlike the government-wide financial<br />
statements, government fund financial statements focus on near-term inflows and outflows of spendable resources<br />
as well as on balances of spendable resources available at the end of the fiscal year.<br />
Because the focus of governmental funds is narrower than that of the government-wide financial statements, it is<br />
useful to compare the information presented for governmental funds with similar information presented for<br />
governmental activities in the government-wide financial statements. By doing so, readers may better understand<br />
the long-term impact of the government’s near-term financing decisions. Both the governmental funds balance<br />
sheet and the governmental funds statement of revenues, expenditures and changes in fund balances provide a<br />
reconciliation to facilitate this comparison between governmental funds and governmental activities.<br />
Information regarding governmental funds is presented separately in the governmental funds balance sheet and in<br />
the governmental funds statement of revenues, expenditures and changes in fund balances for the General Fund;<br />
Community Services District Zones, and Development Impact Fees Special Revenue Funds; the Redevelopment<br />
Agency Capital Projects Funds; and the Redevelopment Agency Debt Service Funds. All of these are considered<br />
to be major funds. Data from the other governmental funds are combined into a single, aggregated presentation.<br />
Individual fund data for each of these non-major governmental funds is provided in the supplementary section of<br />
the report in the form of combining statements.<br />
The City adopts an annual appropriated budget for its general fund. A budgetary comparison statement has been<br />
provided to demonstrate compliance with the budget.<br />
Proprietary funds. The City maintains two different types of proprietary funds--enterprise and internal service<br />
funds. Enterprise funds are used to report the same functions presented as business-type activities in the<br />
government-wide financial statements. The City uses an enterprise fund to account for its Electric Utility.<br />
Internal service funds are an accounting device used to accumulate and allocate costs internally among the City’s<br />
various functions. The City uses internal service funds to account for self-insured insurance programs, central<br />
services, technology services, facilities maintenance, equipment maintenance, and equipment replacement.<br />
Because these services predominantly benefit governmental rather than business-type functions, they have been<br />
included within governmental activities in the government-wide financial statements.<br />
Proprietary funds provide the same type of information as the government-wide financial statements, only in more<br />
detail. The Electric Utility, the City’s only enterprise fund, is included in the Basic <strong>Financial</strong> Statements. All<br />
internal service funds are combined into a single, aggregated presentation in the proprietary funds financial<br />
statements. Individual fund data for the internal service funds is provided in the form of combining statements in<br />
the supplementary section of the report.<br />
4
Fiduciary funds. Fiduciary funds are used to account for resources held for the benefit of parties outside the City.<br />
In these cases, the City has a fiduciary responsibility and is acting as trustee. The Statement of Fiduciary Fund<br />
Assets and Liabilities, included in the Basic <strong>Financial</strong> Statements, separately reports all of the City’s fiduciary<br />
activities. Detailed information of the fiduciary funds is in the Agency Funds section. Fiduciary funds are not<br />
reflected in the government-wide financial statements because the resources of those funds are not available to<br />
support the City’s own programs. However, the City is responsible for ensuring that the assets reported in these<br />
funds are used for their intended purposes. The accounting used for fiduciary funds is much like that used for<br />
proprietary funds.<br />
Notes to the financial statements. The notes provide additional information that is essential to a full<br />
understanding of the data provided in the government-wide and fund financial statements.<br />
Government-wide <strong>Financial</strong> Analysis<br />
The following table presents a summarization of the City’s assets, liabilities and net assets for its governmental<br />
and business-type activities as of June 30, 2011.<br />
Governmental<br />
Table 1<br />
Net Assets<br />
(in $000’s)<br />
Business-type<br />
Activities Activities Totals<br />
2010 2011 2010 2011 2010 2011<br />
Current and other assets $ 275,079 $ 265,029 $ 9,566 $ 8,535 $ 284,645 $ 273,564<br />
Capital assets 806,020 829,740 33,529 35,734 839,549 865,474<br />
Total assets 1,081,099 1,094,769 43,095 44,269 1,124,194 1,139,038<br />
Current Liabilities 25,568 32,515 4,196 3,253 29,764 35,768<br />
Long-term liabilities 113,878 113,783 30,095 30,995 143,937 144,778<br />
Total liabilities 139,446 146,298 34,291 34,248 173,701 180,546<br />
Net assets:<br />
Invested in capital assets,<br />
net of related debt<br />
Restricted for<br />
Community development<br />
768,346 784,881 12,202 13,943 780,548 798,824<br />
projects 36,342 7,080 - - 36,342 3,102<br />
Community & cultural 8,369 8,968 - - 8,369 8,968<br />
Public safety 2,103 645 - - 2,103 645<br />
Public works 61,366 109,096 - - 61,366 80,680<br />
Debt service 15,818 12,868 - - 15,818 12,868<br />
Other programs<br />
Permanent funds -<br />
2,546 302 - - 2,546 302<br />
nonexpendable 169 170 - - 169 170<br />
Regulatory contingencies - - 1,158 1,702 1,158 1,702<br />
Unrestricted 46,594 24,461 (4,520) (5,624) 42,074 51,231<br />
Total net assets $ 941,653 $ 948,471 $ 8,840 $ 10,021 $ 950,493 $ 958,492<br />
As noted earlier, net assets may serve over time as a useful indicator of a government’s financial position. In the<br />
case of the City of <strong>Moreno</strong> <strong>Valley</strong>, assets exceeded liabilities by $958.5 million at June 30, 2011.<br />
5
By far the largest portion of the City’s net assets (83%) is its investment in capital assets (e.g., land, buildings,<br />
machinery, and equipment) net of related debt. The City uses these capital assets to provide services to citizens;<br />
consequently, these assets are not available for future spending. Although the City’s investment in its capital<br />
assets is reported net of related debt, it should be noted that the resources needed to repay this debt must be<br />
provided from other sources, since the capital assets themselves cannot be used to liquidate these liabilities.<br />
The following table presents a summarization of the changes in net assets of the City’s governmental and<br />
business-type activities, as of June 30, 2011.<br />
Table 2<br />
Changes in Net Assets<br />
(in $000’s)<br />
Governmental Business-type<br />
Activities Activities Total<br />
2010 2011 2010 2011 2010 2011<br />
Revenues:<br />
Program Revenues:<br />
Charges for services $ 25,111 $ 27,310 $ 13,326 $ 15,672 $ 38,437 $ 42,982<br />
Operating contributions and<br />
grants 21,512 20,708 - - 21,512 20,708<br />
Capital contributions and grants 71,923 29,764 - - 71,923 29,764<br />
General Revenues:<br />
Property tax 16,837 22,700 - - 16,837 22,700<br />
Property tax in lieu 13,703 13,056 - - 13,703 13,056<br />
Transient occupancy tax 536 693 - - 536 693<br />
Sales tax 10,983 12,277 - - 10,983 12,277<br />
Franchise tax 4,608 4,888 - - 4,608 4,888<br />
Business license tax 961 1,053 - - 961 1,053<br />
Utility user's tax 15,358 15,317 - - 15,358 15,317<br />
Franchise in lieu tax 133 150 - - 133 150<br />
Documentary transfer tax 479 425 - - 479 425<br />
Other taxes 2,279 1,204 - - 2,279 1,204<br />
Intergovernmental 547 - - - 547 -<br />
Use of money and property 10,850 5,298 61 29 10,911 5,327<br />
Other 1,239 2,785 1,250 180 2,489 2,965<br />
Total Revenues 197,059 157,628 14,637 15,881 211,696 173,509<br />
Expenses:<br />
General government 12,093 13,001 - - 12,093 13,001<br />
Public safety 58,165 59,640 - - 58,165 59,640<br />
Community development 29,664 10,004 - - 29,664 10,004<br />
Community and cultural 22,701 25,047 - - 22,701 25,047<br />
Public works 14,991 34,433 - - 14,991 34,433<br />
Interest on long-term debt 9,126 8,334 - - 9,126 8,334<br />
Electric - - 13,812 14,808 13,812 14,808<br />
Total Expenses 146,740 150,459 13,812 14,808 160,552 165,267<br />
Change in net assets before<br />
transfers 50,319 7,169 825 1,073 51,144 8,242<br />
Transfers 225 (108) (225) 108 - -<br />
Change in Net Assets 50,544 7,061 600 1,181 51,144 8,242<br />
Restatement of Net Assets (4,258) (243) 412 (3,846) (243)<br />
Net Assets Beginning 895,367 941,653 7,828 8,840 903,195 950,493<br />
Net Assets Ending $ 941,653 $ 948,471 $ 8,840 $ 10,021 $ 950,493 $ 958,492<br />
6
Charges for services increased $4.5 million, 11.8%, over FY 2009-10. This increase represents slightly improved<br />
activity within the development services related fees. Development Impact Fees (DIF) nearly doubled to $1.1<br />
million, in addition to smaller increases in many fees supported by development. The Community Services<br />
District Zone B was infused with a $714,000 contribution to maintain streetlight services. User fees related to the<br />
Cities electric utility increased by over $2 million as a result of fee increases and a growing customer base.<br />
Capital contributions and grants decreased $42.2 million, 58.7% under FY 2009-10. This category fluctuates<br />
dramatically each year depending upon the number and value of dedications of developer constructed<br />
infrastructure projects, such as streets, curbs, gutters, street lights, etc. Fiscal Year 2009-10 reflected project<br />
dedications that were completed before the economy slowed considerably, reflecting total project values of $71.9<br />
million. As the economy began declining, the number of active projects dropped sharply, resulting in fewer<br />
developer supported and grant funded infrastructure projects being completed and dedicated, totaling only $29.7<br />
million in FY 2010-11.<br />
Property tax revenue increased $5.9 million, 35.1% over FY 2009-10. The Property Tax collections in FY 2009-<br />
10 were reduced by the Educational Revenue Augmentation Fund (ERAF) payment of $5.3 million required by<br />
the State of California to be reduced from Property Tax Increment of the Redevelopment Agency, accounting for<br />
the majority of the fluctuation.<br />
Use of money and property decreased $5.6 million, 51.4% under FY 2009-10. The primary perceived reduction in<br />
this category is created by an accounting requirement dictated by Government Accounting Standards Board<br />
Statement (GASB) 31 which required the recording of an unrealized investment gain in the FY 2009-10 totals of<br />
$3.7 million. The GASB 31 adjustment in FY 2010-11 was a small increase in investment income. The balance of<br />
the reduction is a result of lower cash balances invested and lower rates of return on investments due to current<br />
market conditions.<br />
Governmental Activities<br />
The government’s net assets increased by $6.8 million, with total revenues of $157.6 million, total expenses of<br />
$150.4 million, transfers out of $0.1 million, and a restatement of previously over-reported net assets of $0.2<br />
million. Program revenues were $77.8 million and general revenues were $79.8 million, funding the net<br />
difference between program revenues and expenses. The largest single category of revenue was capital<br />
contributions and grants at $29.8 million and is also program revenue. This revenue goes directly against<br />
expenses in recovering the costs of providing those services. This revenue category decreased by $42.2 million<br />
over FY 2009-10 primarily due to reduced development activity, resulting in fewer dedications of infrastructure to<br />
the City, as noted above. The second largest single revenue category was charges for services, at $27.3 million.<br />
This is program revenue and goes directly against expenses in recovering the costs of providing those services.<br />
This revenue category increased by $2.2 million from FY 2009-10. The third largest single revenue category was<br />
property taxes at $22.7 million. Operating contributions and grants was the fourth largest single revenue source at<br />
$20.7 million, and utility user’s tax was the fifth largest revenue source at $15.3 million. Graph 1 presents the<br />
revenues by source for governmental activities for the fiscal year ended June 30, 2011.<br />
7
Capital contributions and<br />
grants<br />
20%<br />
Graph 1<br />
Revenues by Source – Governmental Activities<br />
Property Tax<br />
14%<br />
Operating contributions<br />
and grants<br />
13%<br />
Sales Tax<br />
8%<br />
Franchise Fees<br />
3%<br />
Charges for Services<br />
17%<br />
The single largest expense category was public safety at $59.6 million, accounting for 39.6% of total expenses.<br />
Public works was the second largest expense category at $34.4 million and 22.9% of total expenses. Community<br />
and cultural was the third largest expense category at $25.0 million. General government was the fourth largest<br />
expense category at $13.0 million, followed by community development at $10.0 million, the fifth largest expense<br />
category, and interest on long-term debt at $8.3 million, the sixth largest expense category.<br />
Table 3 presents the cost of each of the six major program categories, and identifies each program’s net cost (total<br />
cost less revenues generated by the activities). The net cost is the financial burden that was placed on the City’s<br />
taxpayers by each of the activities.<br />
Table 3<br />
Governmental Activities - Net Cost of Services<br />
For the year ended June 30, 2011<br />
Total Cost of<br />
Services<br />
Utility Users Tax<br />
10%<br />
Other Taxes<br />
1%<br />
Property tax in-lieu<br />
8%<br />
Use of money & property<br />
3%<br />
Transfers and Other<br />
3%<br />
Net Cost of<br />
Services<br />
General government $ 13,001,340 $ (7,052,100)<br />
Public safety 59,640,431 (55,308,408)<br />
Community development 10,003,780 697,549<br />
Community and cultural 25,046,848 (7,174,528)<br />
Public works 34,432,579 4,494,100<br />
Interest on long-term debt 8,333,540 (8,333,540)<br />
TOTAL $ 150,458,518 $ (72,676,927)<br />
8
Millions<br />
As illustrated in the Table 3, program revenues recovered $77.8 million of the cost of providing these services.<br />
The City paid for the remaining public benefit portion of these governmental activities with $72.7 million in taxes<br />
(some of which were restricted for certain programs) and with other revenues. This governmental activity<br />
cost/revenue relationship is further illustrated in the following graph.<br />
$95<br />
$90<br />
$85<br />
$80<br />
$75<br />
$70<br />
$65<br />
$60<br />
$55<br />
$50<br />
$45<br />
$40<br />
$35<br />
$30<br />
$25<br />
$20<br />
$15<br />
$10<br />
$5<br />
$0<br />
General<br />
government<br />
Business-Type Activities<br />
Graph 2<br />
Governmental Activities - Net Cost of Services<br />
For the year ended June 30, 2011<br />
The City’s business-type activities include the activities of the Electric Utility. The net assets of the City’s<br />
business-type activities increased $1.2 million primarily due to the completion of cable and conduit installation on<br />
four street segments. The Electric Utility had total revenues of $15.9 million, total expenses of $14.8 million, and<br />
transfers in of $107,841.<br />
THE CITY’S FUNDS<br />
Total fund balances presented in the governmental funds balance sheet are $166.9 million, with the General Fund<br />
representing $46.4 million, or 27.8% of the total. The City’s General Fund fund balance has unassigned fund<br />
balance of $36.6 million.<br />
General Fund <strong>Financial</strong> Results<br />
Public safety Community<br />
development<br />
Total Cost<br />
Program Revenues<br />
Community and<br />
cultural<br />
Public works Interest on longterm<br />
debt<br />
The General Fund fund balance decreased by $4.9 million over FY 2009-10. The original budget anticipated a<br />
decrease of $12.6 million. The reduced use of fund balance was the result of revenues increasing by $2.9 million<br />
over budget, primarily due to increases in property and sales taxes. Expenses were under budget in Police<br />
Services ($2.7 million) and Fire Services ($0.7 million) primarily as a result of reduced contract service rates.<br />
At fiscal year end, eight General Fund revenues met or exceeded the amended budget, exceeding budget by $5.6<br />
million. Total revenues exceeded budget by $3.5 million. The economic recovery has had a positive effect on<br />
revenue performance to budget. Property taxes were budgeted to decline by 14% and only declined by 4%,<br />
9
esulting in a $2 million positive variance to budget. Similarly, sales taxes were budgeted to be flat compared to<br />
the prior year, while actual revenue growth delivered a $1.5 million increase compared to budget. Other primary<br />
revenue sources also increased, such as Utility Tax, Business License Taxes, Transient Occupancy Taxes and<br />
Franchise fees.<br />
General Fund actual expenditures were $5.6 million less than the final amended budget. Major contributors to<br />
this result were in large part due to Police Services ($2.7 million) and Fire Services ($0.7 million) coming in<br />
under budget primarily as a result of contract service rates coming in below budgeted rates. Fire Services also<br />
reflected an additional $0.5 million savings from the delay in purchasing a fire engine.<br />
The City implemented GASB Statement No. 54 Fund Balance <strong>Report</strong>ing and Governmental Fund Type<br />
Definitions in the Fiscal Year 2010-11. Comparative data for previous years is not retroactively presented in this<br />
analysis.<br />
Other Major Fund <strong>Financial</strong> Results<br />
The fund balance of the Community Service District Zones Special Revenue Fund increased by $1.5 million over<br />
FY 2009-10. This fund accounts for the administration, operations and maintenance of the City’s various service<br />
zones established by the <strong>Moreno</strong> <strong>Valley</strong> Community Services District. The increase in fund balance is primarily<br />
the result of $775,000 in transfers from the General Fund to support Library Services ($450,000) and projects in<br />
Parks and Community Services ($325,000). Parks and Community Services also experienced an increase in fees<br />
collected of $300,000 while managing expenditure decreases of $250,000 from the prior year.<br />
The fund balance of the Development Impact Fees Special Revenue Fund decreased by $2.6 million under FY<br />
2009-10. This fund accounts for the developer impact fees, which are one-time charges, used to offset the<br />
additional public-service costs of new development. The decrease in fund balance is due to fewer fee collections<br />
as a result of the recessionary impact on new development projects. The completion of the Nason Street<br />
Interchange project totaled $1.7 million in expenditures, while remaining project completions totaled $900,000.<br />
The fund balance of the Community Redevelopment Agency Capital Projects Fund decreased by $4.2 million<br />
under FY 2009-10. This fund accounts for the tax increment revenues collected by the Community<br />
Redevelopment Agency and used for administrative expenditures, capital projects with the redevelopment project<br />
area, and low and moderate income housing programs as required by law. The decrease in fund balance is a result<br />
of the completion of two large projects: Day Street improvements totaled $2 million and Indian Street Detention<br />
Basin totaled $2.2 million.<br />
The fund balance of the Community Redevelopment Agency Debt Service Fund increased by $0.3 million over<br />
FY 2009-10. This fund accounts for the tax increment revenues and other resources collected by the Community<br />
Redevelopment Agency for the payment of Agency debt service. The increase in fund balance is the result of an<br />
increase in property tax collections of $160,000 and sales taxes collected of $70,000.<br />
CAPITAL ASSET AND DEBT ADMINISTRATION<br />
Capital Assets<br />
At the end of 2011, the City’s governmental activities had $1.095 billion ($830 million net of depreciation)<br />
invested in a broad range of capital assets, including land, buildings and improvements, machinery and<br />
equipment, vehicles, park facilities, roads, highways and bridges. The increase of $13.7 million over FY 2009-10<br />
is primarily attributed to the increase in infrastructure.<br />
10
At June 30, 2011, the City’s business-type activities had $39.5 million ($35.7 million net of depreciation) invested<br />
in capital assets, primarily utility infrastructure. The increase of $2.9 million over FY 2009-10 is primarily<br />
attributed to the increase in infrastructure. Table 4 presents the City’s capital assets by asset type.<br />
Table 4<br />
Capital Assets at Year End<br />
(Net of Depreciation)<br />
For the Year Ended June 30, 2011<br />
Governmental<br />
Activities<br />
Business-type<br />
Activities<br />
Land $ 308,409,790 $ 1,237,459<br />
Buildings and improvements 74,917,485 -<br />
Machinery and equipment 1,890,494 -<br />
Vehicles 2,263,849 -<br />
Construction in progress 50,309,666 283,653<br />
Infrastructure 391,948,877 34,213,160<br />
Total $ 829,740,161 $ 35,734,272<br />
Additional information on the City’s capital assets can be found in Note 5 to the basic financial statements.<br />
Long-Term Debt<br />
At year-end, the City’s governmental activities had $110.4 million in bonds, certificates of participation, notes<br />
and accrued interest, leases and compensated absences, versus $113.9 million last year, a decrease of $3.5 million,<br />
or 3.1%. The decrease was the result of normal maturity on existing debt.<br />
At June 30, 2011, the City’s business-type activities had $29.5 million in bonds, capital leases and compensated<br />
absences versus $30.1 million last year, a decrease of $0.6 million. The decrease was the result of normal<br />
maturity on existing debt. The City was able to meet its current debt obligations in a timely manner. The City<br />
has an active Debt Management Committee and a City Council-approved Debt Management Policy. Table 5<br />
provides the total long-term debt by category.<br />
Table 5<br />
Outstanding Debt at Year End<br />
For the Year Ended June 30, 2011<br />
Governmental<br />
Activities<br />
Business-type<br />
Activities<br />
Special tax bonds $ 13,655,000 $ -<br />
Certificates of participation 7,615,500 -<br />
Lease revenue bonds 39,660,000 29,495,429<br />
Tax allocation bonds 42,475,000 -<br />
Notes (plus accrued interest) 1,736,067 -<br />
Capital leases - 2,482<br />
Compensated absences 5,214,212 14,284<br />
Total $ 110,355,779 $ 29,512,195<br />
Additional information on the City’s long-term debt can be found in Note 6 to the basic financial statements.<br />
11
ECONOMIC FACTORS AND OUTLOOK FOR FUTURE YEARS<br />
Although the focus of this Annual <strong>Report</strong> is on the economic condition of the City in the fiscal year that ended<br />
June 30, 2011, it is important for the City’s financial management to report on current issues affecting the City<br />
and their economic impact on FY 2010-11 and future years.<br />
Clearly the economic downturn has impacted <strong>Moreno</strong> <strong>Valley</strong>, as well as the Inland Region as a whole. Both<br />
Riverside and San Bernardino counties are experiencing a delayed and slow economic recovery period.<br />
With a population of 195,216, <strong>Moreno</strong> <strong>Valley</strong> is still experiencing population growth, albeit at a slower rate<br />
because of the economic downturn impacting California. <strong>Moreno</strong> <strong>Valley</strong> remains the second largest city in<br />
Riverside County and is presently the fourth largest city in the Inland Region. For the past few years, <strong>Moreno</strong><br />
<strong>Valley</strong> has been consistently ranked by the U.S. Census Bureau as one of the ‘fastest growing cities in the U.S.’—<br />
ranking in the Top 25 of cities with a population over 100,000 for the past four years. Though it has slowed<br />
because of the economy, population growth continues in <strong>Moreno</strong> <strong>Valley</strong> because of its strategic location at the<br />
junction of Interstate I-215 and State Route 60, along with offering a wide array of quality housing options, a<br />
family oriented lifestyle and a variety of quality of life amenities.<br />
New housing development opportunities have long been a mainstay of <strong>Moreno</strong> <strong>Valley</strong>’s growth and economic<br />
foundation. Over the years, the regional economy in the Inland Region of Riverside and San Bernardino counties<br />
has been heavily dependent on construction activity, and specifically, the new residential development industry.<br />
<strong>Moreno</strong> <strong>Valley</strong> was an active area for new home development and this industry peaked in FY 2004-05. <strong>Moreno</strong><br />
<strong>Valley</strong> has not escaped the new housing construction decline that has hit the Inland Region especially hard, and<br />
residential building permit activity decreased 90% in the City for the period from 2005 to 2010.<br />
New housing development will remain dormant for the foreseeable future based on current market conditions.<br />
Once the City’s main economic engine, the current state of foreclosures that will continue to be absorbed during<br />
the next several years, and the general sluggishness of the real estate market will deter new housing growth for the<br />
next several years. The City’s assessed valuation has experienced a similar trend to that of the new housing<br />
development market. According to the Riverside County Assessor, for a six-year period from 2002 to 2008, the<br />
City of <strong>Moreno</strong> <strong>Valley</strong>’s assessed valuation grew an amazing 136% from $5.8 billion in 2002, to $13.7 billion in<br />
2008. With the recession officially starting in fourth quarter of 2007, property assessed valuation decreased in<br />
<strong>Moreno</strong> <strong>Valley</strong> from FY 2008-09 through FY 2010-11 when assessed valuations are projected to be<br />
approximately $10.8 billion. With the conclusion of the Proposition 8 adjustments and a decline in foreclosure<br />
activity, the region is seeing stabilization in assessed valuations. For FY 2011-12 and the following few years, the<br />
regions are expected to see flat to moderate levels of growth in assessed valuations.<br />
For several years <strong>Moreno</strong> <strong>Valley</strong> has experienced substantial non-residential growth including significant new<br />
commercial retail and industrial development. The economy has slowed commercial development in Southern<br />
California, but <strong>Moreno</strong> <strong>Valley</strong> continues to secure new business development opportunities. Although new retail<br />
slowed in FY 2010-11, Buffalo Wild Wings, Panera Bread, Baja Fresh, The Village Restaurant, Moss Bros.<br />
Volkswagen dealership and other retail centers opened during FY 2010-11. Construction is completed and the<br />
facility began operation in the Highland Fairview Business Park beginning with a 1.8 million square foot logistics<br />
center to house Sketchers U.S.A. Inc. in May 2011.<br />
Current economic activity is in the commercial sector, with a specific focus on logistics/distribution centers and<br />
medical support businesses. The City Council approved an Economic Action Plan during FY 2010-11 that<br />
specifically focuses on these market sectors to rebuild the City’s tax revenue base and promote job creation.<br />
Creating employment opportunities and job growth is important to the continued development of the community.<br />
12
While new office and industrial development has slowed because of the economy and challenging financing<br />
market, <strong>Moreno</strong> <strong>Valley</strong> created more than 750 new jobs in FY 2010-11 through several major projects including:<br />
Harbor Freight Tools Logistics Center, Skechers Regional Logistics Center, and many other projects. As the<br />
economy continues to recover, <strong>Moreno</strong> <strong>Valley</strong> is well positioned for future business development opportunities<br />
with nearly 15 million square feet of industrial building projects approved, entitled or under development.<br />
Creating the proper jobs to housing balance is key to <strong>Moreno</strong> <strong>Valley</strong>’s continued economic success as a<br />
community and to the development of the City’s tax revenue base in the future.<br />
CONTACTING THE CITY’S FINANCIAL MANAGEMENT<br />
This financial report is designed to provide our citizens, taxpayers, customers, investors and creditors with a<br />
general overview of the City’s finances and to show the City’s accountability for the money it receives. For<br />
component units that publish separate financial statements, those statements can be obtained from the City Clerk.<br />
Questions concerning any of the information provided in this report or requests for additional financial<br />
information should be addressed to the <strong>Financial</strong> & Administrative Services Director, City of <strong>Moreno</strong> <strong>Valley</strong>,<br />
14177 Frederick Street, P.O. Box 88005, <strong>Moreno</strong> <strong>Valley</strong>, California 92552-0805.<br />
13
Basic <strong>Financial</strong><br />
Statements
City of <strong>Moreno</strong> <strong>Valley</strong><br />
Statement of Net Assets<br />
June 30, 2011<br />
Governmental<br />
Primary Government<br />
Business-Type<br />
Activities Activities Total<br />
Assets:<br />
Pooled cash and investments (note 3)<br />
Receivables:<br />
$ 210,771,403 $ - $ 210,771,403<br />
Accounts 6,791,658 1,892,034 8,683,692<br />
Notes and loans (note 4) 24,497,512<br />
- 24,497,512<br />
Accrued interest 1,907,685<br />
- 1,907,685<br />
Internal balances 1,063,759 (1,063,759)<br />
-<br />
Prepaid costs 45,624<br />
-<br />
45,624<br />
Due from other governments 7,430,256<br />
- 7,430,256<br />
Inventories 8,575<br />
-<br />
8,575<br />
Deferred charges 139,972<br />
-<br />
139,972<br />
Land held for resale<br />
Restricted assets:<br />
3,916,126<br />
- 3,916,126<br />
Cash with fiscal agent (note 3) 8,456,291 7,706,620 16,162,911<br />
Capital assets not being depreciated (note 5) 358,719,456 1,521,112 360,240,568<br />
Capital assets, net of depreciation (note 5) 471,020,705 34,213,160 505,233,865<br />
Total Assets 1,094,769,022 44,269,167<br />
1,139,038,189<br />
Liabilities:<br />
Accounts payable 23,637,798 2,123,953 25,761,751<br />
Accrued liabilities 1,132,158<br />
10,791 1,142,949<br />
Accrued interest 1,275,589<br />
269,580 1,545,169<br />
Unearned revenue 705,940<br />
-<br />
705,940<br />
Deposits payable 105,762<br />
848,200<br />
953,962<br />
Due to other governments<br />
Noncurrent liabilities:<br />
5,657,798<br />
- 5,657,798<br />
Advances from operator - 1,483,104 1,483,104<br />
Long-term debt, due within one year (note 6) 4,437,718<br />
551,766 4,989,484<br />
Long-term debt, due in more than one year (note 6) 109,345,061 28,960,429 138,305,490<br />
Total Liabilities 146,297,824<br />
Net Assets:<br />
Invested in capital assets,<br />
net of related debt<br />
Restricted for:<br />
784,881,452<br />
Community development projects 7,079,640<br />
Public safety 644,786<br />
Community and cultural 8,968,479<br />
Public works 109,095,517<br />
Debt service 12,867,643<br />
Permanent funds - nonexpendable 170,162<br />
Water quality 301,868<br />
Public purpose programs -<br />
Unrestricted 24,461,651<br />
See Notes to <strong>Financial</strong> Statements 15<br />
34,247,823<br />
13,942,981<br />
-<br />
-<br />
-<br />
-<br />
-<br />
-<br />
-<br />
1,702,037<br />
(5,623,674)<br />
180,545,647<br />
798,824,433<br />
7,079,640<br />
644,786<br />
8,968,479<br />
109,095,517<br />
12,867,643<br />
170,162<br />
301,868<br />
1,702,037<br />
18,837,977<br />
Total Net Assets $ 948,471,198 $ 10,021,344 $ 958,492,542
City of <strong>Moreno</strong> <strong>Valley</strong><br />
Statement of Activities<br />
Year Ended June 30, 2011<br />
Program Revenues<br />
Operating Capital<br />
Charges for Contributions Contributions<br />
Expenses Services and Grants and Grants<br />
Functions/Programs<br />
Primary Government:<br />
Governmental Activities:<br />
General government $ 13,001,340 $ 5,008,441 $ 940,799 $<br />
-<br />
Public safety 59,640,431 2,787,962 1,009,290<br />
534,771<br />
Community development 10,003,780 4,911,984 5,769,165<br />
20,180<br />
Community and cultural 25,046,848 11,237,049 6,635,271<br />
-<br />
Public works 34,432,579 3,364,804 6,353,159 29,208,716<br />
Interest on long-term debt 8,333,540<br />
-<br />
-<br />
-<br />
Total Governmental Activities 150,458,518<br />
Business-Type Activities:<br />
Electric 14,807,788<br />
Total Business-Type Activities 14,807,788<br />
27,310,240<br />
15,671,939<br />
15,671,939<br />
20,707,684<br />
-<br />
-<br />
29,763,667<br />
Total Primary Government $ 165,266,306 $ 42,982,179 $ 20,707,684 $ 29,763,667<br />
General Revenues:<br />
Taxes:<br />
Property taxes<br />
Property taxes in lieu<br />
Transient occupancy taxes<br />
Sales taxes<br />
Franchise taxes<br />
Business licenses taxes<br />
Utility users tax<br />
Other taxes<br />
Franchise in lieu taxes<br />
Documentary transfer tax<br />
Use of money and property<br />
Miscellaneous<br />
Gain on sale of capital asset<br />
Transfers (note 7)<br />
Total General Revenues and Transfers<br />
Change in Net Assets<br />
Net Assets at Beginning of Year<br />
Restatement of Net Assets (note 10)<br />
Net Assets at End of Year<br />
See Notes to <strong>Financial</strong> Statements 16<br />
-<br />
-
Net (Expenses) Revenues and Changes in Net<br />
Assets<br />
Primary Government<br />
Governmental Business-Type<br />
Activities Activities Total<br />
$ (7,052,100) $ - $ (7,052,100)<br />
(55,308,408)<br />
- (55,308,408)<br />
697,549<br />
-<br />
697,549<br />
(7,174,528)<br />
- (7,174,528)<br />
4,494,100<br />
- 4,494,100<br />
(8,333,540)<br />
- (8,333,540)<br />
(72,676,927)<br />
-<br />
-<br />
(72,676,927)<br />
22,699,683<br />
13,055,796<br />
692,586<br />
12,277,450<br />
4,888,143<br />
1,053,146<br />
15,317,439<br />
1,204,064<br />
150,456<br />
424,931<br />
5,298,098<br />
2,784,308<br />
605<br />
(107,841)<br />
79,738,864<br />
7,061,937<br />
941,652,520<br />
(243,259)<br />
-<br />
864,151<br />
864,151<br />
864,151<br />
-<br />
-<br />
-<br />
-<br />
-<br />
-<br />
-<br />
-<br />
-<br />
-<br />
29,540<br />
179,892<br />
-<br />
107,841<br />
317,273<br />
1,181,424<br />
8,839,920<br />
-<br />
(72,676,927)<br />
864,151<br />
864,151<br />
(71,812,776)<br />
22,699,683<br />
13,055,796<br />
692,586<br />
12,277,450<br />
4,888,143<br />
1,053,146<br />
15,317,439<br />
1,204,064<br />
150,456<br />
424,931<br />
5,327,638<br />
2,964,200<br />
605<br />
-<br />
80,056,137<br />
8,243,361<br />
950,492,440<br />
(243,259)<br />
$ 948,471,198 $ 10,021,344 $ 958,492,542<br />
See Notes to <strong>Financial</strong> Statements 17
General Fund<br />
MAJOR GOVERNMENTAL FUNDS<br />
This fund is used to account for all financial resources of the city traditionally associated with government<br />
which are not required legally or by sound financial management to be accounted for in another fund. This<br />
fund now includes the accounting for operations and fire prevention functions.<br />
Community Services District (CSD) Zones Special Revenue Fund<br />
This group of funds is used to account for the revenues expended on the various Community Services<br />
District (CSD) programs. There are nine Zones within the Community Services District providing services.<br />
Zone A-Parks and Recreation provides citywide park maintenance and recreation programming. Zone B-<br />
Residential Street Lighting provides residential subdivision street lighting. Zone C-Arterial Street Lighting<br />
provides citywide street lighting on major arterial streets. Zone D-Standard Landscaping provides<br />
landscaping for residential developments throughout the City. Zone E-Extensive Landscaping provides<br />
landscaping in major developments within the City. Zone L-Library Services provides library services to City<br />
residents. Zone M-Medians provides development and maintenance of median within the City. Community<br />
Facilities District (CFD) #1 provides maintenance of new neighborhood parks, trails and class 1 bikeways.<br />
Zone S – Sunnymead Boulevard Maintenance provides orderly development and maintenance of extensive<br />
landscape services for certain improvements constructed by the City and the RDA on Sunnymead<br />
Boulevard.<br />
Development Impact Fees Special Revenue Fund<br />
This group of funds is used to account for the restricted fees collected to provide funding for capital<br />
improvements related to the impact of development on various City services. The City collects fees for the<br />
following: arterial streets, traffic signals, fire facilities, police facilities, parkland facilities, Quimby in-lieu of<br />
parks, recreation facilities, library facilities, city hall facilities, corporate yard facilities, interchange<br />
improvements, maintenance equipment, and animal shelter facilities.<br />
Community Redevelopment Agency Capital Projects Fund<br />
This fund is used to account for the tax increment revenues collected by the Community Redevelopment<br />
Agency and used for administrative expenditures, capital projects within the redevelopment project area, and<br />
low and moderate income housing programs as required by law.<br />
Community Redevelopment Agency Debt Service Fund<br />
This fund is used to account for the tax increment revenues and other resources collected by the Community<br />
Redevelopment Agency for the payment of Agency debt service.<br />
Nonmajor Governmental Funds<br />
These funds constitute all other governmental funds that do not meet the criteria to be a major fund, which is<br />
10% or more of assets, liabilities, revenues or expenditures for the governmental funds and 5% or more of<br />
total assets, liabilities, revenues or expenditures for the total governmental and enterprise funds combined.<br />
These funds include other Special Revenue Funds, other Capital Projects Funds, all Debt Service Funds and<br />
all Permanent Funds of the City.<br />
19
City of <strong>Moreno</strong> <strong>Valley</strong><br />
Balance Sheet<br />
Governmental Funds<br />
June 30, 2011<br />
Special Revenue Funds<br />
Capital Projects<br />
Fund<br />
Community<br />
Redevelopment<br />
Development Agency Capital<br />
General CSD Zones Impact Fees Projects<br />
Assets:<br />
Pooled cash and investments (note 3)<br />
Receivables:<br />
$ 43,017,864 $ 12,652,018 $ 19,432,516 $ 40,990,782<br />
Accounts 4,309,476<br />
235,015<br />
-<br />
48,685<br />
Notes and loans (note 4) -<br />
-<br />
- 20,519,937<br />
Interest 1,207,259<br />
-<br />
-<br />
471,543<br />
Prepaid costs 12,060<br />
-<br />
-<br />
-<br />
Due from other governments 2,930,165<br />
384,902<br />
-<br />
-<br />
Due from other funds (note 7) 6,729,900<br />
-<br />
-<br />
-<br />
Advances to other funds (note 7) 34,272,786<br />
-<br />
- 3,386,697<br />
Land held for resale<br />
Restricted assets:<br />
-<br />
-<br />
- 3,916,126<br />
Cash with fiscal agents (note 3) -<br />
-<br />
-<br />
-<br />
Total Assets $ 92,479,510 $ 13,271,935 $ 19,432,516 $ 69,333,770<br />
Liabilities and Fund Balances:<br />
Liabilities:<br />
Accounts payable $ 16,203,594 $ 508,655 $ - $ 1,777,712<br />
Accrued liabilities 775,946<br />
114,960<br />
-<br />
24,654<br />
Deferred revenues 28,833,723<br />
5,109<br />
-<br />
471,543<br />
Unearned revenues 290,072<br />
203,555<br />
-<br />
-<br />
Deposits payable -<br />
105,762<br />
-<br />
-<br />
Due Due to other governments governments 10,656 10,656<br />
5<br />
- -<br />
Due to other funds (note 7) - 3,305,681<br />
-<br />
-<br />
Advances from other funds (note 7) -<br />
51,700<br />
-<br />
-<br />
Total Liabilities 46,113,991<br />
Fund Balances:<br />
Nonspendable:<br />
Prepaid costs 12,060<br />
Land held for resale -<br />
Notes and loans -<br />
Advances to other funds 5,703,948<br />
Permanent fund principal<br />
Restricted for:<br />
-<br />
Community development projects -<br />
Public safety -<br />
Community and cultural -<br />
Public works -<br />
Capital Projects -<br />
Debt service -<br />
Water quality<br />
Committed to:<br />
-<br />
Revolving line of credit 2,600,000<br />
Scholarship program<br />
Assigned to:<br />
-<br />
Capital Projects -<br />
Continuing appropriations 68,700<br />
GASB 31 346,160<br />
Future debt service 1,000,000<br />
Unassigned 36,634,651<br />
4,295,427<br />
-<br />
-<br />
-<br />
-<br />
-<br />
-<br />
-<br />
8,963,187<br />
-<br />
-<br />
-<br />
-<br />
-<br />
13,321<br />
-<br />
-<br />
-<br />
-<br />
-<br />
-<br />
-<br />
-<br />
-<br />
-<br />
-<br />
-<br />
-<br />
-<br />
19,432,516<br />
-<br />
-<br />
-<br />
-<br />
-<br />
-<br />
-<br />
-<br />
-<br />
-<br />
2,273,909<br />
-<br />
3,916,126<br />
20,519,937<br />
3,386,697<br />
-<br />
-<br />
-<br />
-<br />
-<br />
39,237,101<br />
-<br />
-<br />
Total Fund Balances 46,365,519 8,976,508 19,432,516 67,059,861<br />
Total Liabilities and Fund Balances $ 92,479,510 $ 13,271,935 $ 19,432,516 $ 69,333,770<br />
See Notes to <strong>Financial</strong> Statements 20<br />
-<br />
-<br />
-<br />
-<br />
-<br />
-<br />
-
Debt Service<br />
Fund<br />
Community<br />
Redevelopment<br />
Agency Debt<br />
Service<br />
Nonmajor Total<br />
Governmental Governmental<br />
Funds Funds<br />
$ 10,072,317 $ 48,407,839 $ 174,573,336<br />
Assets:<br />
Pooled cash and investments (note 3)<br />
Receivables:<br />
-<br />
2,197,148<br />
6,790,324 Accounts<br />
-<br />
3,977,575 24,497,512 Notes and loans (note 4)<br />
-<br />
228,883<br />
1,907,685 Accrued interest<br />
-<br />
12,058<br />
24,118 Prepaid costs<br />
529<br />
4,114,660<br />
7,430,256 Due from other governments<br />
-<br />
-<br />
6,729,900 Due from other funds (note 7)<br />
189,000<br />
580,657 38,429,140 Advances to other funds (note 7)<br />
-<br />
-<br />
3,916,126 Land held for resale<br />
Restricted assets:<br />
-<br />
8,456,291<br />
8,456,291 Cash with fiscal agents (note 3)<br />
$ 10,261,846 $ 67,975,111 $ 272,754,688<br />
Total Assets<br />
$ - $ 4,976,931 $ 23,466,892<br />
Liabilities and Fund Balances:<br />
Liabilities:<br />
Accounts payable<br />
-<br />
167,283<br />
1,082,843 Accrued liabilities<br />
9,000<br />
1,428,074 30,747,449 Deferred revenues<br />
-<br />
212,313<br />
705,940 Unearned revenues<br />
-<br />
-<br />
105,762 Deposits payable<br />
5,639,404<br />
7,733<br />
5,657,798 Due to other other governments<br />
9,378<br />
3,120,739<br />
6,435,798 Due to other funds (note 7)<br />
37,607,783<br />
- 37,659,483 Advances from other funds (note 7)<br />
43,265,565<br />
-<br />
-<br />
-<br />
189,000<br />
-<br />
-<br />
-<br />
-<br />
-<br />
-<br />
-<br />
-<br />
-<br />
-<br />
-<br />
-<br />
-<br />
-<br />
(33,192,719)<br />
9,913,073<br />
12,058<br />
-<br />
3,977,575<br />
580,657<br />
170,162<br />
3,102,065<br />
644,786<br />
5,292<br />
13,679,219<br />
8,331,206<br />
12,867,643<br />
301,868<br />
-<br />
-<br />
15,151,482<br />
-<br />
-<br />
-<br />
(761,975)<br />
105,861,965<br />
24,118<br />
3,916,126<br />
24,497,512<br />
9,860,302<br />
170,162<br />
3,102,065<br />
644,786<br />
8,968,479<br />
33,111,735<br />
47,568,307<br />
12,867,643<br />
301,868<br />
2,600,000<br />
13,321<br />
15,151,482<br />
68,700<br />
346,160<br />
1,000,000<br />
2,679,957<br />
Total Liabilities<br />
Fund Balances:<br />
Nonspendable:<br />
Prepaid costs<br />
Land held for resale<br />
Notes and loans<br />
Advances to other funds<br />
Permanent fund principal<br />
Restricted for:<br />
Community development projects<br />
Public safety<br />
Community and cultural<br />
Public works<br />
Capital Projects<br />
Debt service<br />
Water quality<br />
Committed to:<br />
Revolving line of credit<br />
Scholarship program<br />
Assigned to:<br />
Capital Projects<br />
Continuing appropriations<br />
GASB 31<br />
Future debt service<br />
Unassigned<br />
(33,003,719) 58,062,038 166,892,723<br />
Total Fund Balances<br />
$ 10,261,846 $ 67,975,111 $ 272,754,688<br />
Total Liabilities and Fund Balances<br />
See Notes to <strong>Financial</strong> Statements 21
City of <strong>Moreno</strong> <strong>Valley</strong><br />
Reconciliation of the Balance Sheet of Governmental Funds<br />
To the Statement of Net Assets<br />
June 30, 2011<br />
Fund balances of governmental funds $ 166,892,723<br />
Amounts reported for governmental activities in the statement of net assets are<br />
different because:<br />
Capital assets net of depreciation have not been included as financial resources<br />
in governmental fund activity.<br />
Capital Assets (excludes internal service capital assets) 1,112,386,944<br />
Accumulated depreciation (excludes internal service accumulated depreciation (290,848,431)<br />
Bond issuance cost is an expenditure in the governmental funds, but it is<br />
a deferred charge in the statement of net assets. 139,972<br />
Long-term debt and compensated absences<br />
that have not been included in the governmental fund activity:<br />
2007 Towngate Special Tax Refunding Bonds $ (8,860,000)<br />
2007 Towngate Improvement Tax Refunding (3,470,000)<br />
Auto Mall Special Tax Bonds<br />
2011 Private Placement Refunding, Series 1997<br />
(1,325,000)<br />
Variable Rate Certificates of Participation (4,343,500)<br />
Lease Revenue Bonds, 2005<br />
2011 Private Placement Refunding, Series 1997<br />
(39,660,000)<br />
Variable Rate Certificates of Participation (3,272,000)<br />
Notes Payable, Price Company (1,736,067)<br />
RDA-2007 Tax Allocation Bonds Series A (42,475,000)<br />
(105,141,567)<br />
Compensated Absences (4,686,168)<br />
Accrued interest payable for the current portion of interest due on<br />
Bonds has not been reported in the governmental funds. (1,275,589)<br />
Revenues reported as deferred revenue in the governmental funds and recognized<br />
in the Statement of Activities. These are included in the intergovernmental revenues<br />
in the governmental fund activity. 30,747,449<br />
Internal service funds are used by management to charge the costs of certain<br />
activities, such as equipment management and self-insurance, to individual funds.<br />
The assets and liabilities of the internal service funds must be added to the<br />
statement of net assets. 40,255,865<br />
Net assets of governmental activities $ 948,471,198<br />
See Notes to <strong>Financial</strong> Statements 23
City of <strong>Moreno</strong> <strong>Valley</strong><br />
Statement of Revenues,<br />
Expenditures and Changes in Fund Balances<br />
Governmental Funds<br />
Year Ended June 30, 2011<br />
General CSD Zones<br />
Revenues:<br />
Taxes:<br />
Property taxes $ 9,430,846 3,237,015<br />
Property taxes in lieu 13,055,796<br />
-<br />
Utility taxes 15,317,439<br />
-<br />
Sales taxes 11,283,435<br />
-<br />
Other taxes 7,209,262 1,013,881<br />
Licenses and permits 1,532,514<br />
-<br />
Intergovernmental 895,366<br />
74,097<br />
Charges for services 7,408,607 11,171,945<br />
Use of money and property 3,886,420<br />
614,940<br />
Fines and forfeitures 791,497<br />
42,302<br />
Miscellaneous 682,959<br />
63,102<br />
Total Revenues 71,494,141<br />
Capital Projects<br />
Fund<br />
Community<br />
Redevelopment<br />
Agency Capital<br />
Projects<br />
$ $ - $ 3,522,959<br />
-<br />
-<br />
-<br />
-<br />
-<br />
-<br />
-<br />
-<br />
-<br />
-<br />
-<br />
-<br />
1,137,877<br />
-<br />
412,081<br />
838,385<br />
-<br />
-<br />
-<br />
159,106<br />
16,217,282<br />
Expenditures:<br />
Current:<br />
General government 9,592,027<br />
-<br />
Public safety 57,288,473<br />
-<br />
Community development 4,235,300<br />
-<br />
Community and cultural - 16 16,293,348 293 348<br />
Public works 3,413,488<br />
-<br />
Capital outlay<br />
Debt service:<br />
56,406<br />
18,247<br />
Principal retirement -<br />
-<br />
Interest and fiscal charges -<br />
-<br />
Total Expenditures 74,585,694<br />
Excess (Deficiency) of Revenues<br />
Over (Under) Expenditures (3,091,553)<br />
Other Financing Sources (Uses):<br />
Transfers in (note 7) 773,051<br />
Transfers out (note 7) (2,605,518)<br />
Refunding bonds issued -<br />
Refunding bonds issuance cost -<br />
Total Other Financing Sources<br />
(Uses) (1,832,467)<br />
Net Change in Fund Balances (4,924,020)<br />
Fund Balances, Beginning of Year, as<br />
previously reported 51,289,539<br />
Restatements (note 10) -<br />
Fund Balances, Beginning of Year, as restated 51,289,539<br />
Special Revenue Funds<br />
16,311,595<br />
(94,313)<br />
1,587,244<br />
-<br />
-<br />
-<br />
1,587,244<br />
1,492,931<br />
7,483,577<br />
-<br />
7,483,577<br />
Development<br />
Impact Fees<br />
1,549,958<br />
-<br />
-<br />
-<br />
-<br />
-<br />
-<br />
-<br />
-<br />
-<br />
1,549,958<br />
-<br />
(4,084,493)<br />
-<br />
-<br />
(4,084,493)<br />
(2,534,535)<br />
21,967,051<br />
-<br />
21,967,051<br />
4,520,450<br />
1,244,090<br />
-<br />
8,119,944<br />
-<br />
-<br />
-<br />
-<br />
-<br />
9,364,034<br />
(4,843,584)<br />
595,863<br />
-<br />
-<br />
-<br />
595,863<br />
(4,247,721)<br />
71,307,582<br />
-<br />
71,307,582<br />
Fund Balances, End of Year $ 46,365,519 $ 8,976,508 $ 19,432,516 $ 67,059,861<br />
See Notes to <strong>Financial</strong> Statements 24
Debt Service<br />
Fund<br />
Community<br />
Redevelopment Nonmajor Total<br />
Agency Debt Governmental Governmental<br />
Service<br />
Funds Funds<br />
$ 6,500,538 $ 8,325 $ 22,699,683<br />
Revenues:<br />
Taxes:<br />
Property taxes<br />
-<br />
- 13,055,796 Property taxes in lieu<br />
-<br />
- 15,317,439 Utility taxes<br />
994,015<br />
- 12,277,450 Sales taxes<br />
-<br />
190,183<br />
8,413,326 Other taxes<br />
-<br />
-<br />
1,532,514 Licenses and permits<br />
1,090,264 25,531,615 27,591,342 Intergovernmental<br />
- 1,779,260 21,497,689 Charges for services<br />
511,926<br />
763,445<br />
7,027,197 Use of money and property<br />
-<br />
-<br />
833,799 Fines and forfeitures<br />
2,686,000<br />
660,410<br />
4,251,577 Miscellaneous<br />
11,782,743<br />
28,933,238<br />
134,497,812<br />
Total Revenues<br />
3,163,638<br />
505,026 14,504,781<br />
Expenditures:<br />
Current:<br />
General government<br />
-<br />
863,652 58,152,125 Public safety<br />
- 4,825,884 17,181,128 Community development<br />
- 66,712,713 712 713 23 23,006,061 006 061 Community and cultural<br />
- 11,604,583 15,018,071 Public works<br />
- 15,685,059 15,759,712 Capital outlay<br />
Debt service:<br />
417,581 11,306,440 11,724,021 Principal retirement<br />
4,988,816 3,356,268<br />
8,345,084 Interest and fiscal charges<br />
8,570,035<br />
3,212,708<br />
-<br />
(2,881,220)<br />
-<br />
-<br />
(2,881,220)<br />
331,488<br />
(33,335,207)<br />
-<br />
(33,335,207)<br />
54,859,625<br />
(25,926,387)<br />
16,038,077<br />
(9,441,025)<br />
7,615,500<br />
(167,736)<br />
14,044,816<br />
(11,881,571)<br />
70,186,868<br />
(243,259)<br />
69,943,609<br />
163,690,983<br />
(29,193,171)<br />
18,994,235<br />
(19,012,256)<br />
7,615,500<br />
(167,736)<br />
7,429,743<br />
(21,763,428)<br />
188,899,410<br />
(243,259)<br />
188,656,151<br />
Total Expenditures<br />
Excess (Deficiency) of Revenues<br />
Over (Under) Expenditures<br />
Other Financing Sources (Uses):<br />
Transfers in (note 7)<br />
Transfers out (note 7)<br />
Refunding bonds issued<br />
Refunding bonds issuance cost<br />
Total Other Financing Sources<br />
(Uses)<br />
Net Change in Fund Balances<br />
Fund Balances, Beginning of Year, as<br />
previously reported<br />
Restatements (note 10)<br />
Fund Balances, Beginning of Year, as restated<br />
$ (33,003,719) $ 58,062,038 $ 166,892,723 Fund Balances, End of Year<br />
See Notes to <strong>Financial</strong> Statements 25
City of <strong>Moreno</strong> <strong>Valley</strong><br />
Reconciliation of the Statement of Revenues, Expenditures,<br />
and Changes in Fund Balances of Governmental Funds<br />
to the Statement of Activities<br />
Year Ended June 30, 2011<br />
Net change in fund balances - total governmental funds $ (21,763,428)<br />
Amounts reported for governmental activities in the statement of activities are<br />
different because:<br />
Governmental funds report capital outlays as expenditures. However, in the statement<br />
of activities, the costs of those assets is allocated over their estimated useful lives<br />
as depreciation expense. This is the amount by which capital outlays exceeded<br />
depreciation in the current period.<br />
Capital outlay (excludes internal service capital outlay) 23,176,969<br />
Depreciation Expense (excludes internal service depreciation) (23,326,178)<br />
Contributed capital assets are not reported in governmental funds. However,<br />
in the statement of activities, the value of these assets are recorded as capital contributions. 24,414,000<br />
The issuance of long-term debt provides current financial resources in the governmental<br />
funds, but issuing debt increases the long-term liabilities in the statement of net assets.<br />
Repayment of principal is an expenditure in the governmental funds, but the repayment<br />
reduces long-term liabilities in the statement of net assets.<br />
Bonds issued (7,615,500)<br />
Principal payments 11,724,021<br />
Debt issuance costs are expenditures in governmental funds, but these costs<br />
are capitalized on the statement of net assets.<br />
Issuance costs on refunding bonds issued 167,736<br />
Amortization of refunding bond issuance costs (27,764)<br />
Accrued interest for long-term liabilities. This is the net change in accrued interest<br />
for the current period. 39,308<br />
Compensated absences expenses reported in the statement of activities do not<br />
require the use of current financial resources and, therefore, are not reported as<br />
expenditures in governmental funds. (606,972)<br />
Revenues reported as deferred revenue in the governmental funds and recognized<br />
in the Statement of Activities. These are included in the intergovernmental revenues<br />
in the governmental fund activity. (1,284,121)<br />
Internal service funds are used by management to charge the costs of certain<br />
activities, such as equipment management and self-insurance, to individual funds.<br />
The net revenues (expenses) of the internal service funds is reported with<br />
governmental activities. 2,163,866<br />
Change in net assets of governmental activities $ 7,061,937<br />
See Notes to <strong>Financial</strong> Statements 26
Revenues:<br />
Taxes:<br />
City of <strong>Moreno</strong> <strong>Valley</strong><br />
Budgetary Comparison Statement<br />
General Fund<br />
Year Ended June 30, 2011<br />
Variance with<br />
Final Budget<br />
Budget Amounts Actual Positive<br />
Original Final Amounts (Negative)<br />
Property taxes $ 8,596,100 $ 8,596,100 $ 9,430,846 $ 834,746<br />
Property taxes in-lieu 11,773,400 11,773,400 13,055,796 1,282,396<br />
Sales taxes 9,735,100 9,735,100 11,283,435 1,548,335<br />
Utility user's tax 15,200,000 15,200,000 15,317,439 117,439<br />
Other taxes 6,556,500 6,556,500 7,209,262 652,762<br />
Licenses and permits 1,500,600 1,500,600 1,532,514<br />
31,914<br />
Intergovernmental 360,000 360,000 895,366 535,366<br />
Charges for services 8,439,000 8,442,656 7,408,607 (1,034,049)<br />
Use of money and property 4,527,900 4,532,300 3,886,420 (645,880)<br />
Fines and forfeitures 1,176,500 1,176,500 791,497 (385,003)<br />
Miscellaneous 105,300 105,300 682,959 577,659<br />
Total Revenues: 67,970,400 67,978,456 71,494,141 3,515,685<br />
Expenditures:<br />
Current:<br />
General government<br />
City council 579,922<br />
City manager 850,396<br />
City clerk 521,486<br />
City attorney 1,015,407<br />
Economic development 436,287<br />
<strong>Financial</strong> and administrative services 2,676,900<br />
Human resources 958,505<br />
Non-departmental 3,640,525<br />
Public safety<br />
Police 41,291,771<br />
Fire 15,666,535<br />
Animal services 2,269,940<br />
Emergency operations/volunteer services 605,166<br />
Crossing guards 583,439<br />
Community development 4,544,070<br />
Public works 3,528,195<br />
Capital outlay 130,100<br />
Total Expenditures 79,298,644<br />
Excess (Deficiency) of Revenues<br />
Over (Under) Expenditures (11,328,244)<br />
Other Financing Sources (Uses):<br />
Transfers in (note 7) 263,000<br />
Transfers out (note 7) (1,582,740)<br />
Total Other Financing Sources (Uses) (1,319,740)<br />
Net Change in Fund Balances (12,647,984)<br />
Fund Balance, Beginning of Year 51,289,539<br />
581,564<br />
896,175<br />
521,486<br />
1,090,407<br />
482,774<br />
2,696,813<br />
958,505<br />
3,517,071<br />
41,870,739<br />
15,466,535<br />
2,280,118<br />
609,566<br />
583,439<br />
4,545,270<br />
3,528,195<br />
555,556<br />
80,184,213<br />
(12,205,757)<br />
263,000<br />
(2,513,040)<br />
(2,250,040)<br />
(14,455,797)<br />
51,289,539<br />
513,868<br />
726,440<br />
507,398<br />
1,034,442<br />
391,451<br />
2,694,398<br />
923,964<br />
2,800,066<br />
39,104,174<br />
14,793,909<br />
2,214,243<br />
610,084<br />
566,063<br />
4,235,300<br />
3,413,488<br />
56,406<br />
74,585,694<br />
(3,091,553)<br />
773,051<br />
(2,605,518)<br />
(1,832,467)<br />
(4,924,020)<br />
51,289,539<br />
67,696<br />
169,735<br />
14,088<br />
55,965<br />
91,323<br />
2,415<br />
34,541<br />
717,005<br />
2,766,565<br />
672,626<br />
65,875<br />
(518)<br />
17,376<br />
309,970<br />
114,707<br />
499,150<br />
5,598,519<br />
9,114,204<br />
510,051<br />
(92,478)<br />
417,573<br />
9,531,777<br />
Fund Balance, End of Year $ 38,641,555 $ 36,833,742 $ 46,365,519 $ 9,531,777<br />
See Notes to <strong>Financial</strong> Statements 27<br />
-
Revenues:<br />
Taxes:<br />
City of <strong>Moreno</strong> <strong>Valley</strong><br />
Budgetary Comparison Statement<br />
CSD Zones<br />
Year Ended June 30, 2011<br />
Variance with<br />
Final Budget<br />
Budget Amounts Actual Positive<br />
Original Final Amounts (Negative)<br />
Property taxes $ 3,043,389 $ 3,103,389 $ 3,237,015 $ 133,626<br />
Other taxes 967,800 967,800 1,013,881<br />
46,081<br />
Intergovernmental 27,000 27,000 74,097<br />
47,097<br />
Charges for services 10,784,300 10,762,805 11,171,945 409,140<br />
Use of money and property 552,200 553,200 614,940<br />
61,740<br />
Fines and forfeitures 56,500 56,500 42,302 (14,198)<br />
Miscellaneous 80,300 101,353 63,102 (38,251)<br />
Total Revenues 15,511,489 15,572,047 16,217,282 645,235<br />
Expenditures:<br />
Current:<br />
Community and cultural 17,652,076<br />
Capital outlay 123,400<br />
Total Expenditures 17,775,476<br />
Excess (Deficiency) of Revenues<br />
Over (Under) Expenditures (2,263,987)<br />
Other Financing Sources (Uses):<br />
Transfers in (note 7) 865,245<br />
Transfers out (note 7) (51,800)<br />
Total Other Financing Sources (Uses) 813,445<br />
Net Change in Fund Balances (1,450,542)<br />
Fund Balance, Beginning of Year 7,483,577<br />
17,705,106<br />
189,850<br />
17,894,956<br />
(2,322,909)<br />
1,463,240<br />
-<br />
1,463,240<br />
(859,669)<br />
7,483,577<br />
16,293,348<br />
18,247<br />
16,311,595<br />
(94,313)<br />
1,587,244<br />
-<br />
1,587,244<br />
1,492,931<br />
7,483,577<br />
1,411,758<br />
171,603<br />
1,583,361<br />
2,228,596<br />
124,004<br />
-<br />
124,004<br />
2,352,600<br />
Fund Balance, End of Year $ 6,033,035 $ 6,623,908 $ 8,976,508 $ 2,352,600<br />
See Notes to <strong>Financial</strong> Statements 28<br />
-
City of <strong>Moreno</strong> <strong>Valley</strong><br />
Budgetary Comparison Statement<br />
Development Impact Fees<br />
Year Ended June 30, 2011<br />
Budget Amounts Actual<br />
Variance with<br />
Final Budget<br />
Positive<br />
Original Final Amounts (Negative)<br />
Revenues:<br />
Charges for services $ 412,800 $ 412,800 $ 1,137,877 $ 725,077<br />
Use of money and property 197,800 197,800 412,081 214,281<br />
Total Revenues 610,600 610,600 1,549,958 939,358<br />
Excess (Deficiency) of Revenues<br />
Over (Under) Expenditures 610,600<br />
Other Financing Sources (Uses):<br />
Transfers out (note 7) (4,084,493)<br />
Total Other Financing Sources (Uses) (4,084,493)<br />
Net Change in Fund Balances (3,473,893)<br />
Fund Balance, Beginning of Year 21,967,051<br />
610,600<br />
(4,084,493)<br />
(4,084,493)<br />
(3,473,893)<br />
21,967,051<br />
1,549,958<br />
(4,084,493)<br />
(4,084,493)<br />
(2,534,535)<br />
21,967,051<br />
939,358<br />
-<br />
-<br />
939,358<br />
Fund Balance, End of Year $ 18,493,158 $ 18,493,158 $ 19,432,516 $ 939,358<br />
See Notes to <strong>Financial</strong> Statements 29<br />
-
ENTERPRISE FUND:<br />
Electric Fund<br />
PROPRIETARY FUNDS<br />
This fund is used to account for the operations of the City electric utility, with its basic purpose to<br />
purchase and distribute electricity to customers in the City’s newly developed areas under the<br />
“Greenfield” concept. The City began serving its first customers in February 2004.<br />
INTERNAL SERVICE FUNDS:<br />
Internal Service Funds<br />
These funds are used to account for services provided to other departments on a cost<br />
reimbursement basis. These services include providing insurance benefits, maintaining and<br />
replacing information systems, facilities maintenance, vehicle and equipment maintenance, and<br />
accumulating cash reserves for equipment replacement.<br />
31
Assets:<br />
Current:<br />
Governmental<br />
Activities-<br />
Internal<br />
Service Funds<br />
Pooled cash and investments (note 3)<br />
Receivables:<br />
$ - $ 36,198,067<br />
Accounts 1,892,034<br />
1,334<br />
Prepaid costs -<br />
21,506<br />
Inventories<br />
Restricted:<br />
-<br />
8,575<br />
Cash with fiscal agent (note 3) 7,706,620<br />
-<br />
Total Current Assets 9,598,654<br />
Noncurrent:<br />
Capital assets - net of accumulated depreciation (note 5) 35,734,272<br />
Total Noncurrent Assets 35,734,272<br />
36,229,482<br />
8,201,648<br />
8,201,648<br />
Total Assets $ 45,332,926 $ 44,431,130<br />
Liabilities and Net Assets:<br />
City of <strong>Moreno</strong> <strong>Valley</strong><br />
Statement of Net Assets<br />
Proprietary Funds<br />
June 30, 2011<br />
Enterprise<br />
Fund - Electric<br />
Liabilities:<br />
Current:<br />
Accounts payable $ 2,123,953 $ 170,906<br />
Accrued liabilities 10,791<br />
49,315<br />
Accrued interest 269,580<br />
-<br />
Deposits payable 848,200<br />
-<br />
Due to other funds (note 7) 294,102<br />
-<br />
Compensated absences (note 6) 14,284<br />
316,826<br />
Self-insurance payable (note 13) -<br />
910,000<br />
Bonds, notes, and loans payable (note 6) 537,482<br />
-<br />
Total Current Liabilities 4,098,392<br />
Noncurrent:<br />
Advances from other funds (note 7) 769,657<br />
Advances from operator 1,483,104<br />
Compensated absences (note 6) -<br />
Self-insurance payable (note 13) -<br />
Bonds, notes, and loans payable (note 6) 28,960,429<br />
Total Noncurrent Liabilities 31,213,190<br />
Total Liabilities 35,311,582<br />
Net Assets:<br />
Invested in capital assets, net of related debt 13,942,981<br />
Restricted for public purpose programs 1,702,037<br />
Unrestricted (5,623,674)<br />
Total Net Assets 10,021,344<br />
1,447,047<br />
-<br />
-<br />
211,218<br />
2,517,000<br />
-<br />
2,728,218<br />
4,175,265<br />
8,201,648<br />
-<br />
32,054,217<br />
40,255,865<br />
Total Liabilities and Net Assets $ 45,332,926 $ 44,431,130<br />
See Notes to <strong>Financial</strong> Statements 32
Total Operating Revenues 15,672,680<br />
Operating Expenses:<br />
Cost of services -<br />
Depreciation expense 690,851<br />
Electricity purchased 7,733,304<br />
Services and supplies 2,663,528<br />
Distribution share 2,061,010<br />
Self-insurance claims and charges -<br />
Total Operating Expenses 13,148,693<br />
Operating Income (Loss) 2,523,987<br />
Nonoperating Revenues (Expenses):<br />
Interest revenue 29,540<br />
Interest expense (1,659,095)<br />
Litigation settlement 42,710<br />
Engineering plan check fees 136,441<br />
Gain (loss) on disposal of capital assets -<br />
Total Nonoperating<br />
Revenues (Expenses) (1,450,404)<br />
Income (Loss) Before Transfers 1,073,583<br />
Transfers in (note 7) 107,841<br />
Transfers out (note 7) -<br />
Changes in Net Assets 1,181,424<br />
Net Assets:<br />
City of <strong>Moreno</strong> <strong>Valley</strong><br />
Statement of Revenues, Expenses<br />
and Changes in Fund Net Assets<br />
Proprietary Funds<br />
Year Ended June 30, 2011<br />
Enterprise<br />
Governmental<br />
Activities-<br />
Internal<br />
Fund - Electric Service Funds<br />
Operating Revenues:<br />
Sales and service charges $ 15,463,221 $ 10,928,511<br />
Miscellaneous 209,459<br />
22,233<br />
Beginning of Year 8,839,920<br />
10,950,744<br />
6,950,722<br />
764,645<br />
-<br />
-<br />
-<br />
982,296<br />
8,697,663<br />
2,253,081<br />
-<br />
-<br />
-<br />
-<br />
605<br />
605<br />
2,253,686<br />
1,174,505<br />
(1,264,325)<br />
2,163,866<br />
38,091,999<br />
End of Fiscal Year $ 10,021,344 $ 40,255,865<br />
See Notes to <strong>Financial</strong> Statements 33
City of <strong>Moreno</strong> <strong>Valley</strong><br />
Statement of Cash Flows<br />
Proprietary Funds<br />
Year Ended June 30, 2011<br />
Enterprise<br />
Governmental<br />
Activities-Internal<br />
Fund - Electric Service Funds<br />
Cash Flows from Operating Activities:<br />
Cash received from customers $ 14,731,908 $ 10,928,487<br />
Cash paid to suppliers for goods and services (9,467,185)<br />
(4,499,739)<br />
Cash paid for claims -<br />
(1,175,296)<br />
Cash paid to employees for services (2,786,558)<br />
(2,587,239)<br />
Proceeds for litigation settlement 42,710<br />
-<br />
Other operating revenues (expenses) 209,459<br />
22,194<br />
Net Cash Provided (Used) by Operating Activities 2,730,334<br />
Cash Flows from Non-Capital<br />
Financing Activities:<br />
Cash transfers out -<br />
Cash transfers in 107,841<br />
Repayment made to other funds 294,102<br />
Advances received from operator 344,110<br />
Net Cash Provided (Used) by<br />
Non-Capital Financing Activities 746,053<br />
Cash Flows from Capital<br />
and Related Financing Activities:<br />
Acquisition and construction of capital assets (2,896,253)<br />
Engineering plan check fees 136,441<br />
Principal paid on capital debt (527,977)<br />
Interest paid on capital debt (1,663,235)<br />
Advance from other funds (31,500)<br />
Net Cash Provided (Used) by<br />
Capital and Related Financing Activities (4,982,524)<br />
Cash Flows from Investing Activities:<br />
Interest received 29,540<br />
Net Cash Provided (Used) by<br />
Investing Activities 29,540<br />
Net Increase (Decrease) in Cash<br />
and Cash Equivalents (1,476,597)<br />
2,688,407<br />
(1,264,325)<br />
1,174,505<br />
-<br />
-<br />
(89,820)<br />
(219,138)<br />
-<br />
-<br />
-<br />
-<br />
(219,138)<br />
-<br />
-<br />
2,379,449<br />
Cash and Cash Equivalents at Beginning of Year 9,183,217<br />
33,818,618<br />
Cash and Cash Equivalents at End of Year $ 7,706,620 $ 36,198,067<br />
Reconciliation of Operating Income to Net Cash<br />
Provided (Used) by Operating Activities:<br />
Operating income (loss)<br />
Adjustments to reconcile operating income (loss)<br />
net cash provided (used) by operating activities:<br />
$ 2,523,987 $ 2,253,081<br />
Depreciation 690,851<br />
764,645<br />
Proceeds for litigation settlement 42,710<br />
-<br />
(Increase) decrease in accounts receivable (711,570)<br />
(63)<br />
(Increase) decrease in prepaid expense 3,313<br />
(13,195)<br />
(Increase) decrease in inventories -<br />
(8,575)<br />
Increase (decrease) in accounts payable 231,976<br />
13,660<br />
Increase (decrease) in accrued liabilities (12,685)<br />
(107,624)<br />
Increase (decrease) in unearned revenue (13,794)<br />
-<br />
Increase (decrease) in deposits payable (5,949)<br />
-<br />
Increase (decrease) in self-insurance payable -<br />
(193,000)<br />
Increase (decrease) in compensated absences (18,505)<br />
(20,522)<br />
Total Adjustments<br />
Net Cash Provided (Used) by<br />
206,347<br />
435,326<br />
Operating Activities<br />
Non-Cash Investing, Capital, and Financing Activities:<br />
$ 2,730,334 $ 2,688,407<br />
There were no significant noncash investing, capital and noncapital financing activities for the year ended June 30, 2011.<br />
See Notes to <strong>Financial</strong> Statements 34
FIDUCIARY FUNDS:<br />
Fiduciary Funds<br />
FIDUCIARY FUNDS<br />
These funds are used to account for assets held in an agency or trustee capacity for others.<br />
These funds cannot be used to support the City’s own programs.<br />
35
City of <strong>Moreno</strong> <strong>Valley</strong><br />
Statement of Fiduciary Net Assets<br />
Fiduciary Funds<br />
June 30, 2011<br />
Total<br />
Assets:<br />
Pooled cash and investments (note 3)<br />
Receivables:<br />
$ 7,311,793<br />
Accounts 52,033<br />
Due from other governments<br />
Restricted assets:<br />
42,851<br />
Cash with fiscal agents (note 3) 665,165<br />
Total Assets $ 8,071,842<br />
Liabilities:<br />
Accounts payable $ 298,119<br />
Deposits payable 6,707,676<br />
Payable to trustee 1,066,047<br />
Total Liabilities $ 8,071,842<br />
See Notes to <strong>Financial</strong> Statements 36
Notes to Basic<br />
<strong>Financial</strong> Statements
City of <strong>Moreno</strong> <strong>Valley</strong><br />
Notes to <strong>Financial</strong> Statements<br />
Year Ended June 30, 2011<br />
Note 1: Organization and Summary of Significant Accounting Policies<br />
a. Description of the <strong>Report</strong>ing Entity<br />
The City of <strong>Moreno</strong> <strong>Valley</strong>, California (the City), is located in the County of Riverside and<br />
was incorporated on December 3, 1984 under the general laws of the State of California.<br />
The City operates under an elected Council/City Manager form of government. The City's<br />
major operations include police and fire protection, public works, parks, recreation and<br />
certain social services and general administration services.<br />
<strong>Report</strong>ing Entity<br />
Accounting principles generally accepted in the United States of America require that<br />
these financial statements represent the City of <strong>Moreno</strong> <strong>Valley</strong> and its component<br />
units. A component unit is included in the primary government's financial statements<br />
if the governing body is substantively the same as that of the City or if the component<br />
unit provides services or other benefits almost entirely to the primary government.<br />
The component units discussed below are included in the City's reporting entity<br />
because of their operational significance or financial relationships with the City.<br />
These component units are controlled by common governing boards, which are<br />
substantively the same as the City's and are presented as blended component units<br />
for financial reporting purposes. The component units have the same fiscal year end<br />
as the City. For those that publish separate financial statements, those statements<br />
can be obtained from the City Clerk.<br />
� The Community Redevelopment Agency of the City of <strong>Moreno</strong> <strong>Valley</strong> (the<br />
Agency) was established pursuant to the State of California Health and Safety<br />
Code, Section 53601, entitled Community Redevelopment Law. Its purpose is to<br />
prepare and carry out plans for the improvement, rehabilitation and<br />
redevelopment of blighted areas within the City of <strong>Moreno</strong> <strong>Valley</strong>.<br />
� The <strong>Moreno</strong> <strong>Valley</strong> Community Services District (the District) was established<br />
pursuant to the terms and provisions of the Mello-Roos Community Facilities Act<br />
of 1982. Its purpose is to finance the acquisition and construction of certain major<br />
public capital infrastructure and improvements within the boundaries of the<br />
Community Facilities Districts.<br />
� Community Facilities District No. 2 (<strong>Moreno</strong> <strong>Valley</strong> Auto Mall), Community<br />
Facilities District No. 3 (Auto Mall Refinancing), and Community Facilities District<br />
No. 87-1 and 87-1, IA#1 (Towngate) were established pursuant to the terms and<br />
provisions of the Mello-Roos Community Facilities Act of 1982. Their purpose is<br />
to finance the acquisition and construction of certain major public capital<br />
infrastructure and improvements within the boundaries of the Community<br />
Facilities Districts and they are governed by City Council.<br />
� <strong>Moreno</strong> <strong>Valley</strong> Public Facilities Financing Corporation (MVPFFC) and the<br />
<strong>Moreno</strong> <strong>Valley</strong> Public Financing Authority (MVPFA) are nonprofit public benefit<br />
corporations, formed for the purpose of providing public facility financing to the<br />
City. The Corporations' Boards of Directors are each composed of the five<br />
elected City Council members. Both Corporations may acquire, construct,<br />
rehabilitate, remodel, improve, install and finance or lease various facilities, land<br />
and equipment for the benefit of the City.<br />
37
City of <strong>Moreno</strong> <strong>Valley</strong><br />
Notes to <strong>Financial</strong> Statements<br />
Year Ended June 30, 2011 (Continued)<br />
Note 1: Organization and Summary of Significant Accounting Policies (Continued)<br />
� Industrial Development Authority (the Authority) was established pursuant to the<br />
"California Industrial Development Financing Act" of the California Government<br />
Code. The Authority was established for the purpose of financing the<br />
construction, acquisition and equipment of certain land and facilities within the<br />
City of <strong>Moreno</strong> <strong>Valley</strong> and is governed by the City Council. The Authority did not<br />
report any activity for the current year.<br />
� Housing Authority (the Housing Authority) was established pursuant to State law<br />
section 34240 of the California Health and Safety Code, which allows for every<br />
City to establish a housing authority. The Housing Authority is designed to<br />
protect local housing funds and programs, provide new revenue opportunities for<br />
affordable housing programs, serve the public interest, promote public safety and<br />
welfare, and ensure decent, safe, sanitary and affordable housing<br />
accommodations to persons of low income. The City of <strong>Moreno</strong> <strong>Valley</strong> City<br />
Council serves as the Housing Authority’s Commissioners.<br />
The accounting policies of the City of <strong>Moreno</strong> <strong>Valley</strong> conform with generally accepted<br />
accounting principles as applicable to governments. The following is a summary of the<br />
significant policies.<br />
b. Government-Wide and Fund <strong>Financial</strong> Statements<br />
The government-wide financial statements (i.e., the statement of net assets and the<br />
statement of changes in net assets) report information on all of the nonfiduciary activities<br />
of the primary government and its component units. For the most part, the effect of<br />
interfund activity has been removed from these statements. The primary government is<br />
reported separately from certain legally separate component units for which the primary<br />
government is financially accountable.<br />
The statement of activities demonstrates the degree to which the direct expenses of a<br />
given function or segment is offset by program revenues. Direct expenses are those that<br />
are clearly identifiable with a specific function or segment. Certain indirect costs are<br />
included in the program expense reported for individual functions and activities. Program<br />
revenues include: 1) charges to customers or applicants who purchase, use or directly<br />
benefit from goods, services or privileges provided by a given function or segment, and<br />
2) grants and contributions that are restricted to meeting the operational or capital<br />
requirements of a particular function or segment. Taxes and other items not properly<br />
included among program revenues are reported instead as general revenues.<br />
Separate financial statements are provided for governmental funds and fiduciary funds,<br />
even though the latter are excluded from the government-wide financial statements.<br />
Major individual governmental funds are reported as separate columns in the fund<br />
financial statements.<br />
c. Measurement Focus, Basis of Accounting and <strong>Financial</strong> Statements Presentation<br />
The government-wide financial statements are reported using the economic resources<br />
measurement focus and the accrual basis of accounting, as are the proprietary fund<br />
financial statements. Revenues are recorded when earned and expenses are recorded<br />
when a liability is incurred, regardless of the timing of related cash flows. Property taxes<br />
are recognized as revenues in the year for which they are levied. Grants and similar<br />
items are recognized as revenue as soon as all eligibility requirements imposed by the<br />
provider have been met.<br />
38
City of <strong>Moreno</strong> <strong>Valley</strong><br />
Notes to <strong>Financial</strong> Statements<br />
Year Ended June 30, 2011 (Continued)<br />
Note 1: Organization and Summary of Significant Accounting Policies (Continued)<br />
Agency funds use the accrual basis of accounting. Agency funds are not considered to<br />
have a measurement focus for financial reporting purposes.<br />
Governmental fund financial statements are reported using the current financial<br />
resources measurement focus and the modified accrual basis of accounting. Revenues<br />
are recognized as soon as they are both measurable and available. Revenues are<br />
considered to be available when they are collectible within the current period or soon<br />
enough thereafter to pay liabilities of the current period. For this purpose, the government<br />
considers revenues to be available if they are collected within 60 days of the end of the<br />
current fiscal period, while grant and sales tax revenues have an availability period of<br />
120 days.<br />
Expenditures generally are recorded when a liability is incurred, as under accrual<br />
accounting. However, debt service expenditures, as well as expenditures related to<br />
compensated absences and claims and judgments, are recorded only when payment is<br />
due.<br />
Property taxes, franchise taxes, licenses and interest associated with the current fiscal<br />
period are all considered to be susceptible to accrual and so have been recognized as<br />
revenue of the current fiscal period. Only the portion of special assessments receivable<br />
due within the current fiscal period is considered to be susceptible to accrual as revenue<br />
of the current period. All other revenue items are considered to be measurable and<br />
available only when cash is received by the government.<br />
The City reports the following major governmental funds:<br />
The General Fund is the government's primary operating fund. It accounts for all<br />
financial resources of the general government, except those required to be<br />
accounted for in another fund.<br />
The CSD Zones Special Revenue Fund accounts for the following:<br />
• CSD Zone A - administration and maintenance of the parks and community<br />
service facilities and programs.<br />
• CSD Zone B - operations necessary to process and administer the residential<br />
street lighting program.<br />
• CSD Zone C - operations necessary to process and administer the arterial street<br />
lighting program.<br />
• CSD Zone D - operations necessary to provide landscaping in and around<br />
residential developments.<br />
• CSD Zone E - operations necessary to provide high-service level landscape<br />
maintenance in and around specific major residential developments.<br />
• CSD Zone L - operations necessary to process and administer the library service<br />
program.<br />
39
City of <strong>Moreno</strong> <strong>Valley</strong><br />
Notes to <strong>Financial</strong> Statements<br />
Year Ended June 30, 2011 (Continued)<br />
Note 1: Organization and Summary of Significant Accounting Policies (Continued)<br />
• CSD Zone M - operations necessary to provide orderly development and<br />
maintenance of medians within the City of <strong>Moreno</strong> <strong>Valley</strong> designated as Zone M.<br />
• CFD #1 - provides funding for maintenance of new neighborhood parks, trails<br />
and Class-I bikeways.<br />
• CSD Zone S – provides orderly development and maintenance of extensive<br />
landscape services for commercial sites on Sunnymead Boulevard.<br />
The City has elected to report its Development Impact Fees fund as a major<br />
governmental type fund. The Development Impact Fees Special Revenue Fund accounts<br />
for the following developer impact fees:<br />
• Arterial Street development impact fees<br />
• Traffic Signal development impact fees<br />
• Fire Facility development impact fees<br />
• Police Facility development impact fees<br />
• Park Land Facility development impact fees<br />
• Quimby In-Lieu Park Fees<br />
• Recreation Center development impact fees<br />
• Libraries development impact fees<br />
• City Hall development impact fees<br />
• Corporate Yard development impact fees<br />
• Interchange Improvements development impact fees<br />
• Maintenance Equipment development impact fees<br />
• Animal Shelter development impact fees<br />
The Community Redevelopment Agency Capital Projects Fund accounts for the revenues<br />
received and expenditures made for redevelopment operations.<br />
The Community Redevelopment Agency Debt Service Fund accounts for the tax<br />
increment revenues and other resources collected by the Community Redevelopment<br />
Agency for the payment of Agency debt service.<br />
The City reports the following major business-type fund:<br />
• The Electric Fund accounts for the operations of the City's electric utility.<br />
Additionally the government reports the following fund types:<br />
Internal Service Funds account for financial transactions related to repair,<br />
replacement and maintenance of City-owned equipment, the City's self-insurance<br />
programs and the City's general information systems and telecommunications<br />
hardware and software. These services are provided to other departments or<br />
agencies of the City on a cost reimbursement basis.<br />
The Agency Funds are used to report resources held by the City in a purely custodial<br />
capacity, which includes assets held on behalf of customers and trustees for the<br />
Assessment Districts, TUMF and MSHCP Trust funds.<br />
40
City of <strong>Moreno</strong> <strong>Valley</strong><br />
Notes to <strong>Financial</strong> Statements<br />
Year Ended June 30, 2011 (Continued)<br />
Note 1: Organization and Summary of Significant Accounting Policies (Continued)<br />
Private-sector standards of accounting and financial reporting issued prior to<br />
December 1989 generally are followed in both the government-wide and proprietary fund<br />
financial statements to the extent that those standards do not conflict with or contradict<br />
guidance of the Governmental Accounting Standards Board. Governments also have the<br />
option of following subsequent private-sector guidance for their business-type activities<br />
and enterprise funds, subject to this same limitation. The government has elected not to<br />
follow subsequent private-sector guidance.<br />
As a general rule, the effect of interfund activity has been eliminated from the<br />
government-wide financial statements. Exceptions to this general rule are charges<br />
between the government's proprietary funds function and various other functions of the<br />
government. Elimination of these charges would distort the direct costs and program<br />
revenues reported for the various functions concerned.<br />
Amounts reported as program revenues include: 1) charges to customers or applicants<br />
for goods, services or privileges provided, 2) operating grants and contributions, and<br />
3) capital grants and contributions, including special assessments. Internally dedicated<br />
resources are reported as general revenues rather than as program revenues. Likewise,<br />
general revenues include all taxes.<br />
Proprietary funds distinguish operating revenues and expenses from nonoperating items.<br />
Operating revenues and expenses generally result from providing services and producing<br />
and delivering goods in connection with a proprietary fund's principal ongoing operations.<br />
The principal operating revenues of the Internal Service Funds are charges to customers<br />
for sales and services. Operating expenses for Internal Service Funds include the cost of<br />
sales and services, administrative expenses and depreciation on capital assets. All<br />
revenues and expenses not meeting this definition are reported as nonoperating<br />
revenues and expenses.<br />
When both restricted and unrestricted resources are available for use, it is the<br />
government's policy to use restricted resources first, then unrestricted resources as they<br />
are needed.<br />
d. Assets, Liabilities and Net Assets or Equity<br />
Deposits, Investments, Cash and Cash Equivalents<br />
The City's cash and cash equivalents are considered to be cash on hand, demand<br />
deposits and short-term investments with original maturities of three months or less<br />
from the date of acquisition.<br />
Investments for the City, as well as for its component units, are reported at fair value<br />
except for investment contracts that are reported at cost because they are not<br />
transferable and they have terms that are not affected by changes in market interest<br />
rates. The City's policy is generally to hold investments until maturity or until fair<br />
values equal or exceed cost. The State Treasurer's Investment Pool operates in<br />
accordance with appropriate state laws and regulations. The reported value of the<br />
pool is the same as the fair value of the pool shares.<br />
41
City of <strong>Moreno</strong> <strong>Valley</strong><br />
Notes to <strong>Financial</strong> Statements<br />
Year Ended June 30, 2011 (Continued)<br />
Note 1: Organization and Summary of Significant Accounting Policies (Continued)<br />
Receivables and Payables<br />
Activity between funds that are representative of lending/borrowing arrangements<br />
outstanding at the end of the fiscal year are referred to as either "due to/from other<br />
funds" (i.e., the current portion of interfund loans) or "advances to/from other funds"<br />
(i.e., the non-current portion of interfund loans). All other outstanding balances<br />
between funds are reported as "due to/from other funds".<br />
Any residual balances outstanding between the governmental activities and<br />
business-type activities are reported in the government-wide financial statements as<br />
"advances to/from from other funds".<br />
Advances between funds, as reported in the fund financial statements, are offset by a<br />
fund balance reserve account in applicable governmental funds to indicate that they<br />
are not available for appropriation and are not expendable available financial<br />
resources.<br />
All trade and property tax receivables are shown net of an allowance for<br />
uncollectibles.<br />
Inventory and Prepaid Items<br />
Inventories in the Central Services Internal Service Fund and the Equipment<br />
Maintenance Internal Service Fund are valued at cost using the first-in/first-out<br />
(FIFO) method. Inventory consists of expendable supplies held for consumption.<br />
Certain payments to vendors reflect costs applicable to future accounting periods and<br />
are recorded as prepaid items in both government-wide and fund financial<br />
statements. The fund balances in the governmental fund types have been reserved<br />
for amounts equal to the prepaid items in the fund-level statements, since these<br />
amounts are not available for appropriation.<br />
Capital Assets<br />
Capital assets, which include property, plant, equipment and infrastructure assets<br />
(e.g., roads, bridges, sidewalks and similar items), are reported in the<br />
government-wide financial statements. Capital assets are defined by the City as<br />
assets with an initial, individual cost of more than $5,000 (amount not rounded) and<br />
an estimated useful life in excess of two years. Such assets are recorded at historical<br />
cost or estimated historical cost if purchased or constructed. Donated capital assets<br />
are recorded at estimated fair market value at the date of donation.<br />
The costs of normal maintenance and repairs that do not add to the value of the<br />
asset or materially extend assets lives are not capitalized.<br />
Major outlays for capital assets and improvements are capitalized as projects are<br />
constructed.<br />
42
City of <strong>Moreno</strong> <strong>Valley</strong><br />
Notes to <strong>Financial</strong> Statements<br />
Year Ended June 30, 2011 (Continued)<br />
Note 1: Organization and Summary of Significant Accounting Policies (Continued)<br />
Property, plant and equipment are depreciated using the straight-line method over the<br />
following estimated useful lives:<br />
Assets Years<br />
Buildings and Improvements 5 - 50<br />
Furniture and Equipment 3 - 15<br />
Vehicles 3 - 10<br />
Infrastructure 25 - 50<br />
Deferred Revenue and Unearned Revenue<br />
The City reports deferred revenue in the fund-level statements. Deferred revenue<br />
arises when potential revenue does not meet both the "measurable" and "available"<br />
criteria for recognition in the current period. In subsequent periods, when both<br />
revenue recognition criteria are met, or when the City has a legal claim to the<br />
resources, the liability for deferred revenue is removed and revenue is recognized.<br />
The City reports unearned revenue in the fund-level statements and in the Statement<br />
of Net Assets. Unearned revenue arises when the City receives resources before it<br />
has a legal claim to them, as when grant monies are received prior to the incurrence<br />
of qualifying expenditures.<br />
Compensated Absences<br />
It is the government's policy to permit employees to accumulate earned but unused<br />
annual leave benefits. The City records the annual leave liability using benefits<br />
earned by employees at the balance sheet date that will result in termination<br />
payments rather than compensated absences. The City records the annual leave<br />
liability using the dollar value of employees' rights to receive compensation<br />
attributable to services already rendered.<br />
Long-Term Obligations<br />
In the government-wide financial statements, and proprietary fund types in the fund<br />
financial statements, long-term debt and other long-term obligations are reported as<br />
liabilities. Bond premiums and discounts, as well as issuance costs, are deferred and<br />
amortized over the life of the bonds using the effective interest method. Bonds<br />
payable are reported net of the applicable bond premium or discount. Bond issuance<br />
costs are reported as deferred charges and amortized over the term of the related<br />
debt.<br />
In the fund financial statements, governmental fund types recognize bond premiums<br />
and discounts, as well as bond issuance costs, during the current period. The face<br />
amount of debt issued is reported as other financing sources. Premiums received on<br />
debt issuances are reported as other financing sources while discounts on debt<br />
issuances are reported as other financing uses. Issuance costs, whether or not<br />
withheld from the actual debt proceeds received, are reported as debt service<br />
expenditures.<br />
43
City of <strong>Moreno</strong> <strong>Valley</strong><br />
Notes to <strong>Financial</strong> Statements<br />
Year Ended June 30, 2011 (Continued)<br />
Note 1: Organization and Summary of Significant Accounting Policies (Continued)<br />
Land Held for Resale<br />
Land purchased for the purposes of resale (or contribution to a redevelopment<br />
project) is recorded at the cost to purchase the property or, upon entering into a<br />
contract for sale, the estimated net realizable value, if lower.<br />
Fund Equity<br />
The City issued GASB Statement No. 54 “Fund Balance <strong>Report</strong>ing and<br />
Governmental Fund Type Definitions” during fiscal year 2010-2011. In the fund<br />
financial statements, government funds report the following fund balance<br />
classification:<br />
Property Taxes<br />
Nonspendable include amounts that cannot be spent because they are either<br />
(a) not in spendable form or (b) legally or contractually required to be maintained<br />
intact.<br />
Restricted include amounts that are constrained on the use of resources by<br />
either (a) external creditors, grantors, contributors, or laws of regulations of other<br />
governments or (b) by law through constitutional provisions or enabling<br />
legislation.<br />
Committed include amounts that can only be used for specific purposes pursuant<br />
to constraints imposed by formal action of the government’s highest authority,<br />
City Council. The formal action that is required to be taken to establish, modify,<br />
or rescind a fund balance commitment is a minute action or a resolution.<br />
Assigned include amounts that are constrained by the government’s intent to be<br />
used for specific purposes, but are neither restricted nor committed. The<br />
<strong>Financial</strong> and Administrative Services Director is authorized to assign amounts to<br />
a specific purpose, which was established by the governing body in a resolution.<br />
Unassigned include the residual amounts that have not been restricted,<br />
committed, or assigned to specific purposes.<br />
An individual governmental fund could include nonspendable resources and<br />
amounts that are restricted, committed, assigned, or unassigned or any<br />
combination of those classifications. Restricted amounts are to be considered<br />
spent when an expenditure is incurred for purposes for which both restricted and<br />
unrestricted fund balance is available and committed, assigned, then unassigned<br />
amounts are considered to have been spent when an expenditure is incurred for<br />
purposes for which amounts in any of those unrestricted fund balance<br />
classifications can be used.<br />
Property taxes attach as an enforceable lien on property as of January 1. Secured<br />
property taxes are payable in two installments with December 10 the last day to pay<br />
the first installment of secured property taxes without penalty, and April 10 the last<br />
day to pay the second installment of secured property taxes without penalty.<br />
Unsecured personal property taxes are due in a single installment on August 31. The<br />
County of Riverside bills and collects the property taxes and remits them to the City<br />
in installments during the year. Property taxes received within 60 days after the City's<br />
fiscal year end are considered "measurable" and "available" and are accrued in the<br />
City's financial statements.<br />
44
City of <strong>Moreno</strong> <strong>Valley</strong><br />
Notes to <strong>Financial</strong> Statements<br />
Year Ended June 30, 2011 (Continued)<br />
Note 2: Stewardship, Compliance and Accountability<br />
a. Budgetary Information<br />
Budgets are legally adopted and formal budgetary integration is employed as a<br />
management control device during the year for all Governmental Fund types. The budget<br />
is prepared on a GAAP (Generally Accepted Accounting Principles) basis. From the<br />
effective date of the budget, the amounts stated therein as proposed expenditures<br />
become appropriations to the various City departments.<br />
The City Council may amend the budget only during a regular meeting, providing that<br />
sufficient monies are available and that expenditures of proceeds of taxes will not be<br />
increased beyond the constitutional appropriation limit as imposed by Article XIIIB of the<br />
State Constitution.<br />
The City's formal budgetary process begins at the operating program level. Departmental<br />
budgets are comprised of the various operating program budgets. Operating programs do<br />
not cross departmental lines. Individual fund budgets consist of the departmental<br />
budgets; departmental budgets may cross fund lines.<br />
Individual fund budgets are, in all cases where appropriations are required, the same as<br />
the appropriation amounts. In the case of the Governmental Fund types, unexpended<br />
budgeted amounts, except for amounts relating to capital projects, lapse at the end of the<br />
budget year. Spending control (legal level) for most funds is established by the amount of<br />
expenditures budgeted at the departmental and fund levels. Accordingly, the General<br />
Fund expenditures are displayed in the supplementary schedules at the department level<br />
and the Special Revenue, Debt Service and Capital Projects Funds expenditures are<br />
displayed at the function level. Management control is exercised at the line item level in<br />
each operating program. Management can transfer budgeted amounts between<br />
operating programs, departments or funds, provided that such transfers do not increase<br />
the overall budget. Appropriations that increase the budget require City Council<br />
approval.<br />
For fiscal year 2010-2011, the following funds had no adopted annual budgets:<br />
• Article 3 Transportation<br />
• Prop 42 Replacement Funds<br />
• Capital Improvements<br />
• Traffic Signal Mitigation<br />
• 2011 Priv Placement Ref 97 Lease Rev Bonds<br />
• 2011 Priv Placement Ref 97 COPs<br />
• Equestrian Trail Endowment<br />
• Rockridge Park Endowment<br />
These funds had no adopted budget due to the timing of the usage of the funds. Money<br />
will be budgeted as needed based on specific projects to be completed with these funds.<br />
45
Note 3: Cash and Investments<br />
City of <strong>Moreno</strong> <strong>Valley</strong><br />
Notes to <strong>Financial</strong> Statements<br />
Year Ended June 30, 2011 (Continued)<br />
As of June 30, 2011, cash and investments were reported in the accompanying financial<br />
statements as follows:<br />
Government Activities:<br />
Governmental Funds $ 183,029,627<br />
Internal Service Funds 36,198,067<br />
Business-Type Activities<br />
7,706,620<br />
Fiduciary Funds<br />
7,976,958<br />
Total Cash and Investments<br />
Cash and investments as of June 30, 2011 consist of the following:<br />
$<br />
234,911,272<br />
Cash and Cash Equivalents<br />
Petty cash and change boxes $ 14,837<br />
Demand deposit (2,394,341)<br />
Investments<br />
220,462,700<br />
Cash and Investments with fiscal agents<br />
16,828,076<br />
Total Cash and Investments<br />
$<br />
234,911,272<br />
The City follows the practice of pooling cash and investments of all funds, except for funds<br />
required to be held by fiscal agents under provisions of bond indentures. Interest income<br />
earned on pooled cash and investments is allocated monthly to the various funds based on<br />
monthly cash and investment balances. Interest income from cash and investments with<br />
fiscal agents is credited directly to the related fund.<br />
Deposits<br />
The California Government Code requires California banks and savings and loan<br />
associations to secure a City’s deposits by pledging government securities with a value of<br />
110% of a City’s deposits. California law also allows financial institutions to secure City<br />
deposits by pledging first trust deed mortgage notes having a value of 150% of a City’s<br />
total deposits. The City Treasurer may waive the collateral requirement for deposits<br />
which are fully insured up to $250,000 by the FDIC. The collateral for deposits in federal<br />
and state chartered banks is held in safekeeping by an authorized Agent of Depository<br />
recognized by the State of California Department of Banking. The collateral for deposits<br />
with savings and loan associations is generally held in safekeeping by the Federal<br />
HomeLoan Bank in San Francisco, California as an Agent of Depository. These securities<br />
are physically held in an undivided pool for all California public agency depositors. Under<br />
Government Code Section 53655, the placement of securities by a bank or savings and<br />
loan association with an “Agent of Depository” has the effect of perfecting the security<br />
interest in the name of the local government agency. Accordingly, all collateral held by<br />
the California Agents of Depository are considered to be held for, and in the name of, the<br />
local government agency.<br />
46
Note 3: Cash and Investments (Continued)<br />
Investments<br />
City of <strong>Moreno</strong> <strong>Valley</strong><br />
Notes to <strong>Financial</strong> Statements<br />
Year Ended June 30, 2011 (Continued)<br />
Under provisions of the City’s investment policy, and in accordance with the California<br />
Government Code, the following investments are authorized:<br />
• U.S. Treasury Bills, Notes and Bonds<br />
• Government Sponsored Enterprises (GSE’s) or U.S. Agencies<br />
• California State Local Agency Investment Fund (LAIF)<br />
• Bonds, notes or other indebtedness of the State of California<br />
• Bonds, notes or other indebtedness of local agencies in California<br />
• Bankers Acceptances<br />
• Commercial Paper<br />
• Commercial Paper issued under the Temporary Liquidity Guarantee Program (TLGP)<br />
• Time Deposits and Non-negotiable Certificates of Deposit<br />
• Negotiable Certificates of Deposit<br />
• Repurchase Agreements<br />
• Corporate Obligations (Medium-term Notes)<br />
• Corporate Obligations (Medium-term Notes) issued under the Temporary Liquidity<br />
Guarantee Program (TLGP)<br />
• Mutual Funds and Money Market Accounts<br />
• Other Government Sponsored Investment Pools<br />
Investments Authorized by Debt Agreements<br />
The above investments do not address the investment of debt proceeds held by a bond<br />
trustee. Investments of debt proceeds held by a bond trustee are governed by provisions<br />
of the debt agreements, rather than the general provisions of the California Government<br />
Code or the City’s investment policy.<br />
Investments in State Investment Pool<br />
The City is a voluntary participant in the Local Agency Investment Fund (LAIF) that is<br />
regulated by California Government Code Section 16429 under the oversight of the<br />
Treasurer of the State of California. LAIF is overseen by the Local Agency Investment<br />
Advisory Board, which consists of five members, in accordance with State statute. The<br />
State Treasurer’s Office audits the fund annually. The fair value of the position in the<br />
investment pool is the same as the value of the pool shares.<br />
GASB Statement No. 31<br />
The City adopted GASB Statement No. 31, Accounting and <strong>Financial</strong> <strong>Report</strong>ing for<br />
Certain Investments and for External Investment Pools, as of July 1, 1997. GASB<br />
Statement No. 31 establishes fair value standards for investments in participating interest<br />
earning investment contracts, external investment pools, equity securities, option<br />
contracts, stock warrants and stock rights that have readily determinable fair values.<br />
Accordingly, the City reports its investments at fair value in the balance sheet. All<br />
investment income, including changes in the fair value of investments, is recognized as<br />
revenue in the operating statement.<br />
47
Note 3: Cash and Investments (Continued)<br />
Credit Risk<br />
City of <strong>Moreno</strong> <strong>Valley</strong><br />
Notes to <strong>Financial</strong> Statements<br />
Year Ended June 30, 2011 (Continued)<br />
The City’s investment policy limits investments in medium term notes (MTN’s) to those<br />
rated in the top category by two of the three largest nationally recognized rating services<br />
at the time of purchase (with split ratings, the lower rating must meet the standard). As of<br />
June 30, 2011, the City’s investment in medium term notes consisted of investments with<br />
Bank of America, Bank of New York, Bellsouth Corp., Berkshire Hathaway, Blackrock<br />
Inc., General Electric Capital Corp., Goldman Sachs, JP Morgan, Lehman Bros, Morgan<br />
Stanley, Pepsico Inc., Praxair, U.S. Bankcorp, Wal-Mart, and Wells Fargo Bank. At<br />
June 30, 2011, all MTN’s were rated “A” or higher by Moody’s with the exception of<br />
Lehman Bros. During the fiscal year, the City revised its investment policy of MTN<br />
purchases from Aaa to A by Moody’s. All securities were investment grade and legal<br />
under State and City law at their time of purchase. The City’s investment portfolio<br />
includes two (2) $1 million corporate notes from Lehman Brothers. Since Lehman<br />
Brothers filed for Chapter 11 bankruptcy in September 2008, these investments totaling<br />
$2 million are at risk. The City continues to pursue recovery through various means,<br />
although the amount of recovery that will be ultimately realized from these two cases is<br />
unknown. Federal agency securities are rated AAA. Investments in U.S. Treasury<br />
securities are not considered to have credit risk and, therefore, their credit quality is not<br />
disclosed. As of June 30, 2011, the City’s investments in external investment pools and<br />
investment agreements are unrated.<br />
On August 5, 2011, Standard & Poor's Ratings Services lowered its long-term sovereign<br />
credit rating on the United States of America to AA+ from AAA. As a result, on<br />
August 8, 2011, Standard & Poor's Ratings Services lowered its issuer credit ratings and<br />
related issue ratings on various Federal Home Loan Bank, Federal Farm Credit Bank,<br />
Fannie Mae and Freddie Mac to AA+ from AAA. The City invests in LAIF which invests<br />
in various underlying securities, including the federal agency securities listed above.<br />
While LAIF is not rated, the federal agency securities are, and these have been affected<br />
by this rating change.<br />
Custodial Credit Risk<br />
The custodial credit risk for deposits is the risk that, in the event of the failure of a<br />
depository financial institution, a government will not be able to recover deposits or will<br />
not be able to recover collateral securities that are in the possession of an outside party.<br />
The carrying amount of the City’s demand deposits was $(2,394,341) at June 30, 2011.<br />
Bank balances before reconciling items were $3,302,347 at that date, the total amount of<br />
which was collateralized or insured with securities held by the pledging financial<br />
institutions in the City’s name as discussed above under “Deposits”. The custodial credit<br />
risk for investments is the risk that, in the event of the failure of the counterparty to a<br />
transaction, a government will not be able to recover the value of investment or collateral<br />
securities that are in the possession of an outside party. In accordance with the City’s<br />
investment policy, all investments are held by third-party custodians for safekeeping, with<br />
the securities in the City’s name. This is the lowest level of custodial credit risk exposure.<br />
Interest Rate Risk<br />
The City’s investment policy limits investment maturities as a means of managing its<br />
exposure to fair value losses arising from increasing interest rates. The City’s investment<br />
portfolio will not directly invest in securities maturing in more than five years. The City has<br />
elected to use the segmented time distribution method of disclosure for its interest rate<br />
risk.<br />
48
Note 3: Cash and Investments (Continued)<br />
Concentration of Credit Risk<br />
City of <strong>Moreno</strong> <strong>Valley</strong><br />
Notes to <strong>Financial</strong> Statements<br />
Year Ended June 30, 2011 (Continued)<br />
The City’s investment policy imposes restrictions on the maximum percentage and<br />
amount that can be invested in certain types of investments. These restrictions are as<br />
follows:<br />
Investment Types Maturity Limit<br />
Maximum<br />
Portfolio<br />
Percentage<br />
Maximum<br />
Investment in<br />
One Issuer<br />
U.S. Treasury bills, notes and bonds 5 years None None<br />
GSE's or U.S. Agencies 5 years None None<br />
California State Local Agency Investment Fund n/a None None<br />
Bonds, notes or other indebtedness of the State of Califo 5 years None None<br />
Bonds, notes or other indebtedness of local agencies in 5 years None 5%<br />
Bankers Acceptances 180 days 40% 5%<br />
Commercial Paper 270 days 25% 5%<br />
Negotiable Certificates of Deposits 5 years 30% 5%<br />
CD Placement Service 5 years 30% 5%<br />
Repurchase Agreements 1 year None 5%<br />
Reverse Repurchase Agreements 92 days 20% 5%<br />
Medium-term Notes (MTN's) 5 years 30% 5%<br />
Mutual Funds and Money Market Accounts n/a 20% 5%<br />
Collateralized Bank Deposits 5 years None 5%<br />
Mortgage Pass-Through Securities 5 years 20% 5%<br />
Bank/Time Deposits 5 years None 5%<br />
Other Governmental Sponsored Investment Pools n/a None None<br />
As of June 30, 2011, the City is in compliance with the investment policy restriction.<br />
The City has invested more than 5% of the total investment value with the following<br />
issuers:<br />
Medium Term Notes 18.5%<br />
U.S. Treasury Notes 21.1%<br />
Federal Farm Credit Banks 9.9%<br />
Federal Farm Loan Bank 5.6%<br />
Federal Home Loan Mortgage Corp 9.4%<br />
Federal National Mortgage Assn 7.1%<br />
As of June 30, 2011, the City had the following investments and original maturities:<br />
Held by Bond Trustee:<br />
Money Market Funds 16,828,076<br />
Totals<br />
Investment Type<br />
Local Agency Investment Fund<br />
Money Market Fund<br />
Medium Term Notes<br />
US Treasury Notes<br />
Federal Farm Credit Banks<br />
Federal Farm Loan Banks<br />
Federal Home Loan Mortgage Corp<br />
Federal National Mortgage Assn.<br />
Tennessee <strong>Valley</strong> Authority<br />
6 months or less 6 months to 1 year 1 to 3 years 3 to 5 years Fair Value<br />
$ 42,568,573 $ - $ - $ - $ 42,568,573<br />
209,027<br />
-<br />
-<br />
-<br />
209,027<br />
-<br />
261,250 22,758,209 20,977,728 43,997,187<br />
3,087,997 15,707,226 14,567,681 16,582,267 49,945,171<br />
-<br />
1,049,683 16,111,197 6,284,376 23,445,256<br />
3,024,334<br />
1,011,940 9,147,721<br />
- 13,183,995<br />
3,940,704<br />
- 10,472,858 7,797,136 22,210,698<br />
4,537,427<br />
2,033,554 2,306,488 7,898,482 16,775,951<br />
-<br />
- 8,126,842<br />
- 8,126,842<br />
-<br />
-<br />
-<br />
16,828,076<br />
$ 74,196,138 $ 20,063,653 $ 83,490,996 $ 59,539,989 $ 237,290,776<br />
49
Note 4: Notes and Loan Receivables<br />
City of <strong>Moreno</strong> <strong>Valley</strong><br />
Notes to <strong>Financial</strong> Statements<br />
Year Ended June 30, 2011 (Continued)<br />
Notes and loans receivables of $24,497,512 consist primarily of revolving home improvement<br />
loans and are due beyond one year.<br />
A summary of amounts owed at June 30, 2011 follows:<br />
Note 5: Capital Assets<br />
Cottonwood Properties<br />
Community<br />
Redevelopment<br />
Agency Capital<br />
Projects Fund<br />
3,862,034<br />
Sheila Street Rehabilitation 2,651,875<br />
RHDC Properties 1,866,557<br />
CVHC 1,639,450<br />
Ability First 824,917<br />
Bay Family Apartments 755,000<br />
Perris Isle 413,000<br />
Oakwood 2,250,000<br />
Rancho Dorado 5,550,000<br />
Others 707,104<br />
Totals 20,519,937<br />
Nonmajor<br />
Governmental<br />
Funds<br />
$<br />
$ 2,050,000<br />
-<br />
773,616<br />
-<br />
-<br />
-<br />
687,000<br />
-<br />
-<br />
466,959<br />
$ $ 3,977,575<br />
General government capital asset activity for the year ended June 30, 2011 follows:<br />
Balance<br />
July 1, 2010 Transfers Additions Deletions<br />
Balance<br />
June 30, 2011<br />
Non-Depreciable Assets:<br />
Land<br />
$ 308,409,790 $ - $ - $ - $ 308,409,790<br />
Construction<br />
49,288,732 (21,667,306) 22,688,240<br />
- 50,309,666<br />
Subtotal: Non-Depreciable Assets 357,698,522 (21,667,306) 22,688,240<br />
- 358,719,456<br />
Depreciable Assets:<br />
Buildings & Improvements<br />
110,203,280<br />
Machinery & Equipment<br />
11,953,150<br />
Vehicles<br />
9,810,910<br />
Infrastructure<br />
594,714,729<br />
Subtotal: Depreciable Assets 726,682,069<br />
Total Capital Assets 1,084,380,591<br />
Less Accumulated Depreciation for:<br />
Buildings & Improvements<br />
(37,968,341)<br />
Machinery & Equipment<br />
(9,825,372)<br />
Vehicles<br />
(6,690,128)<br />
Infrastructure<br />
(223,876,477)<br />
Total Accumulated Depreciation (278,360,318)<br />
5,928,365<br />
-<br />
-<br />
15,738,941<br />
21,667,306<br />
-<br />
-<br />
-<br />
-<br />
-<br />
-<br />
87,783<br />
620,688<br />
-<br />
24,414,000<br />
25,122,471<br />
47,810,711<br />
(3,333,602)<br />
(857,972)<br />
(856,933)<br />
(19,042,316)<br />
(24,090,823)<br />
-<br />
-<br />
-<br />
-<br />
-<br />
-<br />
-<br />
-<br />
-<br />
-<br />
-<br />
116,219,428<br />
12,573,838<br />
9,810,910<br />
634,867,670<br />
773,471,846<br />
1,132,191,302<br />
(41,301,943)<br />
(10,683,344)<br />
(7,547,061)<br />
(242,918,793)<br />
(302,451,141)<br />
Total Net Capital Assets $ 806,020,273 $ - $ 23,719,888 $ - $ 829,740,161<br />
50
Note 5: Capital Assets (Continued)<br />
City of <strong>Moreno</strong> <strong>Valley</strong><br />
Notes to <strong>Financial</strong> Statements<br />
Year Ended June 30, 2011 (Continued)<br />
Depreciation expense was charged to functions/programs of the primary government as<br />
follows:<br />
Governmental Activities:<br />
General Government $ 132,861<br />
Public safety 1,238,516<br />
Community development 833,341<br />
Community and cultural 1,931,532<br />
Public works 19,189,928<br />
Internal service funds 764,645<br />
Total $ 24,090,823<br />
Business-type capital asset activity for the year ended June 30, 2011 follows:<br />
Balance<br />
July 1, 2010 Transfers Additions Deletions<br />
Balance<br />
June 30, 2011<br />
Non-Depreciable Assets:<br />
Land<br />
$ 1,237,459 $ - $ - $ - $ 1,237,459<br />
Construction In Progress<br />
1,963,713 (4,381,933) 2,701,873<br />
- 283,653<br />
Subtotal: Non-Depreciable Assets 3,201,172 (4,381,933) 2,701,873<br />
- 1,521,112<br />
Depreciable Assets:<br />
Infrastructure<br />
33,376,974<br />
Subtotal: Depreciable Assets 33,376,974<br />
Total Capital Assets 36,578,146<br />
Less Accumulated Depreciation for:<br />
Infrastructure<br />
(3,049,276)<br />
Total Accumulated Depreciation (3,049,276)<br />
4,381,933<br />
4,381,933<br />
-<br />
-<br />
-<br />
194,380<br />
194,380<br />
2,896,253<br />
(690,851)<br />
(690,851)<br />
-<br />
-<br />
-<br />
-<br />
-<br />
37,953,287<br />
37,953,287<br />
39,474,399<br />
(3,740,127)<br />
(3,740,127)<br />
Total Net Capital Assets $ 33,528,870 $ - $ 2,205,402 $ - $ 35,734,272<br />
Depreciation expense for business-type activities was charged as follows:<br />
Electric Utility $ 690,851<br />
51
Note 6: Long Term Debt<br />
City of <strong>Moreno</strong> <strong>Valley</strong><br />
Notes to <strong>Financial</strong> Statements<br />
Year Ended June 30, 2011 (Continued)<br />
Changes in Long-Term Debt - Governmental Activities<br />
The following is a schedule of changes in long-term debt of the entity for the fiscal year ended<br />
June 30, 2011:<br />
Towngate Community Facilities District No. 87-7:<br />
2007 Towngate Special Tax Refunding Bonds<br />
2007 Towngate Improvement Tax Refunding<br />
Community Facilities District No. 3:<br />
Auto Mall Special Tax Bonds<br />
Balance<br />
July 1, 2010 Additions Deletions<br />
Balance<br />
June 30, 2011<br />
Due Within<br />
One Year<br />
$ 9,490,000 $ - $ (630,000) $ 8,860,000 $ 655,000<br />
3,665,000<br />
- (195,000) 3,470,000 205,000<br />
2,370,000<br />
<strong>Moreno</strong> <strong>Valley</strong> Public Facilities Financing<br />
Refunding Certificates of Participation, Series 1997 4,875,000<br />
2011 Private Placement Refunding, Series 1997<br />
Variable Rate Certificates of Participation -<br />
<strong>Moreno</strong> <strong>Valley</strong> Public Financing Authority:<br />
Lease Revenue Bonds, 1997<br />
3,705,000<br />
Lease Revenue Bonds, 2005<br />
40,500,000<br />
2011 Private Placement Refunding, Series 1997<br />
Variable Rate Certificates of Participation -<br />
City:<br />
Accrued Self-Insurance Claims and Judgments<br />
Compensated Absences:<br />
3,620,000<br />
Governmental Funds 4,079,196<br />
Internal Service Funds 548,566<br />
Child Development Portable Classrooms<br />
16,440<br />
-<br />
-<br />
4,343,500<br />
-<br />
-<br />
3,272,000<br />
1,022,687<br />
867,150<br />
140,895<br />
-<br />
(1,045,000)<br />
(4,875,000)<br />
-<br />
(3,705,000)<br />
(840,000)<br />
-<br />
(1,215,687)<br />
(260,178)<br />
(161,417)<br />
(16,440)<br />
1,325,000<br />
-<br />
4,343,500<br />
-<br />
39,660,000<br />
3,272,000<br />
3,427,000<br />
4,686,168<br />
528,044<br />
-<br />
15,000<br />
-<br />
681,000<br />
-<br />
885,000<br />
261,000<br />
910,000<br />
298,892<br />
316,826<br />
-<br />
Community Redevelopment Agency<br />
Notes Payable, Price Company<br />
2,023,648<br />
- (287,581) 1,736,067<br />
-<br />
RDA - 2007 Tax Allocation Bonds Series A<br />
42,605,000<br />
- (130,000) 42,475,000 210,000<br />
Totals $ 117,497,850 $ 9,646,232 $ (13,361,303) $ 113,782,779 $ 4,437,718<br />
2007 Towngate Special Tax Refunding Bonds<br />
Towngate CFD 87-1 2007 Special Tax Refunding Bonds in the original issue of $10,665,000<br />
were issued in November 2007 to refund prior bonds currently outstanding, to fund a reserve<br />
for the bonds and to pay issuance costs. The bonds mature in serial fashion through<br />
December 1, 2021 and bear interest ranging from 3.50% to 5.00%. The bonds are subject to<br />
both optional and mandatory redemption prior to maturity beginning on December 1, 2017.<br />
The bonds are payable from and secured by a special tax levy against certain affected<br />
parcels within the District. Under an arrangement (Participation Agreement) involving the<br />
District, the City and the City's Redevelopment Agency, the required tax levy may be reduced<br />
in part by the reimbursable tax increment and utility reimbursements from the Agency. This<br />
refinancing decreased the aggregate debt service payments that were required on the<br />
Refunded Bonds by approximately $3,650,042. This refunding resulted in an economic gain<br />
of approximately $1,061,603.<br />
52
Note 6: Long Term Debt (Continued)<br />
City of <strong>Moreno</strong> <strong>Valley</strong><br />
Notes to <strong>Financial</strong> Statements<br />
Year Ended June 30, 2011 (Continued)<br />
The annual debt service requirements for the 2007 Towngate Special Tax Refunding Bonds<br />
payable outstanding at June 30, 2011, are as follows:<br />
2007 Towngate Special Tax<br />
Refunding Bonds<br />
Principal Interest<br />
Year Ending June 30,<br />
2011-2012 $ 655,000 $ 359,294<br />
2012-2013 680,000 335,931<br />
2013-2014 700,000 310,906<br />
2014-2015 730,000 283,181<br />
2015-2016 760,000 253,381<br />
2017-2021 4,350,000 688,931<br />
2022-2026 985,000 20,316<br />
Totals $ 8,860,000 $ 2,251,940<br />
2007 Towngate Improvement Tax Refunding Bonds<br />
CFD 87-1 Improvement Area No. 1 Special Tax Refunding Bonds in the original issue of<br />
$4,075,000 were issued in November 2007 to refund prior bonds currently outstanding, to<br />
fund a reserve for the bonds and to pay issuance costs. The bonds mature in serial fashion<br />
through October 1, 2023 and bear interest ranging from 3.75% to 4.875%. The bonds are<br />
subject to both optional and mandatory redemption prior to maturity beginning on<br />
April 1, 2009. The bonds are payable from and secured by a special tax levy against certain<br />
affected parcels within the District. Under an arrangement (a Cooperation and<br />
Reimbursement Agreement) involving the District, the City and the City's Redevelopment<br />
Agency, the required tax levy may be reduced in part by a reimbursable tax increment from<br />
the Agency to a maximum of 70.3% of required debt service. This refinancing increased the<br />
aggregate debt service payments that were required on the Refunded Bonds by<br />
approximately $984,049. This refunding resulted in an economic gain of approximately<br />
$465,301.<br />
The annual debt service requirements for the 2007 Towngate Improvement Tax Refunding<br />
Bonds payable outstanding at June 30, 2011, are as follows:<br />
2007 Towngate Improvement<br />
Tax Refunding Bonds<br />
Principal Interest<br />
Year Ending June 30,<br />
2011-2012 $ 205,000 $ 152,173<br />
2012-2013 210,000 143,719<br />
2013-2014 220,000 135,009<br />
2014-2015 230,000 125,669<br />
2015-2016 240,000 115,739<br />
2017-2021 1,375,000 403,905<br />
2022-2026 990,000 73,288<br />
Totals $ 3,470,000 $ 1,149,502<br />
53
Note 6: Long Term Debt (Continued)<br />
Auto Mall Special Tax Bonds<br />
City of <strong>Moreno</strong> <strong>Valley</strong><br />
Notes to <strong>Financial</strong> Statements<br />
Year Ended June 30, 2011 (Continued)<br />
Community Facilities District No. 3, Auto Mall Special Tax Bonds 2000, Refinancing in<br />
March 2000, the Community Facilities District No. 3 of the City of <strong>Moreno</strong> <strong>Valley</strong> issued<br />
Special Tax Bonds 2000 (Refinancing Bonds) in the amount of $8,075,000 to refund on<br />
June 1, 2000 $7,828,258 of outstanding Auto Mall Special Tax Bonds (Refunded Bonds). The<br />
Refinancing Bonds mature in serial and term fashion through September 2030 and bear<br />
interest payable semi-annually at rates ranging from 5.25% to 7.50%. The bonds are subject<br />
to optional and mandatory redemption prior to maturity beginning September 1, 2010. The<br />
bonds are payable from and secured by a special tax levy against parcels within the District.<br />
Under an arrangement (Owner Participation Agreement) involving the parcel owners, the<br />
District, the City and the City's Redevelopment Agency, the required tax levy is to be offset by<br />
available property tax increment from the Agency. Should available increment be insufficient<br />
to offset the levy, available project sales tax collected by the City will be used. This<br />
refinancing increased the aggregate debt service payments that were required on the<br />
Refunded Bonds by approximately $3,100,000 and produced an economic loss (the excess<br />
of the present value of the new over old debt service payments) of approximately $418,000.<br />
The refinancing was undertaken to cure a debt service payment default that had occurred on<br />
the now refunded bonds. Special tax delinquencies were the primary cause of the default.<br />
The annual debt service requirements for the Auto Mall Special Tax Bonds payable<br />
outstanding at June 30, 2011, are as follows:<br />
Auto Mall Special Tax Bonds<br />
Principal Interest<br />
Year Ending June 30,<br />
2011-2012 $ 15,000 $ 98,813<br />
2012-2013 15,000 97,688<br />
2013-2014 20,000 96,375<br />
2014-2015 25,000 94,688<br />
2015-2016 30,000 92,625<br />
2017-2021 205,000 423,563<br />
2022-2026 380,000 316,125<br />
2027-2031 635,000 127,688<br />
Totals $ 1,325,000 $ 1,347,565<br />
Refunding Certificates of Participation, Series 1997<br />
Refunding Certificates of Participation (City Hall) Series 1997 in the original issue of<br />
$10,955,000, with a variable interest rate due through 2016, were issued to advance refund<br />
$10,180,000 of outstanding 1995 Certificates of Participation. The source of repayment for<br />
the Certificates is lease payments to be made by the <strong>Moreno</strong> <strong>Valley</strong> Public Facilities<br />
Financing Corporation whereby scheduled lease payments equal the amount of principal and<br />
interest due on the Certificates. The City has the option to convert the variable rate<br />
certificates at any time. The Refunding Certificates are subject to purchase on the demand of<br />
the holder while they are outstanding at a variable rate upon seven days notice. Payment of<br />
these demand certificates shall be made from the proceeds of the resale of such certificates<br />
by the City's remarketing agent. Should there be insufficient funds from this source, funds will<br />
be made available from an irrevocable bank letter of credit. The letter of credit is valid<br />
through the date the Certificates bear interest at a fixed rate or May 1, 2007. Repayment of<br />
the letter of credit shall occur from any available funds with the trustee of the issue, including<br />
54
Note 6: Long Term Debt (Continued)<br />
City of <strong>Moreno</strong> <strong>Valley</strong><br />
Notes to <strong>Financial</strong> Statements<br />
Year Ended June 30, 2011 (Continued)<br />
the scheduled lease payments of the City. In June 2011, the <strong>Moreno</strong> <strong>Valley</strong> Public Facilities<br />
Financing Authority refunded, on a current basis, the 1997 Certificates of Participation in a<br />
Private Placement refunding.<br />
2011 Private Placement Refunding, 1997 Certificates of Participation<br />
The 2011 Private Placement Refunding of the 1997 Certificates of Participation mature in<br />
serial fashion through November 1, 2016 and bear interest of 2.92%. The original amount of<br />
the issue was $4,343,500. The bonds are payable from lease payments made by the City<br />
under a project lease dated November 1, 1997 between the City and the <strong>Moreno</strong> <strong>Valley</strong><br />
Public Facilities Financing Corporation. The lease payments are equal to the principal and<br />
interest on the bonds and are made by the City for the rental use of the public safety building<br />
financed by the original 1997 Certificates of Participations issue. This issue is fully insured in<br />
the event of nonpayment by the City. These refinancing decreased aggregate debt service<br />
payments that were required by approximately $65,630. This refunding resulted in an<br />
economic gain of approximately $25,174. The outstanding balance at June 30, 2011 is<br />
$4,343,500.<br />
The annual debt service requirements for the 2011 Private Placement Refunding,<br />
1997 Certificates of Participation payable outstanding at June 30, 2011, are as follows:<br />
Lease Revenue Bonds, 1997<br />
2011 Private Placement<br />
Refunding, 1997 Certificates of<br />
Participation<br />
Principal Interest<br />
Year Ending June 30,<br />
2011-2012 $ 681,000 $ 106,318<br />
2012-2013 690,500 96,864<br />
2013-2014 710,500 76,409<br />
2014-2015 732,000 55,349<br />
2015-2016 753,500 33,660<br />
2017-2021 776,000 11,330<br />
Totals $ 4,343,500 $ 379,930<br />
Lease Revenue Bonds 1997 in the original issue amount of $5,300,000 were issued for the<br />
purpose of financing a portion of the cost of acquiring and constructing a public safety<br />
building for City use, to fund a reserve for the bonds and to pay issuance costs. The bonds<br />
mature in serial and term fashion through November 1, 2022 and bear interest ranging from<br />
4.15% to 5.50%. The bonds are subject to both optional and mandatory redemption prior to<br />
maturity beginning on November 1, 2007. The bonds are payable from lease, payments<br />
made by the City under a project lease dated November 1, 1997 between the City and the<br />
MVPFA. The lease payments are equal to the principal and interest on the bonds and are<br />
made by the City for the rental use of the public safety building financed by this bond issue.<br />
This issue is fully insured in the event of nonpayment by the City. In February 2011, the<br />
<strong>Moreno</strong> <strong>Valley</strong> Public Financing Authority refunded, on a current basis, the 1997 Lease<br />
Revenue Bonds in a Private Placement refunding.<br />
55
Note 6: Long Term Debt (Continued)<br />
City of <strong>Moreno</strong> <strong>Valley</strong><br />
Notes to <strong>Financial</strong> Statements<br />
Year Ended June 30, 2011 (Continued)<br />
2011 Private Placement Refunding, 1997 Lease Revenue Bonds<br />
The 2011 Private Placement Refunding bonds mature in serial and term fashion through<br />
November 1, 2022 and bear interest ranging from 5.2% to 5.5%. The original amount of the<br />
issue was $3,272,000. The bonds are payable from lease payments made by the City under<br />
a project lease dated November 1, 1997 between the City and the MVPFA. The lease<br />
payments are equal to the principal and interest on the bonds and are made by the City for<br />
the rental use of the public safety building financed by the original 1997 Lease Revenue<br />
bonds issue. This issue is fully insured in the event of nonpayment by the City. These<br />
refinancing decreased aggregate debt service payments that were required by approximately<br />
$731,963. This refunding resulted in an economic gain of approximately $171,743. The<br />
outstanding balance at June 30, 2011 is $3,272,000.<br />
The annual debt service requirements for the 2011 Private Placement Refunding,<br />
1997 Lease Revenue Bonds payable outstanding at June 30, 2011, are as follows:<br />
Lease Revenue Bonds, 2005<br />
2011 Private Placement<br />
Refunding, 1997 Lease<br />
Revenue Bonds<br />
Principal Interest<br />
Year Ending June 30,<br />
2011-2012 $ 261,000 $ 125,032<br />
2012-2013 222,000 115,420<br />
2013-2014 234,000 106,346<br />
2014-2015 241,000 96,893<br />
2015-2016 252,000 87,082<br />
2017-2021 1,413,000 273,884<br />
2022-2026 649,000 26,089<br />
Totals $ 3,272,000 $ 830,746<br />
Lease Revenue Bonds 2005 in the original issue amount of $48,205,000 were issued for the<br />
purpose of financing a portion of the cost of the expansion of the public safety building,<br />
electric utility infrastructure, construction of a fire station, various public works and<br />
redevelopment projects, to fund a reserve for the bonds and to pay issuance costs. Of the<br />
$48,205,000 originally issued, the portion for the electric utility infrastructure $4,910,000 has<br />
been separated and is shown as long-term debt for business-type activities. The bonds<br />
mature in serial and term fashion through November 1, 2035 and bear interest ranging from<br />
3% to 4.375%. The bonds are subject to both optional and mandatory redemption beginning<br />
November 1, 2006. The bonds are payable from lease payments made by the City under a<br />
project lease dated May 1, 1997, between the City and the MVPFA. The lease payments are<br />
equal to the principal and interest on the bonds and are made by the City as rent for use of<br />
the Public Safety Building and the City Hall. This issue is fully insured in the event of<br />
nonpayment by the City.<br />
56
Note 6: Long Term Debt (Continued)<br />
City of <strong>Moreno</strong> <strong>Valley</strong><br />
Notes to <strong>Financial</strong> Statements<br />
Year Ended June 30, 2011 (Continued)<br />
The annual debt service requirements for the Lease Revenue Bonds, 2005 payable<br />
outstanding at June 30, 2011, are as follows:<br />
Compensated Absences<br />
2005 Lease Revenue Bonds<br />
Principal Interest<br />
Year Ending June 30,<br />
2011-2012 $ 885,000 $ 1,758,466<br />
2012-2013 920,000 1,715,641<br />
2013-2014 970,000 1,670,691<br />
2014-2015 1,020,000 1,626,041<br />
2015-2016 1,050,000 1,579,390<br />
2017-2021 6,050,000 7,134,100<br />
2022-2026 7,585,000 5,561,355<br />
2027-2031 9,440,000 3,666,562<br />
2032-2036 11,740,000 1,327,813<br />
Totals $ 39,660,000 $ 26,040,059<br />
At June 30, 2011, the amount of compensated absences liability was $5,214,212. This<br />
amount consists of $4,686,168 for governmental funds, principally paid by the general fund,<br />
and $528,044 for internal service funds.<br />
Portable Classroom Loans<br />
In January 1999, the City entered into two agreements with the California Department of<br />
Education to finance the purchase and construction of two portable classrooms. Under the<br />
terms of the agreements, the City was granted two non-interest bearing loans totaling<br />
$246,585. The loans are payable in monthly installments of $2,055 beginning February 2001,<br />
for 10 years. These loans were fully repaid as of June 30, 2011.<br />
Note Payable - Price Company<br />
The Redevelopment Agency had recorded a long-term payable in the original amount of<br />
$2,433,744 under a development and disposition agreement and promissory note with Price<br />
Company for the reimbursement of costs of construction of a 130,000-square-foot retail store.<br />
The note bears interest at 8% per annum and is payable solely from 50% of site-generated<br />
sales tax. Any remainder payable after September 2015 will be forgiven. The amount<br />
outstanding as of June 30, 2011 was $1,736,067.<br />
RDA 2007 Tax Allocation Bonds Series A<br />
Redevelopment Agency 2007 Tax Allocation Bonds, Series A, in the original issue amount of<br />
$43,495,000 were issued in November 2007 for the purpose of financing various<br />
redevelopment activities and other undertakings permitted under the Redevelopment Law, to<br />
fund a reserve for the bonds and to pay issuance costs. The bonds mature in serial and term<br />
fashion through August 1, 2038 and bear interest ranging from 3.5% to 5.0%. The bonds are<br />
subject to both optional and mandatory redemption prior to maturity beginning on<br />
57
Note 6: Long Term Debt (Continued)<br />
City of <strong>Moreno</strong> <strong>Valley</strong><br />
Notes to <strong>Financial</strong> Statements<br />
Year Ended June 30, 2011 (Continued)<br />
August 1, 2017. The bonds are payable solely from Tax Increment Revenues and other<br />
funds and amounts pledged therefore pursuant to the Indenture. This issue is fully insured in<br />
the event of nonpayment by the Agency.<br />
The annual debt service requirements for the RDA 2007 Tax Allocation Bonds Series A<br />
payable outstanding at June 30, 2011, are as follows:<br />
Principal Interest<br />
Year Ending June 30,<br />
2011-2012 $ 210,000 $ 2,043,484<br />
2012-2013 220,000 2,034,884<br />
2013-2014 230,000 2,025,884<br />
2014-2015 230,000 2,017,259<br />
2015-2016 235,000 2,009,121<br />
2017-2021 1,290,000 9,898,475<br />
2022-2026 6,415,000 9,204,840<br />
2027-2031 10,040,000 7,187,818<br />
2032-2036 13,655,000 4,261,125<br />
2037-2041 9,950,000 762,500<br />
Debt Service Requirements<br />
RDA 2007 Tax Allocation Bonds<br />
Series A<br />
Totals $ 42,475,000 $ 41,445,390<br />
The Redevelopment Agency has pledged as security for tax allocation bonds it has issued a<br />
portion of the tax increment revenue that it receives. These bonds were to provide financing<br />
for various capital projects. The Agency has committed to appropriate each year from these<br />
resources amounts sufficient to cover the principal and interest requirements on the debt.<br />
Total principal and interest remaining on the debt is $83,920,390 with annual debt service<br />
requirements indicated above. For the current year, the total tax increment revenue<br />
recognized by the Redevelopment Agency was $17,614,795 and the debt service obligation<br />
on the bonds was $2,180,284.<br />
Conduit Debt<br />
The <strong>Moreno</strong> <strong>Valley</strong> Public Financing Authority issued $5,548,000 Assisted Living Housing<br />
Revenue Bonds, Series 2000A. The bonds and interest thereon are limited obligations of the<br />
issuer, payable solely from the revenues and the trust estate, which are assigned and<br />
pledged to such purposes. Consequently, no liability is reported in these accompanying<br />
financial statements. The outstanding balance at June 30, 2011 was $5,248,000.<br />
No-Commitment Debt<br />
The Community Facilities District No. 5 of the City of <strong>Moreno</strong> <strong>Valley</strong> 2007 Special Tax Bonds<br />
were issued to finance various public improvements needed to develop property located<br />
within the Community Facilities District No. 5 (“District”). The original issue amount was<br />
$5,870,000. The Bonds are special limited obligations of the District and are payable solely<br />
from revenues derived from certain annual Special Taxes to be levied on and collected from<br />
58
Note 6: Long Term Debt (Continued)<br />
City of <strong>Moreno</strong> <strong>Valley</strong><br />
Notes to <strong>Financial</strong> Statements<br />
Year Ended June 30, 2011 (Continued)<br />
the owners of the taxable land within the District and from certain other funds pledged under<br />
the Fiscal Agent Agreement dated May 1, 2007 by and between the City for and on behalf of<br />
the District and Wells Fargo Bank, National Association, as fiscal agent. The Special Taxes<br />
are to be levied according to the rates and method of apportionment approved by the City<br />
Council, the legislative body of the District, and the qualified electors within the District.<br />
Except for the Special Taxes, no other taxes are pledged to the payment of the Bonds. The<br />
City is in no way liable for repayment but is acting as an agent for the property owners in<br />
collecting the assessments and forwarding the collections to bondholders. Interest on the<br />
Bonds will be payable on September 1, 2007 and semiannually thereafter on each March 1<br />
and September 1 thru 2037. Interest rates range from 4.00% to 5.00%. Principal on the<br />
Bonds is due each September 1 beginning 2009 and ending 2037. The outstanding balance<br />
at June 30, 2011 was $5,805,000.<br />
Changes in Long-Term Debt - Business-Type Activities<br />
The following is a schedule of changes in business-type activities long-term debt of the<br />
entity for the fiscal year ended June 30, 2011:<br />
Balance<br />
Balance Due Within One<br />
July 1, 2010 Additions Deletions June 30, 2011 Year<br />
Electrical Cabinet Capital Leases $ 36,404 $ - $ 33,922 $ 2,482 $ 2,482<br />
Lease Revenue Bonds, 2005<br />
4,910,000<br />
- 100,000 4,810,000 105,000<br />
Lease Revenue Bonds, 2007<br />
25,375,000<br />
- 405,000 24,970,000 430,000<br />
Less Deferred Issuance (295,516)<br />
- (10,945) (284,571)<br />
-<br />
Compensated Absences<br />
32,789<br />
- 18,505<br />
14,284<br />
14,284<br />
Totals<br />
$ 30,058,677 $ - $ 546,482 $ 29,512,195 $ 551,766<br />
Electrical Cabinets Capital Lease<br />
Between January 2004 and August 2006, the City entered into nine separate lease purchase<br />
agreements to lease electrical cabinets in the amount of $65,000 each. The term of each<br />
lease is for 60 months. The outstanding balance as of June 30, 2011 was $2,482.<br />
The annual debt service requirements for the Electrical Cabinets Capital Lease payable<br />
outstanding at June 30, 2011, are as follows:<br />
Electrical Cabinets Capital<br />
Lease<br />
Year Ending<br />
June 30, Principal Interest<br />
2011-2012 $ 2,482 $ 18<br />
59
Note 6: Long Term Debt (Continued)<br />
Lease Revenue Bonds, 2005<br />
City of <strong>Moreno</strong> <strong>Valley</strong><br />
Notes to <strong>Financial</strong> Statements<br />
Year Ended June 30, 2011 (Continued)<br />
Lease Revenue Bonds 2005 in the original issue amount of $48,205,000 were issued for the<br />
purpose of financing a portion of the cost of the expansion of the public safety building,<br />
electric utility infrastructure, construction of a fire station, various public works and<br />
redevelopment projects, to fund a reserve for the bonds and to pay issuance costs. Of the<br />
$48,205,000 originally issued, the portion for the electric utility infrastructure ($5,105,000)<br />
has been separated and is shown as long-term debt for business-type activities. The bonds<br />
mature in serial and term fashion through November 1, 2035 and bear interest ranging from<br />
3% to 4.375%. The bonds are subject to both optional and mandatory redemption beginning<br />
November 1, 2006. The bonds are payable from lease payments made by the City under a<br />
project lease dated May 1, 1997, between the City and the MVPFA. The lease payments are<br />
equal to the principal and interest on the bonds and are made by the City as rent for use of<br />
the Public Safety Building and the City Hall. This issue is fully insured in the event of<br />
nonpayment by the City.<br />
The annual debt service requirements for the Lease Revenue Bonds, 2005 payable<br />
outstanding at June 30, 2011, are as follows:<br />
Lease Revenue Bonds, 2007<br />
Lease Revenue Bonds, 2005<br />
Principal Interest<br />
Year Ending June 30,<br />
2011-2012 $ 105,000 $ 213,337<br />
2012-2013 110,000 208,237<br />
2013-2014 120,000 202,762<br />
2014-2015 125,000 197,262<br />
2015-2016 130,000 191,513<br />
2017-2021 735,000 864,713<br />
2022-2026 915,000 674,273<br />
2027-2031 1,150,000 433,094<br />
2032-2036 1,420,000 160,781<br />
Totals $ 4,810,000 $ 3,145,972<br />
Lease Revenue Bonds 2007 (Taxable) in the original issue amount of $25,765,000 were<br />
issued for the purpose of financing a City-owned 115kV to 12kV substation, an 115kV to<br />
12kV switchyard adjacent to the substation, and other infrastructure improvements to support<br />
planned growth of the City-owned electrical distribution system. The bonds mature in serial<br />
and term fashion through May 1, 2038 and bear interest ranging from 5.084% to 5.75%. The<br />
bonds are subject to both optional and mandatory redemption beginning May 1, 2017. The<br />
bonds are payable from lease payments made by the City under a project lease dated<br />
May 1, 2007, between the City and the MVPFA. The lease payments are equal to the<br />
principal and interest on the bonds and are made by the City as rent for use of the 115kV to<br />
12kV substation. This issue is fully insured in the event of nonpayment by the City.<br />
60
Note 6: Long Term Debt (Continued)<br />
City of <strong>Moreno</strong> <strong>Valley</strong><br />
Notes to <strong>Financial</strong> Statements<br />
Year Ended June 30, 2011 (Continued)<br />
The annual debt service requirements for the Lease Revenue Bonds, 2007 payable<br />
outstanding at June 30, 2011, are as follows:<br />
Compensated Absences<br />
Lease Revenue Bonds, 2007<br />
Principal Interest<br />
Year Ending June 30,<br />
2011-2012 $ 430,000 $ 1,401,383<br />
2012-2013 450,000 1,379,522<br />
2013-2014 475,000 1,356,644<br />
2014-2015 495,000 1,332,495<br />
2015-2016 520,000 1,307,329<br />
2017-2021 3,055,000 6,093,384<br />
2022-2026 3,995,000 5,150,414<br />
2027-2031 5,245,000 3,899,208<br />
2032-2036 6,940,000 2,209,150<br />
2037-2041 3,365,000 292,963<br />
Totals $ 24,970,000 $ 24,422,492<br />
At June 30, 2011, the amount of compensated absences liability totaled $14,284. Based on<br />
the current trend of usage, this entire amount is expected to be paid within one year.<br />
Note 7: Interfund Receivables, Payables and Transfers<br />
a. Due To/From Other Funds<br />
Due To Other Funds<br />
Community<br />
Redevelopment Nonmajor Electric<br />
Due From CSD Agency Debt Governmental Enterprise<br />
Other Funds Zones Service Fund Funds Fund Total<br />
General Fund $ 3,305,681 $ 9,378 $ 3,120,739 $ 294,102 $ 6,729,900<br />
The City of <strong>Moreno</strong> <strong>Valley</strong> utilizes the State of California Local Agency Investment Fund<br />
(LAIF) as a short-term investment tool. In June 2006, the General Fund LAIF account<br />
reached the LAIF threshold and as an alternative for investing, the remaining funds were<br />
loaned to the CSD Zones Fund. The amounts of the loans outstanding at June 30, 2011<br />
were $3,305,681.<br />
The General Fund made a short-term loan of $9,378 to the Community Redevelopment<br />
Agency Debt Service Fund for interest changes that were not yet paid as of year-end.<br />
61
City of <strong>Moreno</strong> <strong>Valley</strong><br />
Notes to <strong>Financial</strong> Statements<br />
Year Ended June 30, 2011 (Continued)<br />
Note 7: Interfund Receivables, Payables and Transfers (Continued)<br />
The General Fund has made short-term loans to the following funds to eliminate negative<br />
cash balances:<br />
Nonmajor Governmental Funds<br />
Law Enforcement Fund $ 144,494<br />
Community Development Block Grant Fund 506,963<br />
Used Oil Recycling Fund 25,413<br />
Storm Water Maintenance Fund 76,936<br />
Neighborhood Stabilization Grant Fund 365,929<br />
Automall Capital Administration 3,364<br />
ASES Program Grant 394,048<br />
CDBG Recovery Act of 2009 113,966<br />
Other Grants Fund 114,419<br />
TUMF Capital Projects 723,398<br />
Auto Mall Special Tax Bonds 216,764<br />
2007 Towngate Refunding 435,045<br />
Total Nonmajor Governmental Funds $ 3,120,739<br />
Electric Enterprise Fund $ 294,102<br />
b. Advances To/From Other Funds<br />
Advances From Other Funds<br />
Community<br />
Redevelopment Electric<br />
Agency Debt Enterprise<br />
Advances To Other Funds CSD Zones Service Fund Fund Total<br />
General Fund<br />
Community Redevelopment<br />
$ 51,700 $ 34,221,086 $ - $ 34,272,786<br />
Agency Capital Project Fund<br />
Community Redevelopment<br />
-<br />
3,386,697<br />
- 3,386,697<br />
Agency Debt Service Fund -<br />
- 189,000 189,000<br />
Nonmajor Governmental -<br />
- 580,657 580,657<br />
Total $ 51,700 $ 37,607,783 $ 769,657 $ 38,429,140<br />
The long-term payable to the General Fund from the Community Redevelopment Agency<br />
Debt Service Fund includes $652,248 representing monies borrowed in prior fiscal years<br />
by the Agency to finance redevelopment activities. The monies loaned to the Agency<br />
bear an interest rate of 12%. Repayment of the long-term payable will be made when<br />
funds becomes available. At June 30, 2011, accrued interest amounts to $297,030.<br />
The City purchased the Towngate Regional Mall - Department Store Parcel Acquisition<br />
Notes for $5,000,000. The notes, totaling $13,000,000, originate from a participation<br />
agreement (as amended) whereby the Community Redevelopment Agency acquired<br />
certain parcels within the mall for subsequent transfer to major tenants. The notes bear<br />
interest at 7.25% and are payable solely from available site-generated property tax<br />
increment and up to 50% of site-generated sales tax. Furthermore, the Community<br />
Redevelopment Agency has covenanted to use reasonable best efforts to refinance<br />
these notes with Tax Allocation Bonds, provided such financing is determined to be<br />
fiscally feasible. At June 30, 2011, accrued interest amounts to $2,200,727.<br />
62
City of <strong>Moreno</strong> <strong>Valley</strong><br />
Notes to <strong>Financial</strong> Statements<br />
Year Ended June 30, 2011 (Continued)<br />
Note 7: Interfund Receivables, Payables and Transfers (Continued)<br />
The Community Redevelopment Agency purchased improved property from the City –<br />
the Conference and Recreation Center. The purchase price was $14,203,946. The loan<br />
note is $11,474,822 after the initial payments of $2,700,000 and $29,124. The term is<br />
20 years with 12% simple interest. The Agency will make interest only annual payments<br />
with a balloon payment due at the end of the term. At June 30, 2011, accrued interest<br />
amounts to $6,596,258.<br />
Community Redevelopment Agency 2007 Series B, Subordinate Taxable Tax Allocation<br />
Bonds in the original issue amount of $22,500,000 were issued in November 2007. All of<br />
the bonds were purchased by the General Fund. The proceeds of the bonds were<br />
unspent pending the outcome of litigation between the Agency and the County of<br />
Riverside concerning the interpretation of a pass-through agreement between the Agency<br />
and the County. However, the Agency was unsuccessful in its litigation, and the entire<br />
balance of the loan was repaid as June 30, 2011.<br />
In June 2007, The Community Redevelopment Agency Capital Projects Fund, Low and<br />
Moderate Income Housing, advanced to the Community Redevelopment Agency Debt<br />
Service Fund, Tax Increment, $4,157,976 to finance the purchase of certain properties.<br />
Repayments will be made annually based on the Agency’s approximate average<br />
investment returns on monies. The outstanding balance as of June 30, 2011 is<br />
$3,386,697.<br />
The Community Redevelopment Agency Debt Service Fund advanced $300,000 to the<br />
Electric Fund for construction of electrical infrastructure. The loan has a ten year term<br />
and a five percent annual interest rate. The outstanding balance as of June 30, 2011 is<br />
$189,000.<br />
The Special Districts Administration Fund has loaned $580,657 to the Electric Fund for<br />
start-up costs. The loan will be repaid when revenue becomes available.<br />
c. Interfund Transfers<br />
Transfers In<br />
Community<br />
Redevelopment Nonmajor Electric<br />
General CSD Agency Capital Governmental Enterprinse Internal<br />
Transfers Out Fund Zones Projects Fund Funds Fund Service Funds Total<br />
General Fund<br />
Development Impact<br />
$ - $ 1,471,953 $ - $ 1,133,565 $ - $ - $ 2,605,518<br />
Fees<br />
Community Redevelopment<br />
Debt Service<br />
-<br />
-<br />
- 4,084,493<br />
-<br />
- 4,084,493<br />
Fund<br />
Nonmajor Governmental<br />
-<br />
-<br />
595,863 2,285,357<br />
-<br />
- 2,881,220<br />
Funds<br />
Internal Service<br />
773,051 115,291<br />
- 8,445,984 107,841<br />
- 9,442,167<br />
Funds -<br />
-<br />
-<br />
89,820<br />
- 1,174,505 1,264,325<br />
Total $ 773,051 $ 1,587,244 $ 595,863 $ 16,039,219 $ 107,841 $ 1,174,505 $ 20,277,723<br />
63
City of <strong>Moreno</strong> <strong>Valley</strong><br />
Notes to <strong>Financial</strong> Statements<br />
Year Ended June 30, 2011 (Continued)<br />
Note 7: Interfund Receivables, Payables and Transfers (Continued)<br />
The General Fund transferred a total of $2,605,518 to several funds to provide subsidies to<br />
cover the operating deficits.<br />
The Development Impact Fees Fund transferred a total of $4,084,493 to nonmajor<br />
governmental funds for debt service payments and provide support for several capital<br />
projects in the fiscal year.<br />
The Community Redevelopment Agency Debt Service Fund transferred a total of $2,285,357<br />
for debt service payments in the fiscal year. Additionally, the Community Redevelopment<br />
Agency Debt Service Fund transferred $595,863 to the Community Redevelopment Agency<br />
Capital Projects Fund for administrative costs.<br />
Note 8: Employee Pension Plan<br />
Plan Description<br />
The City's defined benefit pension plan, Public Employees Retirement System (PERS),<br />
provides retirement and disability benefits, annual cost-of-living adjustments and death<br />
benefits to plan members and beneficiaries. PERS is part of the Public Agency portion of<br />
the California Public Employees Retirement System (CalPERS), an agent<br />
multiple-employer plan administered by CalPERS, which acts as a common investment<br />
and administrative agent for participating public employers within the State of California.<br />
A menu of benefit provisions, as well as other requirements, is established by state<br />
statutes within the Public Employees' Retirement Law. The City selects optional benefit<br />
provisions from the benefit menu by contract with CalPERS and adopts those benefits<br />
through local ordinance. CalPERS issues a separate comprehensive annual financial<br />
report. Copies of the CalPERS annual financial report may be obtained from the<br />
CalPERS Headquarters, 400 Q Street, Sacramento, California 95811.<br />
Funding Policy<br />
Active plan members in PERS are required to contribute 8.00% of their annual covered<br />
salary as of January 2008. The City is required to contribute the actuarially determined<br />
remaining amounts necessary to fund the benefits for its members. The actuarial<br />
methods and assumptions used are those adopted by the CalPERS Board of<br />
Administration. The required employer contribution rate is 15.505% for fiscal year<br />
2010-2011. The contribution requirements of the plan members are established by state<br />
statute and the employer contribution rate is established and may be amended by<br />
CalPERS.<br />
Annual Pension Cost<br />
For fiscal year 2010-2011, the City's annual pension cost was $5,214,878. The City also<br />
contributed $78,226 on behalf of the employees for the employee contribution. The<br />
required contribution for the fiscal year 2010-2011 was determined as part of the<br />
June 30, 2008 actuarial valuation using the entry age normal actuarial cost method with<br />
the contributions determined as a percent of pay. The actuarial assumptions included:<br />
a) 7.75% investment rate of return (net of administrative expenses), b) projected salary<br />
increases for employees that vary by duration of service ranging from 3.25% to 14.45%<br />
for miscellaneous members, and c) 3.25% cost-of-living adjustment. Both a) and<br />
b) include an inflation component of 3.00%. The actuarial value of PERS assets was<br />
determined using a technique that smoothes the effect of short-term volatility in the fair<br />
value of investments over a 15-year period. The PERS unfunded actuarial accrued<br />
64
Note 8: Employee Pension Plan (Continued)<br />
City of <strong>Moreno</strong> <strong>Valley</strong><br />
Notes to <strong>Financial</strong> Statements<br />
Year Ended June 30, 2011 (Continued)<br />
liability (or excess assets) is being amortized as a level percentage of projected payroll<br />
on a closed basis. The remaining amortization period at June 30, 2011 was 24 years.<br />
Pension Cost Percentage of APC Pension<br />
Ended June 30, (APC)<br />
Contributed Obligation<br />
2009 $ 4,438,856<br />
100% $<br />
-<br />
2010 5,233,518<br />
100% -<br />
2011 5,214,878<br />
100% -<br />
Required Supplementary Information – Funded Status of Plan<br />
Latest Information Available<br />
Entry Age<br />
Normal<br />
Annual UAAL as<br />
Accrued Actuarial Value Unfunded<br />
Covered Percent of<br />
Valuation Date Liability of Assets Liability Funded Ratio Payroll Payroll<br />
06/30/08 $ 90,939,749 $ 69,197,682 $ 21,742,067<br />
76.1% $ 30,739,388<br />
70.7%<br />
06/30/09 109,758,482 78,175,287 31,583,195<br />
71.2% 26,384,952 119.7%<br />
06/30/10 120,692,084 85,693,181 34,998,903<br />
71.0% 23,670,851 147.9%<br />
The Funded Status of Plan schedule above shows the recent history of the actuarial value of<br />
assets, actuarial accrued liability, their relationship, and the relationship of the unfunded<br />
actuarial accrued liability to payroll. The Funded Status of Plan schedule, presented above,<br />
presents multiyear trend information about whether the actuarial value of plan assets is<br />
increasing or decreasing over time relative to the actuarial accrued liability for benefits.<br />
Note 9: Other Post Employment Benefits (OPEB)<br />
Plan Description<br />
The City's defined benefit postemployment healthcare plan provides a portion of certain<br />
health care for retired employees. In accordance with City policy, employees who retire<br />
directly from the City under CalPERS (age 50 and 5 years of CalPERS service or<br />
disability) and are not temporary employees, are eligible for these benefits. In<br />
June 2009, the City established an irrevocable trust fund to begin funding the City’s<br />
unfunded liability through the California Employers’ Retiree Benefit Trust (CERBT), an<br />
agent multiple-employer plan administered by California Public Employees’ Retirement<br />
System (CalPERS), which acts as a common investment and administrative agent for<br />
participating public employers within the State of California. A menu of benefit provisions,<br />
as well as other requirements, are established by state statutes within the Public<br />
Employees' Retirement Law. The City selects optional benefit provisions from the benefit<br />
menu by contract with CalPERS and adopts those benefits through local ordinance.<br />
CalPERS issues a separate comprehensive annual financial report. Copies of the<br />
CalPERS annual financial report may be obtained from the CalPERS Headquarters,<br />
400 Q Street, Sacramento, California 95811.<br />
Funding Policy<br />
The contribution requirements of plan members and the City are established and may be<br />
amended by City Council. The City is required to contribute the Annual Required<br />
Contribution (ARC) of the employer, an amount actuarially determined in accordance with<br />
the parameters of GASB Statement 45. The ARC represents a level of funding that, if<br />
paid on an ongoing basis, is projected to cover normal cost each year and amortize any<br />
unfunded actuarial liabilities over a period not to exceed thirty years. The current ARC<br />
rate is 7.75% of the annual covered payroll.<br />
65
City of <strong>Moreno</strong> <strong>Valley</strong><br />
Notes to <strong>Financial</strong> Statements<br />
Year Ended June 30, 2011 (Continued)<br />
Note 9: Other Post Employment Benefits (OPEB) (Continued)<br />
Annual OPEB Cost<br />
For fiscal year 2010-2011, the City’s annual OPEB cost was $1,564,000. The required<br />
contribution for the fiscal year was determined as part of the January 1, 2010 actuarial<br />
valuation using the entry age normal actuarial cost method. The actuarial assumptions<br />
included: a) 7.75% investment rate of return (net of administrative expenses), and<br />
b) projected salary increases for employees of 3.25%, and c) an annual healthcare cost<br />
increase of 4.5%. Both a) and b) include an inflation component of 3.00%. The<br />
amortization method is the level percent of payroll. The amortization period is a 30 year<br />
fixed (closed) period for the initial unfunded accrued actuarial liability. There are 27 years<br />
remaining as of June 30, 2011.<br />
The following table shows the components of the City’s annual OPEB cost for the year,<br />
the amount actually contributed to the plan, and changes in the City’s net OPEB<br />
obligation for these benefits:<br />
Annual OPEB cost (expense) $ 1,564,000<br />
Contributions (including premiums/benefits paid) (1,564,000)<br />
Increase in net OPEB obligation -<br />
Net OPEB obligation - beginning of year -<br />
Net OPEB obligation - end of the year $ -<br />
Actuarial valuations of an ongoing plan involve estimates of the value of reported<br />
amounts and assumptions about the probability of occurrence of events far into the<br />
future. Examples include assumptions about future employment, mortality, and the<br />
healthcare cost trend. Amounts determined regarding the funded status of the plan and<br />
the annual required contributions of the employer are subject to continual revision as<br />
actual results are compared with past expectations and new estimates are made about<br />
the future. The schedule of funding progress, presented as required supplementary<br />
information on the next page, presents multi-year trend information about whether the<br />
actuarial value of plan assets is increasing or decreasing over time relative to the<br />
actuarial accrued liabilities for the benefits.<br />
Actuarial Methods and Assumptions<br />
Projections of benefits for financial reporting purposes are based on the substantive plan<br />
(the plan as understood by the employer and the plan members) and include the types of<br />
benefits provided at the time of each valuation and the historical pattern of sharing the<br />
benefit costs between employer and plan members to that point. The actuarial methods<br />
and assumptions used include techniques that are designed to reduce the efforts of<br />
short-term volatility in actuarial accrued liabilities and the actuarial assets, consistent with<br />
the long-term perspective of the calculations.<br />
The City’s annual OPEB cost, the percentage of annual OPEB cost contributed to the<br />
plan, and the net OPEB obligation for the current and two preceding fiscal years were as<br />
follows:<br />
Fiscal Year Annual OPEB<br />
Percentage of<br />
OPEB Cost Net OPEB<br />
Ending Cost (AOC) Contributed Obligation<br />
06/30/09 $ 1,785,573 100% $ -<br />
06/30/10 1,425,000 100% -<br />
06/30/11 1,564,000 100% -<br />
66
City of <strong>Moreno</strong> <strong>Valley</strong><br />
Notes to <strong>Financial</strong> Statements<br />
Year Ended June 30, 2011 (Continued)<br />
Note 9: Other Post Employment Benefits (OPEB) (Continued)<br />
Required Supplementary Information – Funded Status of Plan<br />
Latest Information Available<br />
Actuarial<br />
Annual UAAL as<br />
Accrued Actuarial Value Unfunded Funded Covered Percent of<br />
Valuation Date Liability of Assets Liability Ratio<br />
Payroll Payroll<br />
06/30/08 $ 9,338,000 $ - $ 9,338,000<br />
0.0% $ 29,794,978<br />
31.3%<br />
01/01/10 13,600,000 2,386,000 11,214,000 17.6% 22,465,000<br />
49.9%<br />
Note 10: Fund Equity and Net Asset Restatements<br />
Beginning Fund Balance and Net Assets has been restated as follows:<br />
Note 11: Fund Deficits<br />
Nonmajor Governmental Funds:<br />
State Gasoline Tax<br />
To restate the gas tax receivable that<br />
was overstated from prior fiscal years $ (239,074)<br />
Child Care Grant<br />
To correct program revenue<br />
relating to the prior fiscal year. (4,185)<br />
Total Fund Balance and<br />
Net Asset Restatements $ (243,259)<br />
The following funds contained a deficit fund balance as of June 30, 2011:<br />
Major Governmental Funds:<br />
Community Redevelopment<br />
Agency Debt Service $ 33,003,719<br />
Non-Major Governmental Funds:<br />
Special Revenue Funds:<br />
Law Enforcement 196<br />
Child Care Grant Fund 18,325<br />
Neighborhood Stabilization Program 517,250<br />
Homelesness Prevention Program 11,656<br />
Capital Projects Funds:<br />
Auto Mall Capital/Administration 3,364<br />
TUMF Capital Projects 210,834<br />
The Community Redevelopment Agency Debt Service deficit fund balance is a result of the<br />
accumulation of advances from the General Fund for operating and capital expenditures.<br />
The Law Enforcemnt, Child Care Grant, Neighborhood Stabilization Program, Homelessness<br />
Prevention Program, Auto Mall Capital/Administration, and TUMF Capital Projects Funds<br />
deficit fund balances are a result of reimbursement monies not yet received.<br />
67
City of <strong>Moreno</strong> <strong>Valley</strong><br />
Notes to <strong>Financial</strong> Statements<br />
Year Ended June 30, 2011 (Continued)<br />
Note 12: Expenditures In Excess of Appropriation<br />
Excess of expenditures over appropriations in departments of individual funds are as follows:<br />
Final Budget Expenditures Excess<br />
General Fund:<br />
Emergency operations/volunteer<br />
Measure A Special Revenue Fund:<br />
$ 609,566 $ 610,084 $ 518<br />
Public works<br />
Other Grants Special Revenue Fund:<br />
1,574,347 2,014,016 439,669<br />
Public safety 50,950<br />
69,451<br />
18,501<br />
Community development<br />
Air Quality Management Special Revenue Fund:<br />
18,286<br />
20,813<br />
2,527<br />
Public works<br />
Housing Assistance Programs Special Revenue Fund:<br />
207,181 243,276<br />
36,095<br />
Capital outlay<br />
Traffic Congestion Relief Special Revenue Fund:<br />
64,742<br />
65,956<br />
1,214<br />
Public works<br />
FHWA TRANSIMS Special Revenue Fund:<br />
-<br />
61,650<br />
61,650<br />
Public works<br />
Civil Penalties Special Revenue Fund:<br />
38,717<br />
53,047<br />
14,330<br />
Community development<br />
Disaster Special Revenue Fund:<br />
17,600<br />
19,905<br />
2,305<br />
Public safety<br />
Public Works Capital Projects Fund:<br />
-<br />
55,796<br />
55,796<br />
Public works<br />
Fire Services Capital Projects Fund:<br />
-<br />
13,216<br />
13,216<br />
Public safety<br />
Towngate Capital/ Administration Capital Projects Fund:<br />
-<br />
11,212<br />
11,212<br />
Public works<br />
Auto Mall Capital/ Administration Capital Projects Fund:<br />
183,800 188,508<br />
4,708<br />
Public works<br />
Parks and Communtiy Services Capital Projects Fund:<br />
61,900 138,508<br />
76,608<br />
Community and cultural -<br />
23,393<br />
23,393<br />
Public works<br />
TUMF Capital Projects Fund:<br />
-<br />
1,936<br />
1,936<br />
Public works<br />
DIF Capital Projects Fund:<br />
-<br />
1,007<br />
1,007<br />
Public works<br />
Community Redevelopment Agency Debt Service Fund<br />
- 141,978 141,978<br />
Principal retirement 130,000 417,583 287,583<br />
Interest and fiscal charges<br />
OPA Sales Tax Agreements Debt Service Fund:<br />
3,660,590 4,988,814 1,328,224<br />
Interest and fiscal charges<br />
City Hall COPs Series 1997 Debt Service Fund:<br />
350,000 449,473<br />
99,473<br />
Principal retirement<br />
CFD #5 Stoneridge Debt Service Fund:<br />
615,000 4,875,000 4,260,000<br />
Principal retirement 205,000 3,705,000 3,500,000<br />
Interest and fiscal charges<br />
2007 Towngate Improvement Refunding Debt Service Fund:<br />
199,200 202,216<br />
3,016<br />
Interest and fiscal charges<br />
2007 Towngate Refunding Debt Service Fund:<br />
160,300 160,375<br />
75<br />
Interest and fiscal charges 382,500 382,569<br />
69<br />
68
Note 13: Commitments and Contingencies<br />
Riverside County Agreements<br />
City of <strong>Moreno</strong> <strong>Valley</strong><br />
Notes to <strong>Financial</strong> Statements<br />
Year Ended June 30, 2011 (Continued)<br />
During December 1987, the City of <strong>Moreno</strong> <strong>Valley</strong> and the Community Redevelopment<br />
Agency (Agency) entered into an agreement (the “County Agreement”) with the County of<br />
Riverside which provided, in part, that the Agency make certain payments to the County. The<br />
County Agreement generally provides for the Agency to make payments to the County upon<br />
achievement by the Agency of $7 million annually of tax increment revenue. Once the<br />
$7 million threshold is reached, the County Agreement generally provides that the Agency will<br />
make payment to the County of an amount equal to tax increment revenues between<br />
$7 million annually and $12 million annually, and half of such revenues in excess of<br />
$12 million. The County Agreement further provides that when total tax increment paid to the<br />
County under this agreement from increments between $7 million and $12 million reaches<br />
$75 million, tax increment in excess of $7 million annually will be split equally between the<br />
Agency and County.<br />
Beginning in 2003-2004 the Agency's tax increment exceeded $7 million. However, the<br />
County did not notify the Agency to such effect. In 2006-07, the Auditor Controller withheld a<br />
portion of the Agency’s 2006-07 tax increment in the amount of $1,092,287.59. The Agency<br />
disputes the authority of the County to withhold such funds and the matter, as well as other<br />
issues concerning the County Agreement, is currently the subject of litigation involving the<br />
County and the Agency.<br />
During April 1988, the City of <strong>Moreno</strong> <strong>Valley</strong> and the Agency entered into an agreement (the<br />
“Flood Agreement”) with the Riverside County Flood Control and Water Conservation District<br />
(District), which provides generally that the Agency shall receive 100% of the District’s share<br />
of the tax increment until such time the total tax increment exceeds $12 million at which time<br />
the District shall receive at least 50% of its share. Under the Flood Agreement, the Agency is<br />
to demonstrate, as more particularly provided in the Flood Agreement, that the cumulative<br />
project costs paid by the Agency for the project improvements exceed the cumulative total of<br />
District share received by the Agency. To the extent that the cumulative project costs paid by<br />
the Agency exceed the cumulative total of District share received by the Agency, the Agency<br />
may retain the balance needed from the remaining 50% of the District share. Beginning in<br />
2005-06, the Agency’s tax increment exceeded $12 million, with remittance not having been<br />
made of amounts to the District. The financial statements show the amount of $5,639,404<br />
(the amount that was not remitted to the District) as Due to Other Governments.<br />
Community Facilities District No. 3 Agreement<br />
In conjunction with the issue of the <strong>Moreno</strong> <strong>Valley</strong> Auto Mall Special Tax Bonds Series 2000<br />
(Auto Mall Refinancing), the Community Redevelopment Agency and the City are parties to<br />
an owner-participation agreement which provides that the Agency will transmit to the<br />
Community Facilities District No. 3 (District) the available property tax increment it receives<br />
on parcels within the District as a credit against the special parcel taxes that otherwise would<br />
be payable by the owners. Furthermore, the City has agreed to loan the Agency available<br />
sales tax generated within the District for payment directly to the parcel owners should the<br />
increment be insufficient to offset the special parcel taxes. In addition, the Agency has agreed<br />
to pay to the parcel owners, subject to certain restrictions, certain available surplus sales tax<br />
from within the District. The obligations to remit sales tax terminate by December 1, 2010.<br />
This agreement replaces a previous arrangement involving these parcels when they were<br />
included in Community Facilities District No. 2.<br />
69
City of <strong>Moreno</strong> <strong>Valley</strong><br />
Notes to <strong>Financial</strong> Statements<br />
Year Ended June 30, 2011 (Continued)<br />
Note 13: Commitments and Contingencies (Continued)<br />
The amounts remitted during the year under the replacement and previous agreement to<br />
parcel owners totaled $105,800.<br />
Community Facilities District No. 87-1 Agreement<br />
In connection with the issuance of the Community Facilities District No. 87-1 (CFD) Towngate<br />
2007 Special Tax Refunding Bonds, the Community Redevelopment Agency entered into an<br />
owner participation agreement whereby the Agency has committed tax increment for the<br />
payment of debt service requirements for these Bonds.<br />
Other Agreements<br />
On May 10, 2005, the Community Redevelopment Agency and the Community Services<br />
District entered into a lease agreement for the Conference and Recreation Center. The<br />
Community Services District occupied the building during June 2005 although construction<br />
was still in progress. Upon completion of construction during fiscal year 2005-2006 the lease<br />
agreement became effective for a base rent of $1.00 per month. The Community Services<br />
District has responsibility for facility maintenance and provides programming that serves the<br />
residents of the Project Area.<br />
Self-Insurance Pool<br />
The City is a member of CSAC Excess Insurance Authority. The Authority is a member<br />
directed joint powers insurance pool, which has been operational since October of 1979. The<br />
purpose of the Authority is to arrange and administer programs for the pooling of self-insured<br />
losses, to purchase excess insurance or reinsurance, and to arrange for group-purchased<br />
insurance for property and other coverage.<br />
The City participates in the excess workers' compensation and employer's liability programs<br />
of the Authority. For workers’ compensation the City has a self-insured retention of $300,000<br />
per occurrence. For employer’s liability the City has a self-insured retention of $250,000 per<br />
occurrence. The City has a pooled retention of $5,000,000 each occurrence, a $45,000,000<br />
reinsurance layer in excess of the $5,000,000 pooled retention per occurrence for workers'<br />
compensation claims, and a $5,000,000 employer's liability reinsurance layer per occurrence<br />
in excess of the $5,000,000 pooled retention.<br />
During the past three fiscal years, none of the above programs of protection have had<br />
settlements or judgments that exceeded pooled or insured coverage. There has been no<br />
significant reduction in pooled or insured liability coverage from coverage in the prior year.<br />
Self-Insurance Payable<br />
The City is exposed to various risks of loss related to torts; theft of, damage to and<br />
destruction of assets; errors and omissions; and injuries to employees. The City established<br />
two self-insurance funds (Internal Service Funds) to account for and finance its uninsured<br />
risks of loss. Under this program, the self-insurance funds provide coverage for up to a<br />
maximum of $300,000 for each workers' compensation claim and $250,000 for each general<br />
liability claim. The City purchases commercial insurance for claims in excess of coverage<br />
provided by the funds and for all other risks of loss. Settled claims have not exceeded this<br />
commercial coverage in any of the past three years. All funds of the City participate in the<br />
program and make payments to the self-insurance funds based on actuarial estimates of the<br />
amounts needed to pay prior and current year claims.<br />
70
City of <strong>Moreno</strong> <strong>Valley</strong><br />
Notes to <strong>Financial</strong> Statements<br />
Year Ended June 30, 2011 (Continued)<br />
Note 13: Commitments and Contingencies (Continued)<br />
The fund establishes claims liabilities based on estimates of the ultimate cost of claims<br />
(including future claim adjustment expenses) that have been reported but not settled, and of<br />
claims that have been incurred but not reported. The City has accrued for its anticipated<br />
liability with respect to claims filed and claims incurred but not reported to the City as of<br />
year-end. The accruals are in the amounts of $1,983,000 and $1,444,000 for the workers'<br />
compensation claims and general liability claims, respectively, for a total of $3,427,000. Of<br />
these amounts, the current year’s adjustment is a decrease of $193,000.<br />
A reconciliation of changes in aggregate liabilities for claims for the current fiscal year and the<br />
prior fiscal year is as follows:<br />
General Liability<br />
Workers'<br />
Compensation Total<br />
Amount of accrued claims at June 30, 2009 $ 1,218,000 $ 2,315,000 $ 3,533,000<br />
Incurred claims, representing the total of a<br />
provision for events for the current fiscal year<br />
and any changes (increase or decrease) in the<br />
provision for events of prior fiscal years and<br />
adjustments to estimates. 615,334<br />
Payments on claims attributable to events of<br />
both the current fiscal year and prior fiscal<br />
years. (401,334)<br />
378,889<br />
(505,889)<br />
994,223<br />
(907,223)<br />
Amount of accrued claims at June 30, 2010 $ 1,432,000 $ 2,188,000 $ 3,620,000<br />
Incurred claims, representing the total of a<br />
provision for events for the current fiscal year<br />
and any changes (increase or decrease) in the<br />
provision for events of prior fiscal years and<br />
adjustments to estimates. $ 692,596 $ 330,091 $ 1,022,687<br />
Payments on claims attributable to events of<br />
both the current fiscal year and prior fiscal<br />
years. (680,596)<br />
(535,091)<br />
(1,215,687)<br />
Amount of accrued claims at June 30, 2011 $ 1,444,000 $ 1,983,000 $ 3,427,000<br />
Litigation<br />
There are several lawsuits pending against the City. The outcome and eventual liability of the<br />
City, if any, in these cases is not known at this time. Management estimates that the potential<br />
claims against the City, not covered by insurance or self-insurance reserves, resulting from<br />
such litigation would not materially affect the financial statements of the City.<br />
Note 14: California Redevelopment Agency Dissolution<br />
On July 18, 2011, the California Redevelopment Association (“CRA”) and the League of<br />
California Cities (“League”) filed a petition for writ of mandate with the California Supreme<br />
Court, requesting the Court to declare unconstitutional two bills that were passed as part of<br />
the 2011-12 State Budget, ABX1 26 and 27 (California Redevelopment Association v.<br />
Matosantos). ABX1 26 dissolves redevelopment agencies effective October 1, 2011.<br />
71
City of <strong>Moreno</strong> <strong>Valley</strong><br />
Notes to <strong>Financial</strong> Statements<br />
Year Ended June 30, 2011 (Continued)<br />
Note 14: California Redevelopment Agency Dissolution (Continued)<br />
ABX1 27 gave redevelopment agencies an option to avoid dissolution if it commits to making<br />
defined payments for the benefit of the State, school districts and certain special districts. In<br />
2011-12, these payments amounted to a state-wide total of $1.7 billion. In 2012-13 and<br />
subsequent years, the payments totaled $400 million, annually. Each city or county’s share<br />
of these payments was determined based on its proportionate share of state-wide tax<br />
increment.<br />
On August 17, 2011 the Supreme Court issued a stay of the implementation of ABX1 26 and<br />
27 which allowed a redevelopment agency to continue if it adopted an ABX1 27 ordinance.<br />
However, because of the effect of the stay order, the authority for the Redevelopment Agency<br />
to engage in most activities was suspended.<br />
The Supreme Court heard oral arguments on November 10, 2011 and on<br />
December 29, 2011 announced its decision in (California Redevelopment Association v.<br />
Matosantos). The court upheld ABX1 26 which eliminates redevelopment agencies, but<br />
invalidated in its entirety ABX1 27 which allowed redevelopment agencies to continue as long<br />
as they made the required payments. ABX1 26 established deadlines for the process of<br />
Redevelopment Agency dissolution and the handling of existing obligations. The Court<br />
extended certain deadlines of ABX1 26 in its ruling by four months. The full text of ABX1 26<br />
may be obtained from the California legislative information website maintained by the<br />
Legislative Counsel of the State of California at: http://www.leginfo.ca.gov/bilinfo.html.<br />
Note 15: Subsequent Events<br />
On November 8, 2011, the <strong>Moreno</strong> <strong>Valley</strong> City Council authorized an interfund loan between<br />
the Corporate Yard Development Impact Fee Fund and the Facility Construction Fund in the<br />
amount of $2,500,000 and an interfund loan between the Library Development Impact Fee<br />
Fund and the Facility Construction Fund in the amount of $4,000,000.<br />
72
Non‐Major<br />
Governmental Funds
SPECIAL REVENUE FUNDS:<br />
State Gasoline Tax Fund<br />
NONMAJOR GOVERNMENTAL FUNDS<br />
This fund is used to account for the City’s share of state gas tax revenue restricted for street<br />
improvement and maintenance. The revenue is apportioned under the Streets and Highway<br />
Code of the State of California.<br />
Article 3 Transportation Fund<br />
This fund is used to account for the City’s share of Article 3 revenue restricted for construction of<br />
pedestrian and bikeway projects.<br />
Measure A Fund<br />
This fund is used to account for the City’s share of the Riverside County half-cent sales tax<br />
restricted for transportation projects.<br />
Law Enforcement Fund<br />
This fund is used to account for revenue from several grants restricted for law enforcement. The<br />
grants include the ABC Police Grant Fund, the Local Law Enforcement Block Grant (LLEBG),<br />
Supplemental Law Enforcement Services Fund (SLESF), Office of Traffic Safety Grant (OTS),<br />
Edward Byrne Memorial Justice Assistance Grant (JAG), and the 2008 COPS Tech Program<br />
Grant Fund.<br />
Other Grants Fund<br />
This fund is used to account for revenues and expenditures received from various governmental<br />
agencies and other sources for multiple purposes including energy efficiency, public safety, and<br />
support of the City’s cable television channel, MVTV-3.<br />
Air Quality Management Fund<br />
This fund is used to account for the City’s share of the State AB 2766 funds. The revenue is<br />
apportioned to cities by the South Coast Air Quality Management District and is restricted for<br />
programs to reduce air pollution from mobile sources pursuant to the California Clean Air Act of<br />
1988.<br />
Community Development Block Grant Fund<br />
This fund is used to account for federal funds received from the U.S. Department of Housing and<br />
Urban Development – Community Development Block Grant Program to be used for the<br />
development of suitable housing environment and expansion of economic opportunities for low<br />
and moderate income families.<br />
Special Districts Administration Fund<br />
This fund is used to account for the coordination and administration of all special assessments<br />
districts formed within the City for infrastructure improvements.<br />
73
NONMAJOR GOVERNMENTAL FUNDS (CONTINUED)<br />
SPECIAL REVENUE FUNDS (CONTINUED):<br />
Storm Water Management Fund<br />
This fund is used to account for the city-wide storm water and non-storm water pollution<br />
prevention compliance work conducted and programs prepared to comply with regulations set<br />
forth by the current National Pollutant Discharge Elimination System (NPDES).<br />
HOME Fund<br />
This fund is used to account for federal funds received from the U.S. Department of Housing and<br />
Urban Development to be used to develop and implement programs that expand the supply of<br />
affordable housing for low and very low income families.<br />
Child Care Grant Fund<br />
This fund is used to account for the Child Care grant program which provides after-school day<br />
care for the City’s residents.<br />
Used Oil Recycling Fund<br />
This fund is used to account for the California Integrated Waste Management Board Used Oil<br />
Block Grant. The program provides public education and convenient used oil collection sites.<br />
Traffic Congestion Relief Fund<br />
This fund is used to account for revenues and expenditures related to legally restricted funds<br />
obtained through grants from the State of California for traffic congestion relief.<br />
Storm Water Maintenance Fund<br />
This fund is used to ensure the safety and cleanliness of our City streets and the City’s<br />
maintained storm drain system by cleaning all catch basins, connector pipes and culverts on an<br />
annual basis and by providing emergency services, as needed.<br />
H.E.A.L. Fund<br />
This fund is used to account for the donation and use of funds received from Kaiser Foundation<br />
Health Plan, as required by donor.<br />
ASES Program Grants Fund<br />
This fund is used to account for the ASES program grants which provide after school education,<br />
after school safety and a food program that helps providers serve nutritious and safely prepared<br />
meals and snacks to children and adults in a day care setting.<br />
CFD #4M Fund<br />
This fund is used to account for the maintenance and administration costs of the detention basin<br />
within Centerpointe Business Park.<br />
74
NONMAJOR GOVERNMENTAL FUNDS (CONTINUED)<br />
SPECIAL REVENUE FUNDS (CONTINUED):<br />
Neighborhood Stabilization Grant Fund<br />
This fund is used to account for the grant allocation received by the City from HUD to address the<br />
foreclosure crisis and implement a neighborhood stabilization program (NSP) aimed at assisting<br />
low- to moderate- income households, while targeting the areas of the City most affected by the<br />
foreclosures.<br />
Homelessness Prevention Program Fund<br />
This fund is used to account for the Homelessness Prevention Program grant which aims to<br />
assist households that would otherwise become homeless (many, due to the economic crises) or<br />
rapidly re-house those who are homeless or at risk of homelessness.<br />
CDBG Recovery Act of 2009 Fund<br />
This fund is used to account for the grant allocation used in implementing activities that benefit<br />
the low and moderate income population in accordance with the Recovery Act objectives.<br />
Prop 42 Replacement Fund<br />
This fund is used to account for the City’s share of Prop 42 revenue restricted for transportation<br />
programs.<br />
Prop 1B Fund<br />
This fund is used to account for the City’s share of Prop 1B revenue restricted for transportation<br />
programs.<br />
FHWA TRANSIMS Fund<br />
This fund is used to account for the financial transactions regarding the City’s contract with the<br />
U.S. Department of Transportation Federal Highway Administration. In accordance with the<br />
contract, the City will construct a new citywide traffic model using the TRANSIMS program and<br />
analyze impacts of land-use changes on the circulation system.<br />
TRI16-06-1 Targeted Rubberized Fund<br />
This fund is used to account for the recycling grant from the California Integrated Waste<br />
Management Board, which essentially pays for the differential costs of an asphalt overlay project.<br />
Civil Penalties Fund<br />
This fund is used to account for all financial transactions involving civil penalties received by the<br />
City in accordance with the provisions of SB 1137, which requires legal owners of vacant<br />
properties to maintain and care for them.<br />
Emergency Services Agency Fines Fund<br />
This fund is used to account for the financial transactions involving AMR fines received by the<br />
City, which are to be used only to fund the purchase of various equipment needed by the Fire<br />
Department.<br />
75
NONMAJOR GOVERNMENTAL FUNDS (CONTINUED)<br />
SPECIAL REVENUE FUNDS (CONTINUED):<br />
Disaster Fund<br />
This fund is used to account for unforeseeable disasters and emergency situations for which<br />
reimbursement may become available.<br />
CAPITAL PROJECTS FUNDS:<br />
City Hall Capital/Administration Fund<br />
This fund is used to account for various general City Hall capital improvements and projects.<br />
Capital Improvements Fund<br />
This fund is used to account for revenues received to construct capital projects to mitigate the<br />
impact of new development on the City’s infrastructure.<br />
Public Works Capital Projects Fund<br />
This fund is used to account for general City capital projects.<br />
Traffic Signal Mitigation Fund<br />
This fund is used to account for traffic signal projects funded by revenues received from traffic<br />
mitigation fees.<br />
Fire Services Capital Projects Fund<br />
This fund is used to account for capital projects specific to Fire Services, including construction of<br />
new fire stations.<br />
Towngate Capital/Administration Fund<br />
This fund is used to account for the acquisition and construction of capital facilities in the<br />
Towngate area financed through special tax bonds.<br />
Warner Ranch Capital/Development Fund<br />
This fund is used to account for the acquisition or construction of capital facilities in the Warner<br />
Ranch area financed through special assessments.<br />
Auto Mall Capital/Administration Fund<br />
This fund is used to account for the acquisition or construction of capital facilities in the Auto Mall<br />
area financed through special tax bonds.<br />
76
NONMAJOR GOVERNMENTAL FUNDS (CONTINUED)<br />
CAPITAL PROJECTS FUNDS (CONTINUED):<br />
Parks and Community Services Development and Projects Fund<br />
This fund is used to account for parks acquisition and development projects funded by revenues<br />
received from developers on a dwelling unit basis in accordance with the Quimby Act, a 1965<br />
provision in the State Subdivision Map Act for the dedication of park land. This fund is used to<br />
account for general parks and recreation capital projects, the development of new parks and<br />
recreation facilities, community parks, neighborhood parks and sports facilities and for the major<br />
renovation of existing parks and facilities.<br />
TUMF Capital Projects Fund<br />
This fund is used to account for transportation capital projects funded by the City’s share of the<br />
Transportation Uniform Mitigation Fee (TUMF) which is a mandatory development impact fee<br />
program in Western Riverside County. This program, enacted by a two-thirds majority of voters<br />
in 2002, was designed to pay for major roads and interchange projects that are needed to serve<br />
communities as a result of new development. The Western Riverside Council of Governments<br />
(WRCOG) administers the program.<br />
DIF Capital Projects Fund<br />
This group of funds is used to account for construction of major capital improvements funded by<br />
the development impact fee (DIF) revenues charged to developers.<br />
Lease Revenue Bonds 2005 Capital Projects Fund<br />
This fund is used to account for the construction of capital improvements funded by the 2005<br />
Lease Revenue Bonds issued in July 2005.<br />
DEBT SERVICE FUNDS:<br />
OPA Sales Tax Agreements Fund<br />
This fund is used to account for the accumulation of 50% of sales tax revenue for certain retail<br />
stores and for the payment of principal and interest related to the ownership participation<br />
agreements between the Community Redevelopment Agency and certain retail stores.<br />
City Hall COPs Series 1997 Debt Service Fund<br />
This fund is used to account for the accumulation of resources and for the payment of principal,<br />
interest, and trustee and administrative costs related to the City Hall Refunding Certificates of<br />
Participation issued May 1, 1997.<br />
Auto Mall Special Tax Bonds Debt Service Fund<br />
This fund is used to account for the accumulation of resources and for the payment of principal,<br />
interest, and trustee and administrative costs related to the Auto Mall Special Tax Bonds Series<br />
2000 (Auto Mall Refinancing).<br />
77
NONMAJOR GOVERNMENTAL FUNDS (CONTINUED)<br />
DEBT SERVICE FUNDS (CONTINUED):<br />
Public Safety Lease Revenue Bonds 1997 Debt Service Fund<br />
This fund is used to account for the accumulation of resources and for the payment of principal,<br />
interest, and trustee and administrative costs related to the Public Safety Lease Revenue Bonds<br />
issued November 1, 1997.<br />
Lease Revenue Bonds 2005 Debt Service Fund<br />
This fund is used to account for the accumulation of resources and for the payment of principal,<br />
interest, and trustee and administrative costs related to the 2005 Lease Revenue Bonds issued in<br />
July 2005 to finance various City capital improvements.<br />
2007 Towngate Improvement Refunding Debt Service Fund<br />
This fund is used to account for the accumulation of resources and for the payment of principal,<br />
interest, and trustee and administrative costs related to the Improvement Area No. 1 Special Tax<br />
Refunding Bonds issued November 29, 2007.<br />
2007 Towngate Refunding Debt Service Fund<br />
This fund is used to account for the accumulation of resources and for the payment of principal,<br />
interest, and trustee and administrative costs related to the Special Tax Refunding Bonds issued<br />
November 29, 2007.<br />
2011 Priv Place Ref 97 Lease Rev Bonds Debt Service Fund<br />
This fund is used to account for the accumulation of resources and for the payment of the<br />
refinancing of the 1997 Lease Revenue Bonds.<br />
2011 Priv Place Ref 97 COPs Debt Service Fund<br />
This fund is used to account for the accumulation of resources and for the payment of the<br />
refinancing of the 1997 Certificates of Participation.<br />
PERMANENT FUNDS:<br />
Celebration Park Endowment Fund<br />
This fund is used to account for the endowment program for Celebration Park. The principal<br />
endowment amount was provided by a developer. The Parks and Community Services<br />
Department will use 85% of the interest earned each year to sponsor a community event at<br />
Celebration Park for the surrounding community to enhance community pride and involvement.<br />
Equestrian Trail Endowment Fund<br />
This fund is used to account for the endowment program for the Equestrian Trail. The principal<br />
endowment amount was provided by a developer. The interest earned will be used for the benefit<br />
of citywide trail use, maintenance, education and other trail-related costs.<br />
78
PERMANENT FUNDS (CONTINUED):<br />
Rockridge Park Endowment Fund<br />
NONMAJOR GOVERNMENTAL FUNDS (CONTINUED)<br />
This fund is used to account for the endowment program provided for Rockridge Park. The<br />
principal endowment was provided by a developer. The interest earned will be used for the<br />
benefit of the facilities at Rockridge Park.<br />
79
City of <strong>Moreno</strong> <strong>Valley</strong><br />
Combining Balance Sheet<br />
Nonmajor Governmental Funds<br />
June 30, 2011<br />
Special Revenue Funds<br />
State Gasoline Article 3<br />
Tax Transportation Measure A<br />
Assets:<br />
Pooled cash and investments<br />
Receivables:<br />
$ 737,867 $ 253 $ 9,979,195<br />
Accounts 41,160<br />
- 1,052,295<br />
Notes and loans -<br />
-<br />
-<br />
Interest -<br />
-<br />
-<br />
Prepaid costs -<br />
-<br />
-<br />
Due from other governments 276,595<br />
- 1,650,311<br />
Advances to other funds<br />
Restricted assets:<br />
-<br />
-<br />
-<br />
Cash with fiscal agents -<br />
-<br />
-<br />
Total Assets $ 1,055,622 $ 253 $ 12,681,801<br />
Liabilities and Fund Balances:<br />
Liabilities:<br />
Accounts payable $ 24,404 $ - $ 1,705,220<br />
Accrued liabilities 39,188<br />
253<br />
20,799<br />
Deferred revenues -<br />
- 1,199,191<br />
Unearned revenues -<br />
-<br />
-<br />
Due to other governments -<br />
-<br />
-<br />
Due to other funds -<br />
-<br />
-<br />
Total Liabilities 63,592<br />
Fund Balances:<br />
Nonspendable:<br />
Prepaid costs -<br />
Notes and loans -<br />
Advances to other funds<br />
Restricted for:<br />
-<br />
Community development projects -<br />
Public safety -<br />
Community and cultural -<br />
Public works 992,030<br />
Capital Projects -<br />
Debt service -<br />
Endowment -<br />
Water quality<br />
Assigned to:<br />
-<br />
Capital Projects -<br />
Unassigned -<br />
Total Fund Balances 992,030<br />
253<br />
-<br />
-<br />
-<br />
-<br />
-<br />
-<br />
-<br />
-<br />
-<br />
-<br />
-<br />
-<br />
-<br />
-<br />
2,925,210<br />
-<br />
-<br />
-<br />
-<br />
-<br />
-<br />
9,756,591<br />
-<br />
-<br />
-<br />
-<br />
-<br />
-<br />
9,756,591<br />
Total Liabilities and Fund Balances $ 1,055,622 $ 253 $ 12,681,801<br />
80
Special Revenue Funds<br />
Law<br />
Air Quality<br />
Enforcement Other Grants Management<br />
$ 137,535 $ 2,202,746 $ 359,830<br />
Assets:<br />
Pooled cash and investments<br />
Receivables:<br />
-<br />
131,222<br />
- Accounts<br />
-<br />
-<br />
- Notes and loans<br />
-<br />
-<br />
- Interest<br />
-<br />
-<br />
- Prepaid costs<br />
300,394<br />
256,168<br />
43,539 Due from other governments<br />
-<br />
-<br />
- Advances to other funds<br />
Restricted assets:<br />
-<br />
-<br />
- Cash with fiscal agents<br />
$ 437,929 $ 2,590,136 $ 403,369<br />
$ 139,863 $ 121,861 $ 1,728<br />
Liabilities and Fund Balances:<br />
Liabilities:<br />
Accounts payable<br />
1,393<br />
9,370<br />
4,655 Accrued liabilities<br />
-<br />
-<br />
- Deferred revenues<br />
152,375<br />
-<br />
- Unearned revenues<br />
-<br />
-<br />
- Due to other governments<br />
144,494<br />
114,419<br />
- Due to other funds<br />
438,125<br />
-<br />
-<br />
-<br />
-<br />
-<br />
-<br />
-<br />
-<br />
-<br />
-<br />
-<br />
-<br />
(196)<br />
(196)<br />
245,650<br />
-<br />
-<br />
-<br />
2,309,191<br />
32,999<br />
1,378<br />
918<br />
-<br />
-<br />
-<br />
-<br />
-<br />
-<br />
2,344,486<br />
6,383<br />
Fund Balances:<br />
Nonspendable:<br />
- Prepaid costs<br />
- Notes and loans<br />
- Advances to other funds<br />
Restricted for:<br />
- Community development projects<br />
- Public safety<br />
- Community and cultural<br />
396,986 Public works<br />
- Capital Projects<br />
- Debt service<br />
- Endowment<br />
- Water quality<br />
Assigned to:<br />
- Capital Projects<br />
- Unassigned<br />
396,986<br />
Total Fund Balances<br />
$ 437,929 $ 2,590,136 $ 403,369 Total Liabilities and Fund Balances<br />
81<br />
(Continued)
City of <strong>Moreno</strong> <strong>Valley</strong><br />
Combining Balance Sheet<br />
Nonmajor Governmental Funds<br />
June 30, 2011<br />
Special Revenue Funds<br />
Community Special<br />
Development Districts Storm Water<br />
Block Grant Administration Management<br />
Assets:<br />
Pooled cash and investments<br />
Receivables:<br />
$ - $ 101,706 $ 228,124<br />
Accounts -<br />
18,208<br />
84,405<br />
Notes and loans 60,000<br />
-<br />
-<br />
Interest -<br />
-<br />
-<br />
Prepaid costs -<br />
11,708<br />
-<br />
Due from other governments 626,309<br />
-<br />
7,391<br />
Advances to other funds<br />
Restricted assets:<br />
-<br />
580,657<br />
-<br />
Cash with fiscal agents -<br />
-<br />
-<br />
$ 686,309 $ 712,279 $ 319,920<br />
Liabilities and Fund Balances:<br />
Liabilities:<br />
Accounts payable $ 100,120 $ 916 $ 8,314<br />
Accrued liabilities 3,359<br />
7,754<br />
9,738<br />
Deferred revenues -<br />
-<br />
-<br />
Unearned revenues -<br />
-<br />
-<br />
Due to other governments -<br />
-<br />
-<br />
Due to other funds 506,963<br />
-<br />
-<br />
610,442<br />
Fund Balances:<br />
Nonspendable:<br />
Prepaid costs -<br />
Notes and loans 60,000<br />
Advances to other funds<br />
Restricted for:<br />
-<br />
Community development projects 15,867<br />
Public safety -<br />
Community and cultural -<br />
Public works -<br />
Capital Projects -<br />
Debt service -<br />
Endowment -<br />
Water quality<br />
Assigned to:<br />
-<br />
Capital Projects -<br />
Unassigned -<br />
Total Fund Balances 75,867<br />
8,670<br />
11,708<br />
-<br />
580,657<br />
-<br />
-<br />
-<br />
111,244<br />
-<br />
-<br />
-<br />
-<br />
-<br />
-<br />
703,609<br />
18,052<br />
-<br />
-<br />
-<br />
-<br />
-<br />
-<br />
-<br />
-<br />
-<br />
-<br />
301,868<br />
-<br />
-<br />
301,868<br />
Total Liabilities and Fund Balances $ 686,309 $ 712,279 $ 319,920<br />
82
Special Revenue Funds<br />
Child Care Used Oil<br />
HOME<br />
Grant<br />
Recycling<br />
$ 426,606 $ 8,265 $ 59,938<br />
Assets:<br />
Pooled cash and investments<br />
Receivables:<br />
23,075<br />
-<br />
- Accounts<br />
3,917,575<br />
-<br />
- Notes and loans<br />
228,883<br />
-<br />
- Interest<br />
-<br />
350<br />
- Prepaid costs<br />
-<br />
30,811<br />
30,356 Due from other governments<br />
-<br />
-<br />
- Advances to other funds<br />
Restricted assets:<br />
-<br />
-<br />
- Cash with fiscal agents<br />
$ 4,596,139 $ 39,426 $ 90,294<br />
$ 4,325 $ 2,385 $ 4,818<br />
Liabilities and Fund Balances:<br />
Liabilities:<br />
Accounts payable<br />
543<br />
47,633<br />
125 Accrued liabilities<br />
228,883<br />
-<br />
- Deferred revenues<br />
-<br />
-<br />
59,938 Unearned revenues<br />
-<br />
7,733<br />
- Due to other governments<br />
-<br />
-<br />
25,413 Due to other funds<br />
233,751<br />
-<br />
3,917,575<br />
-<br />
444,813<br />
-<br />
-<br />
-<br />
-<br />
-<br />
-<br />
-<br />
-<br />
-<br />
4,362,388<br />
57,751<br />
350<br />
-<br />
-<br />
-<br />
-<br />
-<br />
-<br />
-<br />
-<br />
-<br />
-<br />
-<br />
(18,675)<br />
(18,325)<br />
90,294<br />
Fund Balances:<br />
Nonspendable:<br />
- Prepaid costs<br />
- Notes and loans<br />
- Advances to other funds<br />
Restricted for:<br />
- Community development projects<br />
- Public safety<br />
- Community and cultural<br />
- Public works<br />
- Capital Projects<br />
- Debt service<br />
- Endowment<br />
- Water quality<br />
Assigned to:<br />
- Capital Projects<br />
- Unassigned<br />
-<br />
Total Fund Balances<br />
$ 4,596,139 $ 39,426 $ 90,294 Total Liabilities and Fund Balances<br />
83<br />
(Continued)
City of <strong>Moreno</strong> <strong>Valley</strong><br />
Combining Balance Sheet<br />
Nonmajor Governmental Funds<br />
June 30, 2011<br />
Special Revenue Funds<br />
Traffic<br />
Congestion Storm Water<br />
Relief Maintenance H.E.A.L.<br />
Assets:<br />
Pooled cash and investments<br />
Receivables:<br />
$ 186,614 $ - $<br />
-<br />
Accounts -<br />
150,821<br />
-<br />
Notes and loans -<br />
-<br />
-<br />
Interest -<br />
-<br />
-<br />
Prepaid costs -<br />
-<br />
-<br />
Due from other governments -<br />
-<br />
-<br />
Advances to other funds<br />
Restricted assets:<br />
-<br />
-<br />
-<br />
Cash with fiscal agents -<br />
-<br />
-<br />
$ 186,614 $ 150,821 $<br />
-<br />
Liabilities and Fund Balances:<br />
Liabilities:<br />
Accounts payable $ 174,286 $ 2,593 $<br />
-<br />
Accrued liabilities -<br />
2,828<br />
-<br />
Deferred revenues -<br />
-<br />
-<br />
Unearned revenues -<br />
-<br />
-<br />
Due to other governments -<br />
-<br />
-<br />
Due to other funds -<br />
76,936<br />
-<br />
174,286<br />
Fund Balances:<br />
Nonspendable:<br />
Prepaid costs -<br />
Notes and loans -<br />
Advances to other funds<br />
Restricted for:<br />
-<br />
Community development projects -<br />
Public safety -<br />
Community and cultural -<br />
Public works 12,328<br />
Capital Projects -<br />
Debt service -<br />
Endowment -<br />
Water quality<br />
Assigned to:<br />
-<br />
Capital Projects -<br />
Unassigned -<br />
Total Fund Balances 12,328<br />
82,357<br />
-<br />
-<br />
-<br />
-<br />
-<br />
-<br />
68,464<br />
-<br />
-<br />
-<br />
-<br />
-<br />
-<br />
68,464<br />
Total Liabilities and Fund Balances $ 186,614 $ 150,821 $<br />
-<br />
84<br />
-<br />
-<br />
-<br />
-<br />
-<br />
-<br />
-<br />
-<br />
-<br />
-<br />
-<br />
-<br />
-<br />
-<br />
-
Special Revenue Funds<br />
ASES<br />
Neighborhood<br />
Program<br />
Stabilization<br />
Grants CFD #4M<br />
Grant<br />
$ 3,914 $ 62,839 $ -<br />
Assets:<br />
Pooled cash and investments<br />
Receivables:<br />
-<br />
-<br />
- Accounts<br />
-<br />
-<br />
- Notes and loans<br />
-<br />
-<br />
- Interest<br />
-<br />
-<br />
- Prepaid costs<br />
486,918<br />
-<br />
- Due from other governments<br />
-<br />
-<br />
- Advances to other funds<br />
Restricted assets:<br />
-<br />
-<br />
- Cash with fiscal agents<br />
$ 490,832 $ 62,839 $<br />
-<br />
$ 92,425 $ - $ 144,660<br />
Liabilities and Fund Balances:<br />
Liabilities:<br />
Accounts payable<br />
445<br />
-<br />
6,661 Accrued liabilities<br />
-<br />
-<br />
- Deferred revenues<br />
-<br />
-<br />
- Unearned revenues<br />
-<br />
-<br />
- Due to other governments<br />
394,048<br />
-<br />
365,929 Due to other funds<br />
486,918<br />
-<br />
-<br />
-<br />
-<br />
-<br />
3,914<br />
-<br />
-<br />
-<br />
-<br />
-<br />
-<br />
-<br />
3,914<br />
-<br />
-<br />
-<br />
-<br />
-<br />
-<br />
-<br />
62,839<br />
-<br />
-<br />
-<br />
-<br />
-<br />
-<br />
62,839<br />
517,250<br />
Fund Balances:<br />
Nonspendable:<br />
- Prepaid costs<br />
- Notes and loans<br />
- Advances to other funds<br />
Restricted for:<br />
- Community development projects<br />
- Public safety<br />
- Community and cultural<br />
- Public works<br />
- Capital Projects<br />
- Debt service<br />
- Endowment<br />
- Water quality<br />
Assigned to:<br />
- Capital Projects<br />
(517,250) Unassigned<br />
(517,250)<br />
Total Fund Balances<br />
$ 490,832 $ 62,839 $ - Total Liabilities and Fund Balances<br />
85<br />
(Continued)
City of <strong>Moreno</strong> <strong>Valley</strong><br />
Combining Balance Sheet<br />
Nonmajor Governmental Funds<br />
June 30, 2011<br />
Special Revenue Funds<br />
Homelessness CDBG<br />
Prop 42<br />
Prevention Recovery Act Replacement<br />
Program<br />
of 2009<br />
Funds<br />
Assets:<br />
Pooled cash and investments<br />
Receivables:<br />
$ - $ - $ 1,518,890<br />
Accounts -<br />
-<br />
-<br />
Notes and loans -<br />
-<br />
-<br />
Interest -<br />
-<br />
-<br />
Prepaid costs -<br />
-<br />
-<br />
Due from other governments -<br />
113,966<br />
287,308<br />
Advances to other funds<br />
Restricted assets:<br />
-<br />
-<br />
-<br />
Cash with fiscal agents -<br />
-<br />
-<br />
$ - $ 113,966 $ 1,806,198<br />
Liabilities and Fund Balances:<br />
Liabilities:<br />
Accounts payable $ 11,656 $ - $<br />
-<br />
Accrued liabilities -<br />
-<br />
-<br />
Deferred revenues -<br />
-<br />
-<br />
Unearned revenues -<br />
-<br />
-<br />
Due to other governments -<br />
-<br />
-<br />
Due to other funds -<br />
113,966<br />
-<br />
11,656<br />
Fund Balances:<br />
Nonspendable:<br />
Prepaid costs -<br />
Notes and loans -<br />
Advances to other funds<br />
Restricted for:<br />
-<br />
Community development projects -<br />
Public safety -<br />
Community and cultural -<br />
Public works -<br />
Capital Projects -<br />
Debt service -<br />
Endowment -<br />
Water quality<br />
Assigned to:<br />
-<br />
Capital Projects -<br />
Unassigned (11,656)<br />
Total Fund Balances (11,656)<br />
113,966<br />
-<br />
-<br />
-<br />
-<br />
-<br />
-<br />
-<br />
-<br />
-<br />
-<br />
-<br />
-<br />
-<br />
-<br />
-<br />
-<br />
-<br />
-<br />
-<br />
-<br />
-<br />
1,806,198<br />
-<br />
-<br />
-<br />
-<br />
-<br />
-<br />
1,806,198<br />
Total Liabilities and Fund Balances $ - $ 113,966 $ 1,806,198<br />
86
Special Revenue Funds<br />
FHWA<br />
TR16-06-1<br />
Targeted<br />
Prop 1B TRANSIMS Rubberized<br />
$ 1,839,961 $ - $ 93,526<br />
Assets:<br />
Pooled cash and investments<br />
Receivables:<br />
-<br />
-<br />
- Accounts<br />
-<br />
-<br />
- Notes and loans<br />
-<br />
-<br />
- Interest<br />
-<br />
-<br />
- Prepaid costs<br />
-<br />
-<br />
- Due from other governments<br />
-<br />
-<br />
- Advances to other funds<br />
Restricted assets:<br />
-<br />
-<br />
- Cash with fiscal agents<br />
$ 1,839,961 $ - $ 93,526<br />
$ 1,456,062 $ - $ -<br />
Liabilities and Fund Balances:<br />
Liabilities:<br />
Accounts payable<br />
5,804<br />
-<br />
- Accrued liabilities<br />
-<br />
-<br />
- Deferred revenues<br />
-<br />
-<br />
- Unearned revenues<br />
-<br />
-<br />
- Due to other governments<br />
-<br />
-<br />
- Due to other funds<br />
1,461,866<br />
-<br />
-<br />
-<br />
-<br />
-<br />
-<br />
378,095<br />
-<br />
-<br />
-<br />
-<br />
-<br />
-<br />
378,095<br />
-<br />
-<br />
-<br />
-<br />
-<br />
-<br />
-<br />
-<br />
-<br />
-<br />
-<br />
-<br />
-<br />
-<br />
-<br />
-<br />
Fund Balances:<br />
Nonspendable:<br />
- Prepaid costs<br />
- Notes and loans<br />
- Advances to other funds<br />
Restricted for:<br />
- Community development projects<br />
- Public safety<br />
- Community and cultural<br />
93,526 Public works<br />
- Capital Projects<br />
- Debt service<br />
- Endowment<br />
- Water quality<br />
Assigned to:<br />
- Capital Projects<br />
- Unassigned<br />
93,526<br />
Total Fund Balances<br />
$ 1,839,961 $ - $ 93,526 Total Liabilities and Fund Balances<br />
87<br />
(Continued)
City of <strong>Moreno</strong> <strong>Valley</strong><br />
Combining Balance Sheet<br />
Nonmajor Governmental Funds<br />
June 30, 2011<br />
Special Revenue Funds<br />
Civil Penalties<br />
Emergency<br />
Services<br />
Agency Fines Disaster<br />
Assets:<br />
Pooled cash and investments<br />
Receivables:<br />
$ 320,506 $ 254,875 $ 356,912<br />
Accounts 11,757<br />
-<br />
-<br />
Notes and loans -<br />
-<br />
-<br />
Interest -<br />
-<br />
-<br />
Prepaid costs -<br />
-<br />
-<br />
Due from other governments -<br />
-<br />
-<br />
Advances to other funds<br />
Restricted assets:<br />
-<br />
-<br />
-<br />
Cash with fiscal agents -<br />
-<br />
-<br />
$ 332,263 $ 254,875 $ 356,912<br />
Liabilities and Fund Balances:<br />
Liabilities:<br />
Accounts payable $ 51 $ - $<br />
-<br />
Accrued liabilities 18<br />
-<br />
-<br />
Deferred revenues -<br />
-<br />
-<br />
Unearned revenues -<br />
-<br />
-<br />
Due to other governments -<br />
-<br />
-<br />
Due to other funds -<br />
-<br />
-<br />
Fund Balances:<br />
Nonspendable:<br />
Prepaid costs -<br />
Notes and loans -<br />
Advances to other funds<br />
Restricted for:<br />
-<br />
Community development projects 332,194<br />
Public safety -<br />
Community and cultural -<br />
Public works -<br />
Capital Projects -<br />
Debt service -<br />
Endowment -<br />
Water quality<br />
Assigned to:<br />
-<br />
Capital Projects -<br />
Unassigned -<br />
Total Fund Balances 332,194<br />
69<br />
-<br />
-<br />
-<br />
-<br />
-<br />
254,875<br />
-<br />
-<br />
-<br />
-<br />
-<br />
-<br />
-<br />
-<br />
254,875<br />
-<br />
-<br />
-<br />
-<br />
-<br />
356,912<br />
-<br />
-<br />
-<br />
-<br />
-<br />
-<br />
-<br />
-<br />
356,912<br />
Total Liabilities and Fund Balances $ 332,263 $ 254,875 $ 356,912<br />
88
Capital Projects Funds<br />
City Hall<br />
Public Works<br />
Capital /<br />
Capital<br />
Capital<br />
Administration Improvements Projects<br />
$ 9,593,818 $ 176,852 $ 105,212<br />
Assets:<br />
Pooled cash and investments<br />
Receivables:<br />
-<br />
-<br />
- Accounts<br />
-<br />
-<br />
- Notes and loans<br />
-<br />
-<br />
- Interest<br />
-<br />
-<br />
- Prepaid costs<br />
-<br />
-<br />
- Due from other governments<br />
-<br />
-<br />
- Advances to other funds<br />
Restricted assets:<br />
-<br />
-<br />
- Cash with fiscal agents<br />
$ 9,593,818 $ 176,852 $ 105,212 Total Assets<br />
$ 8,818 $ - $ 32,635<br />
Liabilities and Fund Balances:<br />
Liabilities:<br />
Accounts payable<br />
428<br />
-<br />
- Accrued liabilities<br />
-<br />
-<br />
- Deferred revenues<br />
-<br />
-<br />
- Unearned revenues<br />
-<br />
-<br />
- Due to other governments<br />
-<br />
-<br />
- Due to other funds<br />
9,246<br />
-<br />
-<br />
-<br />
-<br />
-<br />
-<br />
-<br />
-<br />
-<br />
-<br />
-<br />
9,584,572<br />
-<br />
9,584,572<br />
-<br />
-<br />
-<br />
-<br />
-<br />
-<br />
-<br />
-<br />
-<br />
-<br />
-<br />
-<br />
176,852<br />
-<br />
176,852<br />
32,635<br />
Total Liabilities<br />
Fund Balances:<br />
Nonspendable:<br />
- Prepaid costs<br />
- Notes and loans<br />
- Advances to other funds<br />
Restricted for:<br />
- Community development projects<br />
- Public safety<br />
- Community and cultural<br />
- Public works<br />
- Capital Projects<br />
- Debt service<br />
- Endowment<br />
- Water quality<br />
Assigned to:<br />
72,577 Capital Projects<br />
- Unassigned<br />
72,577<br />
Total Fund Balances<br />
$ 9,593,818 $ 176,852 $ 105,212 Total Liabilities and Fund Balances<br />
89<br />
(Continued)
City of <strong>Moreno</strong> <strong>Valley</strong><br />
Combining Balance Sheet<br />
Nonmajor Governmental Funds<br />
June 30, 2011<br />
Capital Projects Funds<br />
Fire Services Towngate<br />
Traffic Signal Capital<br />
Capital /<br />
Mitigation Projects Administration<br />
Assets:<br />
Pooled cash and investments<br />
Receivables:<br />
$ 137,578 $ 1,857,279 $ 8,101<br />
Accounts -<br />
-<br />
-<br />
Notes and loans -<br />
-<br />
-<br />
Interest -<br />
-<br />
-<br />
Prepaid costs -<br />
-<br />
-<br />
Due from other governments -<br />
-<br />
-<br />
Advances to other funds<br />
Restricted assets:<br />
-<br />
-<br />
-<br />
Cash with fiscal agents -<br />
-<br />
-<br />
Total Assets $ 137,578 $ 1,857,279 $ 8,101<br />
Liabilities and Fund Balances:<br />
Liabilities:<br />
Accounts payable $ - $ 6,802 $<br />
-<br />
Accrued liabilities -<br />
645<br />
-<br />
Deferred revenues -<br />
-<br />
-<br />
Unearned revenues -<br />
-<br />
-<br />
Due to other governments -<br />
-<br />
-<br />
Due to other funds -<br />
-<br />
-<br />
Total Liabilities -<br />
Fund Balances:<br />
Nonspendable:<br />
Prepaid costs -<br />
Notes and loans -<br />
Advances to other funds<br />
Restricted for:<br />
-<br />
Community development projects -<br />
Public safety -<br />
Community and cultural -<br />
Public works -<br />
Capital Projects 137,578<br />
Debt service -<br />
Endowment -<br />
Water quality<br />
Assigned to:<br />
-<br />
Capital Projects -<br />
Unassigned -<br />
Total Fund Balances 137,578<br />
7,447<br />
-<br />
-<br />
-<br />
-<br />
-<br />
-<br />
-<br />
1,849,832<br />
-<br />
-<br />
-<br />
-<br />
-<br />
1,849,832<br />
-<br />
-<br />
-<br />
-<br />
-<br />
-<br />
-<br />
-<br />
8,101<br />
-<br />
-<br />
-<br />
Total Liabilities and Fund Balances $ 137,578 $ 1,857,279 $ 8,101<br />
90<br />
-<br />
-<br />
8,101
Capital Projects Funds<br />
Warner Ranch Auto Mall<br />
Parks and<br />
Community<br />
Services<br />
Capital /<br />
Capital /<br />
Capital<br />
Development Administration Projects<br />
$ 13,673 $ - $ 5,619,723<br />
Assets:<br />
Pooled cash and investments<br />
Receivables:<br />
-<br />
-<br />
- Accounts<br />
-<br />
-<br />
- Notes and loans<br />
-<br />
-<br />
- Interest<br />
-<br />
-<br />
- Prepaid costs<br />
-<br />
-<br />
- Due from other governments<br />
-<br />
-<br />
- Advances to other funds<br />
Restricted assets:<br />
-<br />
-<br />
- Cash with fiscal agents<br />
$ 13,673 $ - $ 5,619,723 Total Assets<br />
$ - $ - $ 302,221<br />
Liabilities and Fund Balances:<br />
Liabilities:<br />
Accounts payable<br />
-<br />
-<br />
21 Accrued liabilities<br />
-<br />
-<br />
- Deferred revenues<br />
-<br />
-<br />
- Unearned revenues<br />
-<br />
-<br />
- Due to other governments<br />
-<br />
3,364<br />
- Due to other funds<br />
-<br />
-<br />
-<br />
-<br />
-<br />
-<br />
-<br />
-<br />
13,673<br />
-<br />
-<br />
-<br />
-<br />
-<br />
13,673<br />
3,364<br />
-<br />
-<br />
-<br />
-<br />
-<br />
-<br />
-<br />
-<br />
-<br />
-<br />
-<br />
-<br />
(3,364)<br />
(3,364)<br />
302,242<br />
Total Liabilities<br />
Fund Balances:<br />
Nonspendable:<br />
- Prepaid costs<br />
- Notes and loans<br />
- Advances to other funds<br />
Restricted for:<br />
- Community development projects<br />
- Public safety<br />
- Community and cultural<br />
- Public works<br />
- Capital Projects<br />
- Debt service<br />
- Endowment<br />
- Water quality<br />
Assigned to:<br />
5,317,481 Capital Projects<br />
- Unassigned<br />
5,317,481<br />
Total Fund Balances<br />
$ 13,673 $ - $ 5,619,723 Total Liabilities and Fund Balances<br />
91<br />
(Continued)
City of <strong>Moreno</strong> <strong>Valley</strong><br />
Combining Balance Sheet<br />
Nonmajor Governmental Funds<br />
June 30, 2011<br />
Capital Projects Funds<br />
TUMF Capital DIF Capital<br />
Lease<br />
Revenue<br />
Bonds 2005<br />
Capital<br />
Projects<br />
Projects Projects<br />
Assets:<br />
Pooled cash and investments<br />
Receivables:<br />
$ - $ 4,617,250 $ 941,733<br />
Accounts 637,040<br />
-<br />
-<br />
Notes and loans -<br />
-<br />
-<br />
Interest -<br />
-<br />
-<br />
Prepaid costs -<br />
-<br />
-<br />
Due from other governments -<br />
-<br />
-<br />
Advances to other funds<br />
Restricted assets:<br />
-<br />
-<br />
-<br />
Cash with fiscal agents -<br />
- 1,166,969<br />
Total Assets $ 637,040 $ 4,617,250 $ 2,108,702<br />
Liabilities and Fund Balances:<br />
Liabilities:<br />
Accounts payable $ 123,329 $ 260,336 $ 139,118<br />
Accrued liabilities 1,147<br />
2,655<br />
1,821<br />
Deferred revenues -<br />
-<br />
-<br />
Unearned revenues -<br />
-<br />
-<br />
Due to other governments -<br />
-<br />
-<br />
Due to other funds 723,398<br />
-<br />
-<br />
Total Liabilities 847,874<br />
Fund Balances:<br />
Nonspendable:<br />
Prepaid costs -<br />
Notes and loans -<br />
Advances to other funds<br />
Restricted for:<br />
-<br />
Community development projects -<br />
Public safety -<br />
Community and cultural -<br />
Public works -<br />
Capital Projects -<br />
Debt service -<br />
Endowment -<br />
Water quality<br />
Assigned to:<br />
-<br />
Capital Projects -<br />
Unassigned (210,834)<br />
Total Fund Balances (210,834)<br />
262,991<br />
-<br />
-<br />
-<br />
-<br />
-<br />
-<br />
-<br />
4,354,259<br />
-<br />
-<br />
-<br />
-<br />
-<br />
4,354,259<br />
140,939<br />
-<br />
-<br />
-<br />
-<br />
-<br />
-<br />
-<br />
1,967,763<br />
-<br />
-<br />
-<br />
-<br />
-<br />
1,967,763<br />
Total Liabilities and Fund Balances $ 637,040 $ 4,617,250 $ 2,108,702<br />
92
Debt Service Funds<br />
OPA Sales<br />
Auto Mall<br />
Tax City Hall COPs Special Tax<br />
Agreements Series 1997 Bonds<br />
$ 106,485 $ - $ -<br />
Assets:<br />
Pooled cash and investments<br />
Receivables:<br />
-<br />
-<br />
31,250 Accounts<br />
-<br />
-<br />
- Notes and loans<br />
-<br />
-<br />
- Interest<br />
-<br />
-<br />
- Prepaid costs<br />
-<br />
-<br />
4,594 Due from other governments<br />
-<br />
-<br />
- Advances to other funds<br />
Restricted assets:<br />
-<br />
- 1,298,608 Cash with fiscal agents<br />
$ 106,485 $ - $ 1,334,452 Total Assets<br />
$ 106,485 $ - $ -<br />
Liabilities and Fund Balances:<br />
Liabilities:<br />
Accounts payable<br />
-<br />
-<br />
- Accrued liabilities<br />
-<br />
-<br />
- Deferred revenues<br />
-<br />
-<br />
- Unearned revenues<br />
-<br />
-<br />
- Due to other governments<br />
-<br />
-<br />
216,764 Due to other funds<br />
106,485<br />
-<br />
-<br />
-<br />
-<br />
-<br />
-<br />
-<br />
-<br />
-<br />
-<br />
-<br />
-<br />
-<br />
-<br />
-<br />
-<br />
-<br />
-<br />
-<br />
-<br />
-<br />
-<br />
-<br />
-<br />
-<br />
-<br />
-<br />
-<br />
-<br />
216,764<br />
Total Liabilities<br />
Fund Balances:<br />
Nonspendable:<br />
- Prepaid costs<br />
- Notes and loans<br />
- Advances to other funds<br />
Restricted for:<br />
- Community development projects<br />
- Public safety<br />
- Community and cultural<br />
- Public works<br />
- Capital Projects<br />
1,117,688 Debt service<br />
- Endowment<br />
- Water quality<br />
Assigned to:<br />
- Capital Projects<br />
- Unassigned<br />
1,117,688<br />
Total Fund Balances<br />
$ 106,485 $ - $ 1,334,452 Total Liabilities and Fund Balances<br />
93<br />
(Continued)
City of <strong>Moreno</strong> <strong>Valley</strong><br />
Combining Balance Sheet<br />
Nonmajor Governmental Funds<br />
June 30, 2011<br />
Debt Service Funds<br />
Lease<br />
2007<br />
Public Safety Revenue Towngate<br />
Lease Revenue Bonds 2005 Improvement<br />
Bonds 1997 Debt Service Refunding<br />
Assets:<br />
Pooled cash and investments<br />
Receivables:<br />
$ 1,500 $ 6,141,296 $ 37,075<br />
Accounts -<br />
-<br />
15,915<br />
Notes and loans -<br />
-<br />
-<br />
Interest -<br />
-<br />
-<br />
Prepaid costs -<br />
-<br />
-<br />
Due from other governments -<br />
-<br />
-<br />
Advances to other funds<br />
Restricted assets:<br />
-<br />
-<br />
-<br />
Cash with fiscal agents - 2,649,485<br />
753,815<br />
Total Assets $ 1,500 $ 8,790,781 $ 806,805<br />
Liabilities and Fund Balances:<br />
Liabilities:<br />
Accounts payable $ 1,500 $ - $<br />
-<br />
Accrued liabilities -<br />
-<br />
-<br />
Deferred revenues -<br />
-<br />
-<br />
Unearned revenues -<br />
-<br />
-<br />
Due to other governments -<br />
-<br />
-<br />
Due to other funds -<br />
-<br />
-<br />
Total Liabilities 1,500<br />
Fund Balances:<br />
Nonspendable:<br />
Prepaid costs -<br />
Notes and loans -<br />
Advances to other funds<br />
Restricted for:<br />
-<br />
Community development projects -<br />
Public safety -<br />
Community and cultural -<br />
Public works -<br />
Capital Projects -<br />
Debt service -<br />
Endowment -<br />
Water quality<br />
Assigned to:<br />
-<br />
Capital Projects -<br />
Unassigned -<br />
Total Fund Balances -<br />
-<br />
-<br />
-<br />
-<br />
-<br />
-<br />
-<br />
-<br />
-<br />
8,790,781<br />
-<br />
-<br />
-<br />
-<br />
8,790,781<br />
-<br />
-<br />
-<br />
-<br />
-<br />
-<br />
-<br />
-<br />
-<br />
806,805<br />
-<br />
-<br />
-<br />
-<br />
806,805<br />
Total Liabilities and Fund Balances $ 1,500 $ 8,790,781 $ 806,805<br />
94
Debt Service Funds<br />
2007<br />
2011 Priv<br />
Placement Ref 2011 Priv<br />
Towngate 97 Lease Rev Placement Ref<br />
Refunding Bonds<br />
97 COPs<br />
$ - $ - $ -<br />
Assets:<br />
Pooled cash and investments<br />
Receivables:<br />
-<br />
-<br />
- Accounts<br />
-<br />
-<br />
- Notes and loans<br />
-<br />
-<br />
- Interest<br />
-<br />
-<br />
- Prepaid costs<br />
-<br />
-<br />
- Due from other governments<br />
-<br />
-<br />
- Advances to other funds<br />
Restricted assets:<br />
2,587,414<br />
-<br />
- Cash with fiscal agents<br />
$ 2,587,414 $ - $ - Total Assets<br />
$ - $ - $ -<br />
Liabilities and Fund Balances:<br />
Liabilities:<br />
Accounts payable<br />
-<br />
-<br />
- Accrued liabilities<br />
-<br />
-<br />
- Deferred revenues<br />
-<br />
-<br />
- Unearned revenues<br />
-<br />
-<br />
- Due to other governments<br />
435,045<br />
-<br />
- Due to other funds<br />
435,045<br />
-<br />
-<br />
-<br />
-<br />
-<br />
-<br />
-<br />
-<br />
2,152,369<br />
-<br />
-<br />
-<br />
-<br />
2,152,369<br />
-<br />
-<br />
-<br />
-<br />
-<br />
-<br />
-<br />
-<br />
-<br />
-<br />
-<br />
-<br />
-<br />
-<br />
-<br />
-<br />
Total Liabilities<br />
Fund Balances:<br />
Nonspendable:<br />
- Prepaid costs<br />
- Notes and loans<br />
- Advances to other funds<br />
Restricted for:<br />
- Community development projects<br />
- Public safety<br />
- Community and cultural<br />
- Public works<br />
- Capital Projects<br />
- Debt service<br />
- Endowment<br />
- Water quality<br />
Assigned to:<br />
- Capital Projects<br />
- Unassigned<br />
-<br />
Total Fund Balances<br />
$ 2,587,414 $ - $ - Total Liabilities and Fund Balances<br />
95<br />
(Continued)
City of <strong>Moreno</strong> <strong>Valley</strong><br />
Combining Balance Sheet<br />
Nonmajor Governmental Funds<br />
June 30, 2011<br />
Permanent Funds<br />
Celebration Equestrian Rockridge<br />
Park<br />
Trail<br />
Park<br />
Endowment Endowment Endowment<br />
Assets:<br />
Pooled cash and investments<br />
Receivables:<br />
$ 58,294 $ 11,868 $ 100,000<br />
Accounts -<br />
-<br />
-<br />
Notes and loans -<br />
-<br />
-<br />
Interest -<br />
-<br />
-<br />
Prepaid costs -<br />
-<br />
-<br />
Due from other governments -<br />
-<br />
-<br />
Advances to other funds<br />
Restricted assets:<br />
-<br />
-<br />
-<br />
Cash with fiscal agents -<br />
-<br />
-<br />
Total Assets $ 58,294 $ 11,868 $ 100,000<br />
Liabilities and Fund Balances:<br />
Liabilities:<br />
Accounts payable $ - $ - $<br />
-<br />
Accrued liabilities -<br />
-<br />
-<br />
Deferred revenues -<br />
-<br />
-<br />
Unearned revenues -<br />
-<br />
-<br />
Due to other governments -<br />
-<br />
-<br />
Due to other funds -<br />
-<br />
-<br />
Total Liabilities -<br />
Fund Balances:<br />
Nonspendable:<br />
Prepaid costs -<br />
Notes and loans -<br />
Advances to other funds -<br />
Permanent fund principal<br />
Restricted for:<br />
58,294<br />
Community development projects -<br />
Public safety -<br />
Community and cultural -<br />
Public works -<br />
Capital Projects -<br />
Debt service -<br />
Water quality<br />
Assigned to:<br />
-<br />
Capital Projects -<br />
Unassigned -<br />
Total Fund Balances 58,294<br />
-<br />
-<br />
-<br />
-<br />
11,868<br />
-<br />
-<br />
-<br />
-<br />
-<br />
-<br />
-<br />
-<br />
-<br />
11,868<br />
-<br />
-<br />
-<br />
-<br />
100,000<br />
-<br />
-<br />
-<br />
-<br />
-<br />
-<br />
-<br />
-<br />
-<br />
100,000<br />
Total Liabilities and Fund Balances $ 58,294 $ 11,868 $ 100,000<br />
96
Total Nonmajor<br />
Governmental<br />
Funds<br />
Assets:<br />
$ 48,407,839 Pooled cash and investments<br />
Receivables:<br />
2,197,148 Accounts<br />
3,977,575 Notes and loans<br />
228,883 Interest<br />
12,058 Prepaid costs<br />
4,114,660 Due from other governments<br />
580,657 Advances to other funds<br />
Restricted assets:<br />
8,456,291 Cash with fiscal agents<br />
$ 67,975,111 Total Assets<br />
$ 4,976,931<br />
Liabilities and Fund Balances:<br />
Liabilities:<br />
Accounts payable<br />
167,283 Accrued liabilities<br />
1,428,074 Deferred revenues<br />
212,313 Unearned revenues<br />
7,733 Due to other governments<br />
3,120,739 Due to other funds<br />
9,913,073<br />
Total Liabilities<br />
12,058<br />
Fund Balances:<br />
Nonspendable:<br />
Prepaid costs<br />
3,977,575 Notes and loans<br />
580,657 Advances to other funds<br />
Restricted for:<br />
3,102,065 Community development projects<br />
644,786 Public safety<br />
5,292 Community and cultural<br />
13,679,219 Public works<br />
8,331,206 Capital Projects<br />
12,867,643 Debt service<br />
170,162 Endowment<br />
301,868 Water quality<br />
Assigned to:<br />
15,151,482 Capital Projects<br />
(761,975) Unassigned<br />
58,062,038<br />
Total Fund Balances<br />
$ 67,975,111 Total Liabilities and Fund Balances<br />
97
City of <strong>Moreno</strong> <strong>Valley</strong><br />
Combining Statement of Revenues,<br />
Expenditures and Changes in Fund Balances<br />
Nonmajor Governmental Funds<br />
Year Ended June 30, 2011<br />
Total Revenues 2,930,715<br />
Special Revenue Funds<br />
State Gasoline Article 3<br />
Tax Transportation Measure A<br />
Revenues:<br />
Taxes<br />
Property taxes $ - $ - $<br />
-<br />
Other taxes -<br />
-<br />
-<br />
Intergovernmental 2,887,794<br />
- 3,738,877<br />
Charges for services -<br />
-<br />
-<br />
Use of money and property (2,664)<br />
-<br />
193,312<br />
Miscellaneous 45,585<br />
-<br />
38,892<br />
-<br />
3,971,081<br />
Expenditures:<br />
Current:<br />
General government -<br />
-<br />
-<br />
Public safety -<br />
-<br />
-<br />
Community development -<br />
-<br />
-<br />
Community and cultural -<br />
-<br />
-<br />
Public works 2,623,452<br />
- 2,014,016<br />
Capital outlay<br />
Debt service:<br />
11,957<br />
- 3,765,074<br />
Principal retirement -<br />
-<br />
-<br />
Interest and fiscal charges<br />
- - -<br />
Total Expenditures 2,635,409<br />
Excess (Deficiency) of Revenues<br />
Over (Under) Expenditures 295,306<br />
Other Financing Sources (Uses):<br />
Transfers in 226,000<br />
Transfers out -<br />
Refunding bonds issued -<br />
Refunding bonds issuance cost -<br />
Total Other Financing Sources<br />
(Uses) 226,000<br />
Net Change in Fund Balances 521,306<br />
Fund Balances, Beginning of Year 709,798<br />
Restatements (239,074)<br />
Fund Balances, Beginning of Year, as Restated 470,724<br />
-<br />
-<br />
-<br />
-<br />
-<br />
-<br />
-<br />
-<br />
-<br />
-<br />
-<br />
5,779,090<br />
(1,808,009)<br />
-<br />
-<br />
-<br />
-<br />
-<br />
(1,808,009)<br />
11,564,600<br />
-<br />
11,564,600<br />
Fund Balances, End of Year $ 992,030 $ - $ 9,756,591<br />
98
Law<br />
Air Quality<br />
Enforcement Other Grants Management<br />
$ - $ - $ -<br />
Revenues:<br />
Taxes<br />
Property taxes<br />
-<br />
-<br />
- Other taxes<br />
679,538<br />
787,120<br />
205,318 Intergovernmental<br />
-<br />
-<br />
- Charges for services<br />
(2,846)<br />
567<br />
9,336 Use of money and property<br />
2,890<br />
496,998<br />
- Miscellaneous<br />
679,582<br />
Special Revenue Funds<br />
1,284,685<br />
214,654<br />
Total Revenues<br />
-<br />
477,232<br />
-<br />
Expenditures:<br />
Current:<br />
General government<br />
727,193<br />
69,451<br />
- Public safety<br />
-<br />
20,813<br />
- Community development<br />
-<br />
-<br />
- Community and cultural<br />
-<br />
-<br />
243,276 Public works<br />
38,974<br />
644,962<br />
128,620 Capital outlay<br />
Debt service:<br />
-<br />
-<br />
- Principal retirement<br />
- - - Interest and fiscal charges<br />
766,167<br />
(86,585)<br />
84,907<br />
-<br />
-<br />
-<br />
84,907<br />
(1,678)<br />
1,482<br />
-<br />
1,482<br />
1,212,458<br />
72,227<br />
350,000<br />
-<br />
-<br />
-<br />
350,000<br />
422,227<br />
1,922,259<br />
-<br />
1,922,259<br />
371,896<br />
(157,242)<br />
-<br />
-<br />
-<br />
-<br />
-<br />
(157,242)<br />
554,228<br />
-<br />
554,228<br />
Total Expenditures<br />
Excess (Deficiency) of Revenues<br />
Over (Under) Expenditures<br />
Other Financing Sources (Uses):<br />
Transfers in<br />
Transfers out<br />
Refunding bonds issued<br />
Refunding bonds issuance cost<br />
Total Other Financing Sources<br />
(Uses)<br />
Net Change in Fund Balances<br />
Fund Balances, Beginning of Year<br />
Restatements<br />
Fund Balances, Beginning of Year, as Restated<br />
$ (196) $ 2,344,486 $ 396,986 Fund Balances, End of Year<br />
99<br />
(Continued)
Revenues:<br />
Taxes<br />
City of <strong>Moreno</strong> <strong>Valley</strong><br />
Combining Statement of Revenues,<br />
Expenditures and Changes in Fund Balances<br />
Nonmajor Governmental Funds<br />
Year Ended June 30, 2011<br />
Community<br />
Development<br />
Block Grant<br />
Property taxes $ - $ - $<br />
-<br />
Other taxes -<br />
-<br />
-<br />
Intergovernmental 1,399,429<br />
-<br />
201,211<br />
Charges for services -<br />
882,018<br />
519,331<br />
Use of money and property 5,868<br />
(3,303)<br />
-<br />
Miscellaneous 3,696<br />
-<br />
-<br />
Total Revenues 1,408,993<br />
Special Revenue Funds<br />
Special<br />
Districts<br />
Administration<br />
878,715<br />
Storm Water<br />
Management<br />
720,542<br />
Expenditures:<br />
Current:<br />
General government -<br />
-<br />
-<br />
Public safety -<br />
-<br />
-<br />
Community development 1,287,221<br />
-<br />
-<br />
Community and cultural -<br />
-<br />
-<br />
Public works - 1,038,847<br />
915,995<br />
Capital outlay<br />
Debt service:<br />
174,853<br />
-<br />
-<br />
Principal retirement -<br />
-<br />
-<br />
Interest and fiscal charges<br />
- - -<br />
Total Expenditures 1,462,074<br />
Excess (Deficiency) of Revenues<br />
Over (Under) Expenditures (53,081)<br />
Other Financing Sources (Uses):<br />
Transfers in -<br />
Transfers out -<br />
Refunding bonds issued -<br />
Refunding bonds issuance cost -<br />
Total Other Financing Sources<br />
(Uses) -<br />
Net Change in Fund Balances (53,081)<br />
Fund Balances, Beginning of Year 128,948<br />
Restatements -<br />
Fund Balances, Beginning of Year, as Restated 128,948<br />
1,038,847<br />
(160,132)<br />
-<br />
(90,290)<br />
-<br />
-<br />
(90,290)<br />
(250,422)<br />
954,031<br />
-<br />
954,031<br />
915,995<br />
(195,453)<br />
188,600<br />
-<br />
-<br />
-<br />
188,600<br />
(6,853)<br />
308,721<br />
-<br />
308,721<br />
Fund Balances, End of Year $ 75,867 $ 703,609 $ 301,868<br />
100
Child Care Used Oil<br />
HOME<br />
Grant<br />
Recycling<br />
$ - $ - $ -<br />
Revenues:<br />
Taxes<br />
Property taxes<br />
-<br />
-<br />
- Other taxes<br />
45,601<br />
610,012<br />
53,468 Intergovernmental<br />
-<br />
22,802<br />
- Charges for services<br />
26,542<br />
-<br />
- Use of money and property<br />
-<br />
-<br />
- Miscellaneous<br />
72,143<br />
Special Revenue Funds<br />
632,814<br />
53,468<br />
Total Revenues<br />
-<br />
-<br />
27,794<br />
Expenditures:<br />
Current:<br />
General government<br />
-<br />
-<br />
- Public safety<br />
49,741<br />
-<br />
- Community development<br />
-<br />
616,374<br />
- Community and cultural<br />
-<br />
-<br />
- Public works<br />
65,956<br />
-<br />
- Capital outlay<br />
Debt service:<br />
-<br />
16,440<br />
- Principal retirement<br />
- - - Interest and fiscal charges<br />
115,697<br />
(43,554)<br />
-<br />
-<br />
-<br />
-<br />
-<br />
(43,554)<br />
4,405,942<br />
-<br />
4,405,942<br />
632,814<br />
-<br />
-<br />
-<br />
-<br />
-<br />
-<br />
-<br />
(14,140)<br />
(4,185)<br />
(18,325)<br />
27,794<br />
25,674<br />
-<br />
-<br />
-<br />
-<br />
-<br />
25,674<br />
(25,674)<br />
-<br />
(25,674)<br />
Total Expenditures<br />
Excess (Deficiency) of Revenues<br />
Over (Under) Expenditures<br />
Other Financing Sources (Uses):<br />
Transfers in<br />
Transfers out<br />
Refunding bonds issued<br />
Refunding bonds issuance cost<br />
Total Other Financing Sources<br />
(Uses)<br />
Net Change in Fund Balances<br />
Fund Balances, Beginning of Year<br />
Restatements<br />
Fund Balances, Beginning of Year, as Restated<br />
$ 4,362,388 $ (18,325) $ - Fund Balances, End of Year<br />
101<br />
(Continued)
Revenues:<br />
Taxes<br />
City of <strong>Moreno</strong> <strong>Valley</strong><br />
Combining Statement of Revenues,<br />
Expenditures and Changes in Fund Balances<br />
Nonmajor Governmental Funds<br />
Year Ended June 30, 2011<br />
Traffic<br />
Congestion<br />
Relief<br />
Property taxes $ - $ - $<br />
-<br />
Other taxes -<br />
-<br />
-<br />
Intergovernmental -<br />
390,239<br />
-<br />
Charges for services -<br />
-<br />
-<br />
Use of money and property 31,475<br />
-<br />
-<br />
Miscellaneous -<br />
-<br />
-<br />
Total Revenues 31,475<br />
Special Revenue Funds<br />
Storm Water<br />
Maintenance H.E.A.L.<br />
390,239<br />
Expenditures:<br />
Current:<br />
General government -<br />
-<br />
-<br />
Public safety -<br />
-<br />
-<br />
Community development -<br />
-<br />
3,000<br />
Community and cultural -<br />
-<br />
-<br />
Public works 61,650<br />
302,605<br />
-<br />
Capital outlay<br />
Debt service:<br />
1,518,268<br />
-<br />
-<br />
Principal retirement -<br />
-<br />
-<br />
Interest and fiscal charges<br />
- - -<br />
Total Expenditures 1,579,918<br />
Excess (Deficiency) of Revenues<br />
Over (Under) Expenditures (1,548,443)<br />
Other Financing Sources (Uses):<br />
Transfers in -<br />
Transfers out -<br />
Refunding bonds issued -<br />
Refunding bonds issuance cost -<br />
Total Other Financing Sources<br />
(Uses) -<br />
Net Change in Fund Balances (1,548,443)<br />
Fund Balances, Beginning of Year 1,560,771<br />
Restatements -<br />
Fund Balances, Beginning of Year, as Restated 1,560,771<br />
302,605<br />
87,634<br />
-<br />
-<br />
-<br />
-<br />
-<br />
87,634<br />
(19,170)<br />
-<br />
(19,170)<br />
-<br />
3,000<br />
(3,000)<br />
-<br />
-<br />
-<br />
-<br />
-<br />
(3,000)<br />
Fund Balances, End of Year $ 12,328 $ 68,464 $<br />
-<br />
102<br />
3,000<br />
-<br />
3,000
ASES<br />
Neighborhood<br />
Program<br />
Stabilization<br />
Grants CFD #4M<br />
Grant<br />
$ - $ - $ -<br />
Revenues:<br />
Taxes<br />
Property taxes<br />
-<br />
-<br />
- Other taxes<br />
5,951,162<br />
- 3,322,567 Intergovernmental<br />
-<br />
33,904<br />
- Charges for services<br />
5,638<br />
1,039<br />
- Use of money and property<br />
4,767<br />
-<br />
- Miscellaneous<br />
5,961,567<br />
Special Revenue Funds<br />
34,943<br />
3,322,567<br />
Total Revenues<br />
-<br />
-<br />
-<br />
Expenditures:<br />
Current:<br />
General government<br />
-<br />
-<br />
- Public safety<br />
-<br />
- 2,991,605 Community development<br />
6,072,946<br />
-<br />
- Community and cultural<br />
-<br />
27,887<br />
- Public works<br />
-<br />
-<br />
- Capital outlay<br />
Debt service:<br />
-<br />
-<br />
- Principal retirement<br />
- - - Interest and fiscal charges<br />
6,072,946<br />
(111,379)<br />
-<br />
-<br />
-<br />
-<br />
-<br />
(111,379)<br />
115,293<br />
-<br />
115,293<br />
27,887<br />
7,056<br />
-<br />
-<br />
-<br />
-<br />
-<br />
7,056<br />
55,783<br />
-<br />
55,783<br />
2,991,605<br />
330,962<br />
-<br />
-<br />
-<br />
-<br />
-<br />
330,962<br />
(848,212)<br />
-<br />
(848,212)<br />
Total Expenditures<br />
Excess (Deficiency) of Revenues<br />
Over (Under) Expenditures<br />
Other Financing Sources (Uses):<br />
Transfers in<br />
Transfers out<br />
Refunding bonds issued<br />
Refunding bonds issuance cost<br />
Total Other Financing Sources<br />
(Uses)<br />
Net Change in Fund Balances<br />
Fund Balances, Beginning of Year<br />
Restatements<br />
Fund Balances, Beginning of Year, as Restated<br />
$ 3,914 $ 62,839 $ (517,250) Fund Balances, End of Year<br />
103<br />
(Continued)
Revenues:<br />
Taxes<br />
City of <strong>Moreno</strong> <strong>Valley</strong><br />
Combining Statement of Revenues,<br />
Expenditures and Changes in Fund Balances<br />
Nonmajor Governmental Funds<br />
Year Ended June 30, 2011<br />
Homelessness<br />
Prevention<br />
Program<br />
Property taxes $ - $ - $<br />
-<br />
Other taxes -<br />
-<br />
-<br />
Intergovernmental 217,810<br />
331,974 1,806,198<br />
Charges for services -<br />
-<br />
-<br />
Use of money and property -<br />
-<br />
-<br />
Miscellaneous -<br />
-<br />
-<br />
Total Revenues 217,810<br />
Special Revenue Funds<br />
CDBG<br />
Recovery Act<br />
of 2009<br />
331,974<br />
Prop 42<br />
Replacement<br />
Funds<br />
1,806,198<br />
Expenditures:<br />
Current:<br />
General government -<br />
-<br />
-<br />
Public safety -<br />
-<br />
-<br />
Community development 229,466<br />
224,133<br />
-<br />
Community and cultural -<br />
-<br />
-<br />
Public works -<br />
-<br />
-<br />
Capital outlay<br />
Debt service:<br />
-<br />
-<br />
-<br />
Principal retirement -<br />
-<br />
-<br />
Interest and fiscal charges<br />
- - -<br />
Total Expenditures 229,466<br />
Excess (Deficiency) of Revenues<br />
Over (Under) Expenditures (11,656)<br />
Other Financing Sources (Uses):<br />
Transfers in -<br />
Transfers out -<br />
Refunding bonds issued -<br />
Refunding bonds issuance cost -<br />
Total Other Financing Sources<br />
(Uses) -<br />
Net Change in Fund Balances (11,656)<br />
Fund Balances, Beginning of Year -<br />
Restatements -<br />
Fund Balances, Beginning of Year, as Restated -<br />
224,133<br />
107,841<br />
-<br />
(107,841)<br />
-<br />
-<br />
(107,841)<br />
-<br />
-<br />
-<br />
-<br />
1,806,198<br />
-<br />
-<br />
-<br />
-<br />
-<br />
1,806,198<br />
Fund Balances, End of Year $ (11,656) $ - $ 1,806,198<br />
104<br />
-<br />
-<br />
-<br />
-
FHWA<br />
TR16-06-1<br />
Targeted<br />
Prop 1B TRANSIMS Rubberized<br />
$ - $ - $ -<br />
Revenues:<br />
Taxes<br />
Property taxes<br />
-<br />
-<br />
- Other taxes<br />
-<br />
78,522<br />
120,000 Intergovernmental<br />
-<br />
-<br />
- Charges for services<br />
-<br />
-<br />
- Use of money and property<br />
598<br />
-<br />
- Miscellaneous<br />
598<br />
Special Revenue Funds<br />
78,522<br />
120,000<br />
Total Revenues<br />
-<br />
-<br />
-<br />
Expenditures:<br />
Current:<br />
General government<br />
-<br />
-<br />
- Public safety<br />
-<br />
-<br />
- Community development<br />
-<br />
-<br />
- Community and cultural<br />
3,835,596<br />
53,047<br />
- Public works<br />
-<br />
-<br />
- Capital outlay<br />
Debt service:<br />
-<br />
-<br />
- Principal retirement<br />
- - - Interest and fiscal charges<br />
3,835,596<br />
(3,834,998)<br />
-<br />
-<br />
-<br />
-<br />
-<br />
(3,834,998)<br />
4,213,093<br />
-<br />
4,213,093<br />
53,047<br />
25,475<br />
(1,142)<br />
-<br />
-<br />
-<br />
(1,142)<br />
24,333<br />
(24,333)<br />
-<br />
(24,333)<br />
-<br />
120,000<br />
-<br />
-<br />
-<br />
-<br />
-<br />
120,000<br />
(26,474)<br />
-<br />
(26,474)<br />
Total Expenditures<br />
Excess (Deficiency) of Revenues<br />
Over (Under) Expenditures<br />
Other Financing Sources (Uses):<br />
Transfers in<br />
Transfers out<br />
Refunding bonds issued<br />
Refunding bonds issuance cost<br />
Total Other Financing Sources<br />
(Uses)<br />
Net Change in Fund Balances<br />
Fund Balances, Beginning of Year<br />
Restatements<br />
Fund Balances, Beginning of Year, as Restated<br />
$ 378,095 $ - $ 93,526 Fund Balances, End of Year<br />
105<br />
(Continued)
City of <strong>Moreno</strong> <strong>Valley</strong><br />
Combining Statement of Revenues,<br />
Expenditures and Changes in Fund Balances<br />
Nonmajor Governmental Funds<br />
Year Ended June 30, 2011<br />
Civil Penalties<br />
Revenues:<br />
Taxes<br />
Property taxes -<br />
Other taxes -<br />
Intergovernmental -<br />
Charges for services -<br />
Use of money and property 7,899<br />
Miscellaneous 59,786<br />
Total Revenues 67,685<br />
Special Revenue Funds<br />
Emergency<br />
Services<br />
Agency Fines Disaster<br />
$ $ - $<br />
-<br />
-<br />
-<br />
51,536<br />
61,586<br />
-<br />
-<br />
4,953<br />
10,669<br />
-<br />
-<br />
56,489<br />
72,255<br />
Expenditures:<br />
Current:<br />
General government -<br />
-<br />
-<br />
Public safety -<br />
-<br />
55,796<br />
Community development 19,905<br />
-<br />
-<br />
Community and cultural -<br />
-<br />
-<br />
Public works -<br />
-<br />
-<br />
Capital outlay<br />
Debt service:<br />
-<br />
-<br />
-<br />
Principal retirement -<br />
-<br />
-<br />
Interest and fiscal charges<br />
- - -<br />
Total Expenditures 19,905<br />
Excess (Deficiency) of Revenues<br />
Over (Under) Expenditures 47,780<br />
Other Financing Sources (Uses):<br />
Transfers in -<br />
Transfers out -<br />
Refunding bonds issued -<br />
Refunding bonds issuance cost -<br />
Total Other Financing Sources<br />
(Uses) -<br />
Net Change in Fund Balances 47,780<br />
Fund Balances, Beginning of Year 284,414<br />
Restatements -<br />
Fund Balances, Beginning of Year, as Restated 284,414<br />
-<br />
56,489<br />
-<br />
-<br />
-<br />
-<br />
-<br />
56,489<br />
198,386<br />
-<br />
198,386<br />
55,796<br />
16,459<br />
-<br />
-<br />
-<br />
-<br />
-<br />
16,459<br />
340,453<br />
-<br />
340,453<br />
Fund Balances, End of Year $ 332,194 $ 254,875 $ 356,912<br />
106
620<br />
-<br />
-<br />
-<br />
-<br />
-<br />
937,649<br />
-<br />
-<br />
Capital Projects Funds<br />
City Hall<br />
Public Works<br />
Capital /<br />
Capital<br />
Capital<br />
Administration Improvements Projects<br />
$ - $ - $ -<br />
Revenues:<br />
Taxes<br />
Property taxes<br />
-<br />
-<br />
- Other taxes<br />
-<br />
-<br />
- Intergovernmental<br />
-<br />
-<br />
321,205 Charges for services<br />
-<br />
-<br />
- Use of money and property<br />
620<br />
-<br />
- Miscellaneous<br />
937,649<br />
(937,029)<br />
-<br />
-<br />
-<br />
-<br />
-<br />
(937,029)<br />
10,521,601<br />
-<br />
10,521,601<br />
-<br />
-<br />
-<br />
-<br />
-<br />
-<br />
-<br />
-<br />
-<br />
-<br />
-<br />
-<br />
-<br />
-<br />
-<br />
-<br />
-<br />
176,852<br />
-<br />
176,852<br />
321,205<br />
-<br />
-<br />
-<br />
-<br />
13,216<br />
307,271<br />
-<br />
-<br />
320,487<br />
718<br />
-<br />
-<br />
-<br />
-<br />
-<br />
718<br />
71,859<br />
-<br />
71,859<br />
Total Revenues<br />
Expenditures:<br />
Current:<br />
General government<br />
Public safety<br />
Community development<br />
Community and cultural<br />
Public works<br />
Capital outlay<br />
Debt service:<br />
Principal retirement<br />
Interest and fiscal charges<br />
Total Expenditures<br />
Excess (Deficiency) of Revenues<br />
Over (Under) Expenditures<br />
Other Financing Sources (Uses):<br />
Transfers in<br />
Transfers out<br />
Refunding bonds issued<br />
Refunding bonds issuance cost<br />
Total Other Financing Sources<br />
(Uses)<br />
Net Change in Fund Balances<br />
Fund Balances, Beginning of Year<br />
Restatements<br />
Fund Balances, Beginning of Year, as Restated<br />
$ 9,584,572 $ 176,852 $ 72,577 Fund Balances, End of Year<br />
107<br />
(Continued)
Revenues:<br />
Taxes<br />
City of <strong>Moreno</strong> <strong>Valley</strong><br />
Combining Statement of Revenues<br />
Expenditures and Changes in Fund Balances<br />
Nonmajor Governmental Funds<br />
Year Ended June 30, 2011<br />
Traffic Signal<br />
Mitigation<br />
Property taxes $ - $ - $<br />
-<br />
Other taxes -<br />
-<br />
-<br />
Intergovernmental -<br />
-<br />
-<br />
Charges for services -<br />
-<br />
-<br />
Use of money and property -<br />
-<br />
-<br />
Miscellaneous -<br />
-<br />
-<br />
Total Revenues -<br />
Expenditures:<br />
Current:<br />
General government -<br />
Public safety -<br />
Community development -<br />
Community and cultural -<br />
Public works -<br />
Capital outlay<br />
Debt service:<br />
-<br />
Principal retirement -<br />
Interest and fiscal charges -<br />
Total Expenditures -<br />
Excess (Deficiency) of Revenues<br />
Over (Under) Expenditures -<br />
Other Financing Sources (Uses):<br />
Transfers in -<br />
Transfers out -<br />
Refunding bonds issued -<br />
Refunding bonds issuance cost -<br />
Total Other Financing Sources<br />
(Uses) -<br />
Net Change in Fund Balances -<br />
Fund Balances, Beginning of Year 137,578<br />
Restatements -<br />
Fund Balances, Beginning of Year, as Restated 137,578<br />
Capital Projects Funds<br />
Fire Services<br />
Capital<br />
Projects<br />
-<br />
-<br />
11,212<br />
-<br />
-<br />
-<br />
42,329<br />
-<br />
-<br />
53,541<br />
(53,541)<br />
-<br />
-<br />
-<br />
-<br />
-<br />
(53,541)<br />
1,903,373<br />
-<br />
1,903,373<br />
Towngate<br />
Capital /<br />
Administration<br />
-<br />
-<br />
-<br />
-<br />
-<br />
188,508<br />
-<br />
-<br />
-<br />
188,508<br />
(188,508)<br />
190,260<br />
-<br />
-<br />
-<br />
190,260<br />
Fund Balances, End of Year $ 137,578 $ 1,849,832 $ 8,101<br />
108<br />
1,752<br />
6,349<br />
-<br />
6,349
Capital Projects Funds<br />
Warner Ranch Auto Mall<br />
Parks and<br />
Community<br />
Services<br />
Capital /<br />
Capital /<br />
Capital<br />
Development Administration Projects<br />
$ 8,325 $ - $ -<br />
Revenues:<br />
Taxes<br />
Property taxes<br />
-<br />
-<br />
- Other taxes<br />
-<br />
-<br />
- Intergovernmental<br />
-<br />
-<br />
- Charges for services<br />
-<br />
-<br />
- Use of money and property<br />
-<br />
-<br />
- Miscellaneous<br />
8,325<br />
-<br />
-<br />
-<br />
-<br />
2,770<br />
-<br />
-<br />
-<br />
2,770<br />
5,555<br />
-<br />
-<br />
-<br />
-<br />
-<br />
5,555<br />
8,118<br />
-<br />
8,118<br />
-<br />
-<br />
-<br />
-<br />
-<br />
138,508<br />
-<br />
-<br />
-<br />
138,508<br />
(138,508)<br />
137,400<br />
-<br />
-<br />
-<br />
137,400<br />
(1,108)<br />
(2,256)<br />
-<br />
(2,256)<br />
-<br />
-<br />
-<br />
-<br />
23,393<br />
1,936<br />
1,109,005<br />
-<br />
-<br />
1,134,334<br />
(1,134,334)<br />
-<br />
-<br />
-<br />
-<br />
-<br />
(1,134,334)<br />
6,451,815<br />
-<br />
6,451,815<br />
Total Revenues<br />
Expenditures:<br />
Current:<br />
General government<br />
Public safety<br />
Community development<br />
Community and cultural<br />
Public works<br />
Capital outlay<br />
Debt service:<br />
Principal retirement<br />
Interest and fiscal charges<br />
Total Expenditures<br />
Excess (Deficiency) of Revenues<br />
Over (Under) Expenditures<br />
Other Financing Sources (Uses):<br />
Transfers in<br />
Transfers out<br />
Refunding bonds issued<br />
Refunding bonds issuance cost<br />
Total Other Financing Sources<br />
(Uses)<br />
Net Change in Fund Balances<br />
Fund Balances, Beginning of Year<br />
Restatements<br />
Fund Balances, Beginning of Year, as Restated<br />
$ 13,673 $ (3,364) $ 5,317,481 Fund Balances, End of Year<br />
109<br />
(Continued)
Revenues:<br />
Taxes<br />
City of <strong>Moreno</strong> <strong>Valley</strong><br />
Combining Statement of Revenues<br />
Expenditures and Changes in Fund Balances<br />
Nonmajor Governmental Funds<br />
Year Ended June 30, 2011<br />
TUMF Capital<br />
Projects<br />
Property taxes $ - $ - $<br />
-<br />
Other taxes -<br />
-<br />
-<br />
Intergovernmental 2,572,753<br />
18,900<br />
-<br />
Charges for services -<br />
-<br />
-<br />
Use of money and property -<br />
-<br />
833<br />
Miscellaneous 2,586<br />
3,992<br />
-<br />
Total Revenues 2,575,339<br />
Expenditures:<br />
Current:<br />
General government -<br />
Public safety -<br />
Community development -<br />
Community and cultural -<br />
Public works 1,007<br />
Capital outlay<br />
Debt service:<br />
2,144,452<br />
Principal retirement -<br />
Interest and fiscal charges -<br />
Total Expenditures 2,145,459<br />
Excess (Deficiency) of Revenues<br />
Over (Under) Expenditures 429,880<br />
Other Financing Sources (Uses):<br />
Transfers in -<br />
Transfers out -<br />
Refunding bonds issued -<br />
Refunding bonds issuance cost -<br />
Total Other Financing Sources<br />
(Uses) -<br />
Net Change in Fund Balances 429,880<br />
Fund Balances, Beginning of Year (640,714)<br />
Restatements -<br />
Fund Balances, Beginning of Year, as Restated (640,714)<br />
Capital Projects Funds<br />
DIF Capital<br />
Projects<br />
22,892<br />
-<br />
-<br />
-<br />
-<br />
141,978<br />
1,719,354<br />
-<br />
-<br />
1,861,332<br />
(1,838,440)<br />
2,035,000<br />
-<br />
-<br />
-<br />
2,035,000<br />
196,560<br />
4,157,699<br />
-<br />
4,157,699<br />
Lease<br />
Revenue<br />
Bonds 2005<br />
Capital<br />
Projects<br />
833<br />
-<br />
-<br />
-<br />
-<br />
-<br />
3,076,335<br />
-<br />
-<br />
3,076,335<br />
(3,075,502)<br />
-<br />
(771)<br />
-<br />
-<br />
(771)<br />
(3,076,273)<br />
5,044,036<br />
-<br />
5,044,036<br />
Fund Balances, End of Year $ (210,834) $ 4,354,259 $ 1,967,763<br />
110
449,473<br />
-<br />
-<br />
-<br />
-<br />
-<br />
-<br />
-<br />
449,473<br />
Debt Service Funds<br />
OPA Sales<br />
Auto Mall<br />
Tax City Hall COPs Special Tax<br />
Agreements Series 1997 Bonds<br />
$ - $ - $ -<br />
Revenues:<br />
Taxes<br />
Property taxes<br />
-<br />
-<br />
78,021 Other taxes<br />
-<br />
-<br />
- Intergovernmental<br />
-<br />
-<br />
- Charges for services<br />
449,473<br />
-<br />
155 Use of money and property<br />
-<br />
-<br />
- Miscellaneous<br />
449,473<br />
-<br />
-<br />
-<br />
-<br />
-<br />
-<br />
-<br />
-<br />
-<br />
-<br />
-<br />
-<br />
-<br />
-<br />
-<br />
-<br />
-<br />
4,875,000<br />
85,585<br />
4,960,585<br />
(4,960,585)<br />
5,082,025<br />
(1,060,505)<br />
-<br />
-<br />
4,021,520<br />
(939,065)<br />
939,065<br />
-<br />
939,065<br />
78,176<br />
-<br />
-<br />
-<br />
-<br />
-<br />
-<br />
1,045,000<br />
241,750<br />
1,286,750<br />
(1,208,574)<br />
96,489<br />
(137,400)<br />
-<br />
-<br />
(40,911)<br />
(1,249,485)<br />
2,367,173<br />
-<br />
2,367,173<br />
Total Revenues<br />
Expenditures:<br />
Current:<br />
General government<br />
Public safety<br />
Community development<br />
Community and cultural<br />
Public works<br />
Capital outlay<br />
Debt service:<br />
Principal retirement<br />
Interest and fiscal charges<br />
Total Expenditures<br />
Excess (Deficiency) of Revenues<br />
Over (Under) Expenditures<br />
Other Financing Sources (Uses):<br />
Transfers in<br />
Transfers out<br />
Refunding bonds issued<br />
Refunding bonds issuance cost<br />
Total Other Financing Sources<br />
(Uses)<br />
Net Change in Fund Balances<br />
Fund Balances, Beginning of Year<br />
Restatements<br />
Fund Balances, Beginning of Year, as Restated<br />
$ - $ - $ 1,117,688 Fund Balances, End of Year<br />
111<br />
(Continued)
Revenues:<br />
Taxes<br />
City of <strong>Moreno</strong> <strong>Valley</strong><br />
Combining Statement of Revenues<br />
Expenditures and Changes in Fund Balances<br />
Nonmajor Governmental Funds<br />
Year Ended June 30, 2011<br />
Public Safety<br />
Lease Revenue<br />
Bonds 1997<br />
Property taxes $ - $ - $<br />
-<br />
Other taxes -<br />
-<br />
112,162<br />
Intergovernmental -<br />
-<br />
-<br />
Charges for services -<br />
-<br />
-<br />
Use of money and property 22,796<br />
244<br />
64<br />
Miscellaneous -<br />
-<br />
-<br />
Total Revenues 22,796<br />
Expenditures:<br />
Current:<br />
General government -<br />
Public safety -<br />
Community development -<br />
Community and cultural -<br />
Public works -<br />
Capital outlay<br />
Debt service:<br />
-<br />
Principal retirement 3,705,000<br />
Interest and fiscal charges 202,216<br />
Total Expenditures 3,907,216<br />
Excess (Deficiency) of Revenues<br />
Over (Under) Expenditures (3,884,420)<br />
Other Financing Sources (Uses):<br />
Transfers in 3,559,407<br />
Transfers out (438,751)<br />
Refunding bonds issued -<br />
Refunding bonds issuance cost -<br />
Total Other Financing Sources<br />
(Uses) 3,120,656<br />
Net Change in Fund Balances (763,764)<br />
Fund Balances, Beginning of Year 763,764<br />
Restatements -<br />
Fund Balances, Beginning of Year, as Restated 763,764<br />
Debt Service Funds<br />
Lease<br />
Revenue<br />
Bonds 2005<br />
Debt Service<br />
244<br />
-<br />
-<br />
-<br />
-<br />
-<br />
-<br />
840,000<br />
1,801,743<br />
2,641,743<br />
(2,641,499)<br />
2,644,136<br />
-<br />
-<br />
-<br />
2,644,136<br />
2,637<br />
8,788,144<br />
-<br />
8,788,144<br />
2007<br />
Towngate<br />
Improvement<br />
Refunding<br />
112,226<br />
-<br />
-<br />
-<br />
-<br />
-<br />
-<br />
195,000<br />
160,375<br />
355,375<br />
(243,149)<br />
276,459<br />
(47,480)<br />
-<br />
-<br />
228,979<br />
(14,170)<br />
820,975<br />
-<br />
820,975<br />
Fund Balances, End of Year $ - $ 8,790,781 $ 806,805<br />
112
231<br />
-<br />
-<br />
-<br />
-<br />
-<br />
-<br />
630,000<br />
382,569<br />
Debt Service Funds<br />
2007<br />
2011 Priv<br />
Placement Ref 2011 Priv<br />
Towngate 97 Lease Rev Placement Ref<br />
Refunding Bonds<br />
97 COPs<br />
$ - $ - $ -<br />
Revenues:<br />
Taxes<br />
Property taxes<br />
-<br />
-<br />
- Other taxes<br />
-<br />
-<br />
- Intergovernmental<br />
-<br />
-<br />
- Charges for services<br />
231<br />
-<br />
- Use of money and property<br />
-<br />
-<br />
- Miscellaneous<br />
1,012,569<br />
(1,012,338)<br />
1,168,536<br />
(142,780)<br />
-<br />
-<br />
1,025,756<br />
13,418<br />
2,138,951<br />
-<br />
2,138,951<br />
-<br />
-<br />
-<br />
-<br />
-<br />
-<br />
-<br />
-<br />
32,557<br />
32,557<br />
(32,557)<br />
-<br />
(3,155,207)<br />
3,272,000<br />
(84,236)<br />
32,557<br />
-<br />
-<br />
-<br />
-<br />
-<br />
-<br />
-<br />
-<br />
-<br />
-<br />
-<br />
-<br />
-<br />
-<br />
-<br />
-<br />
(4,260,000)<br />
4,343,500<br />
(83,500)<br />
-<br />
-<br />
-<br />
-<br />
-<br />
Total Revenues<br />
Expenditures:<br />
Current:<br />
General government<br />
Public safety<br />
Community development<br />
Community and cultural<br />
Public works<br />
Capital outlay<br />
Debt service:<br />
Principal retirement<br />
Interest and fiscal charges<br />
Total Expenditures<br />
Excess (Deficiency) of Revenues<br />
Over (Under) Expenditures<br />
Other Financing Sources (Uses):<br />
Transfers in<br />
Transfers out<br />
Refunding bonds issued<br />
Refunding bonds issuance cost<br />
Total Other Financing Sources<br />
(Uses)<br />
Net Change in Fund Balances<br />
Fund Balances, Beginning of Year<br />
Restatements<br />
Fund Balances, Beginning of Year, as Restated<br />
$ 2,152,369 $ - $ - Fund Balances, End of Year<br />
113<br />
(Continued)
Revenues:<br />
Taxes<br />
City of <strong>Moreno</strong> <strong>Valley</strong><br />
Combining Statement of Revenues<br />
Expenditures and Changes in Fund Balances<br />
Nonmajor Governmental Funds<br />
Year Ended June 30, 2011<br />
Celebration<br />
Park<br />
Endowment<br />
Property taxes $ - $ - $<br />
-<br />
Other taxes -<br />
-<br />
-<br />
Intergovernmental -<br />
-<br />
-<br />
Charges for services -<br />
-<br />
-<br />
Use of money and property 990<br />
174<br />
-<br />
Miscellaneous -<br />
-<br />
-<br />
Total Revenues 990<br />
Expenditures:<br />
Current:<br />
General government -<br />
Public safety -<br />
Community development -<br />
Community and cultural -<br />
Public works -<br />
Capital outlay<br />
Debt service:<br />
-<br />
Principal retirement -<br />
Interest and fiscal charges -<br />
Total Expenditures -<br />
Excess (Deficiency) of Revenues<br />
Over (Under) Expenditures 990<br />
Other Financing Sources (Uses):<br />
Transfers in -<br />
Transfers out -<br />
Refunding bonds issued -<br />
Refunding bonds issuance cost -<br />
Total Other Financing Sources<br />
(Uses) -<br />
Net Change in Fund Balances 990<br />
Fund Balances, Beginning of Year 57,304<br />
Restatements -<br />
Fund Balances, Beginning of Year, as Restated 57,304<br />
Permanent Funds<br />
Equestrian<br />
Trail<br />
Endowment<br />
174<br />
-<br />
-<br />
-<br />
-<br />
289<br />
-<br />
-<br />
-<br />
289<br />
(115)<br />
-<br />
-<br />
-<br />
-<br />
-<br />
(115)<br />
11,983<br />
-<br />
11,983<br />
Rockridge<br />
Park<br />
Endowment<br />
-<br />
-<br />
-<br />
-<br />
-<br />
-<br />
-<br />
-<br />
-<br />
-<br />
-<br />
-<br />
-<br />
-<br />
-<br />
-<br />
-<br />
100,000<br />
-<br />
100,000<br />
Fund Balances, End of Year $ 58,294 $ 11,868 $ 100,000<br />
114
Total Nonmajor<br />
Governmental<br />
Funds<br />
Revenues:<br />
Taxes<br />
$ 8,325 Property taxes<br />
190,183 Other taxes<br />
25,531,615 Intergovernmental<br />
1,779,260 Charges for services<br />
763,445 Use of money and property<br />
660,410 Miscellaneous<br />
28,933,238<br />
505,026<br />
863,652<br />
4,825,884<br />
6,712,713<br />
11,604,583<br />
15,685,059<br />
11,306,440<br />
3,356,268<br />
54,859,625<br />
(25,926,387)<br />
16,038,077<br />
(9,441,025)<br />
7,615,500<br />
(167,736)<br />
14,044,816<br />
(11,881,571)<br />
70,186,868<br />
(243,259)<br />
69,943,609<br />
Total Revenues<br />
Expenditures:<br />
Current:<br />
General government<br />
Public safety<br />
Community development<br />
Community and cultural<br />
Public works<br />
Capital outlay<br />
Debt service:<br />
Principal retirement<br />
Interest and fiscal charges<br />
Total Expenditures<br />
Excess (Deficiency) of Revenues<br />
Over (Under) Expenditures<br />
Other Financing Sources (Uses):<br />
Transfers in<br />
Transfers out<br />
Refunding bonds issued<br />
Refunding bonds issuance cost<br />
Total Other Financing Sources<br />
(Uses)<br />
Net Change in Fund Balances<br />
Fund Balances, Beginning of Year<br />
Restatements<br />
Fund Balances, Beginning of Year, as Restated<br />
$ 58,062,038 Fund Balances, End of Year<br />
115
City of <strong>Moreno</strong> <strong>Valley</strong><br />
Budgetary Comparison Schedule<br />
State Gasoline Tax<br />
Year Ended June 30, 2011<br />
Budget Amounts Actual<br />
Variance with<br />
Final Budget<br />
Positive<br />
Original Final Amounts (Negative)<br />
Revenues:<br />
Intergovernmental $ 2,702,500 $ 2,702,500 $ 2,887,794 $ 185,294<br />
Use of money and property 5,000<br />
5,000 (2,664) (7,664)<br />
Miscellaneous 2,000<br />
2,000 45,585<br />
43,585<br />
Total Revenues 2,709,500 2,709,500 2,930,715 221,215<br />
Expenditures:<br />
Current:<br />
Public works 2,836,686<br />
Capital outlay -<br />
Total Expenditures 2,836,686<br />
Excess (Deficiency) of Revenues<br />
Over (Under) Expenditures (127,186)<br />
Other Financing Sources (Uses):<br />
Transfers in -<br />
Total Other Financing Sources (Uses) -<br />
Net Change in Fund Balances (127,186)<br />
Fund Balance, Beginning of Year, as Restated 470,724<br />
2,836,687<br />
76,000<br />
2,912,687<br />
(203,187)<br />
226,000<br />
226,000<br />
22,813<br />
470,724<br />
2,623,452<br />
11,957<br />
2,635,409<br />
295,306<br />
226,000<br />
226,000<br />
521,306<br />
470,724<br />
213,235<br />
64,043<br />
277,278<br />
(56,063)<br />
-<br />
-<br />
(56,063)<br />
Fund Balance, End of Year $ 343,538 $ 493,537 $ 992,030 $ (56,063)<br />
116<br />
-
City of <strong>Moreno</strong> <strong>Valley</strong><br />
Budgetary Comparison Schedule<br />
Measure A<br />
Year Ended June 30, 2011<br />
Budget Amounts Actual<br />
Variance with<br />
Final Budget<br />
Positive<br />
Original Final Amounts (Negative)<br />
Revenues:<br />
Intergovernmental $ 10,009,820 $ 17,747,278 $ 3,738,877 $ (14,008,401)<br />
Use of money and property 309,000 309,000 193,312 (115,688)<br />
Miscellaneous 1,000<br />
1,000 38,892<br />
37,892<br />
Total Revenues 10,319,820 18,057,278 3,971,081 (14,086,197)<br />
Expenditures:<br />
Current:<br />
Public works 1,574,347<br />
Capital outlay 17,965,845<br />
Total Expenditures 19,540,192<br />
Net Change in Fund Balances (9,220,372)<br />
Fund Balance, Beginning of Year 11,564,600<br />
1,574,347<br />
25,735,512<br />
27,309,859<br />
(9,252,581)<br />
11,564,600<br />
2,014,016<br />
3,765,074<br />
5,779,090<br />
(1,808,009)<br />
11,564,600<br />
(439,669)<br />
21,970,438<br />
21,530,769<br />
(35,616,966)<br />
Fund Balance, End of Year $ 2,344,228 $ 2,312,019 $ 9,756,591 $ (35,616,966)<br />
117<br />
-
City of <strong>Moreno</strong> <strong>Valley</strong><br />
Budgetary Comparison Schedule<br />
Law Enforcement<br />
Year Ended June 30, 2011<br />
Budget Amounts Actual<br />
Variance with<br />
Final Budget<br />
Positive<br />
Original Final Amounts (Negative)<br />
Revenues:<br />
Intergovernmental $ 730,818 $ 1,294,145 $ 679,538 $ (614,607)<br />
Use of money and property -<br />
- (2,846) (2,846)<br />
Miscellaneous - 44,685<br />
2,890 (41,795)<br />
Total Revenues 730,818 1,338,830 679,582 (659,248)<br />
Expenditures:<br />
Current:<br />
Public safety 295,118<br />
Capital outlay -<br />
Total Expenditures 295,118<br />
Excess (Deficiency) of Revenues<br />
Over (Under) Expenditures 435,700<br />
Other Financing Sources (Uses):<br />
Transfers in -<br />
Total Other Financing Sources (Uses) -<br />
Net Change in Fund Balances 435,700<br />
Fund Balance, Beginning of Year 1,482<br />
1,236,316<br />
102,514<br />
1,338,830<br />
-<br />
-<br />
-<br />
-<br />
1,482<br />
727,193<br />
38,974<br />
766,167<br />
(86,585)<br />
84,907<br />
84,907<br />
(1,678)<br />
1,482<br />
509,123<br />
63,540<br />
572,663<br />
(1,231,911)<br />
84,907<br />
84,907<br />
(1,147,004)<br />
Fund Balance, End of Year $ 437,182 $ 1,482 $ (196) $ (1,147,004)<br />
118<br />
-
City of <strong>Moreno</strong> <strong>Valley</strong><br />
Budgetary Comparison Schedule<br />
Other Grants<br />
Year Ended June 30, 2011<br />
Budget Amounts Actual<br />
Variance with<br />
Final Budget<br />
Positive<br />
Original Final Amounts (Negative)<br />
Revenues:<br />
Intergovernmental $ 1,658,016 $ 2,074,204 $ 787,120 $ (1,287,084)<br />
Use of money and property -<br />
-<br />
567<br />
567<br />
Miscellaneous 250,000 250,000 496,998 246,998<br />
Total Revenues 1,908,016 2,324,204 1,284,685 (1,039,519)<br />
Expenditures:<br />
Current:<br />
General government 438,812<br />
Public safety 50,950<br />
Community development -<br />
Capital outlay 1,594,016<br />
Total Expenditures 2,083,778<br />
Excess (Deficiency) of Revenues<br />
Over (Under) Expenditures (175,762)<br />
Other Financing Sources (Uses):<br />
Transfers in 300,000<br />
Total Other Financing Sources (Uses) 300,000<br />
Net Change in Fund Balances 124,238<br />
Fund Balance, Beginning of Year 1,922,259<br />
522,000<br />
50,950<br />
18,286<br />
1,970,100<br />
2,561,336<br />
(237,132)<br />
350,000<br />
350,000<br />
112,868<br />
1,922,259<br />
477,232<br />
69,451<br />
20,813<br />
644,962<br />
1,212,458<br />
72,227<br />
350,000<br />
350,000<br />
422,227<br />
1,922,259<br />
44,768<br />
(18,501)<br />
(2,527)<br />
1,325,138<br />
1,348,878<br />
(2,388,397)<br />
-<br />
-<br />
(2,388,397)<br />
Fund Balance, End of Year $ 2,046,497 $ 2,035,127 $ 2,344,486 $ (2,388,397)<br />
119<br />
-
City of <strong>Moreno</strong> <strong>Valley</strong><br />
Budgetary Comparison Schedule<br />
Air Quality Management<br />
Year Ended June 30, 2011<br />
Budget Amounts Actual<br />
Variance with<br />
Final Budget<br />
Positive<br />
Original Final Amounts (Negative)<br />
Revenues:<br />
Intergovernmental $ 200,000 $ 200,000 $ 205,318 $ 5,318<br />
Use of money and property 7,000<br />
7,000<br />
9,336<br />
2,336<br />
Total Revenues 207,000 207,000 214,654<br />
7,654<br />
Expenditures:<br />
Current:<br />
Public works 207,181<br />
Capital outlay 313,517<br />
Total Expenditures 520,698<br />
Net Change in Fund Balances (313,698)<br />
Fund Balance, Beginning of Year 554,228<br />
207,181<br />
495,487<br />
702,668<br />
(495,668)<br />
554,228<br />
243,276<br />
128,620<br />
371,896<br />
(157,242)<br />
554,228<br />
(36,095)<br />
366,867<br />
330,772<br />
(323,118)<br />
Fund Balance, End of Year $ 240,530 $ 58,560 $ 396,986 $ (323,118)<br />
120<br />
-
City of <strong>Moreno</strong> <strong>Valley</strong><br />
Budgetary Comparison Schedule<br />
Community Development Block Grant<br />
Year Ended June 30, 2011<br />
Budget Amounts Actual<br />
Variance with<br />
Final Budget<br />
Positive<br />
Original Final Amounts (Negative)<br />
Revenues:<br />
Intergovernmental $ 2,384,952 $ 2,384,952 $ 1,399,429 $ (985,523)<br />
Use of money and property -<br />
-<br />
5,868<br />
5,868<br />
Miscellaneous -<br />
-<br />
3,696<br />
3,696<br />
Total Revenues 2,384,952 2,384,952 1,408,993 (975,959)<br />
Expenditures:<br />
Current:<br />
Community development 1,923,718<br />
Capital outlay 427,318<br />
Total Expenditures 2,351,036<br />
Net Change in Fund Balances 33,916<br />
Fund Balance, Beginning of Year 128,948<br />
2,457,262<br />
513,697<br />
2,970,959<br />
(586,007)<br />
128,948<br />
1,287,221<br />
174,853<br />
1,462,074<br />
(53,081)<br />
128,948<br />
1,170,041<br />
338,844<br />
1,508,885<br />
(2,484,844)<br />
Fund Balance, End of Year $ 162,864 $ (457,059) $ 75,867 $ (2,484,844)<br />
121<br />
-
City of <strong>Moreno</strong> <strong>Valley</strong><br />
Budgetary Comparison Schedule<br />
Special Districts Administration<br />
Year Ended June 30, 2011<br />
Budget Amounts Actual<br />
Variance with<br />
Final Budget<br />
Positive<br />
Original Final Amounts (Negative)<br />
Revenues:<br />
Charges for services $ 770,500 $ 770,500 $ 882,018 $ 111,518<br />
Use of money and property 13,000 13,000 (3,303) (16,303)<br />
Total Revenues 783,500 783,500 878,715<br />
95,215<br />
Expenditures:<br />
Current:<br />
Public works 1,216,305<br />
Total Expenditures 1,216,305<br />
Excess (Deficiency) of Revenues<br />
Over (Under) Expenditures (432,805)<br />
Other Financing Sources (Uses):<br />
Transfers out -<br />
Total Other Financing Sources (Uses) -<br />
Net Change in Fund Balances (432,805)<br />
Fund Balance, Beginning of Year 954,031<br />
1,216,305<br />
1,216,305<br />
(432,805)<br />
-<br />
-<br />
(432,805)<br />
954,031<br />
1,038,847<br />
1,038,847<br />
(160,132)<br />
(90,290)<br />
(90,290)<br />
(250,422)<br />
954,031<br />
177,458<br />
177,458<br />
(82,243)<br />
90,290<br />
90,290<br />
Fund Balance, End of Year $ 521,226 $ 521,226 $ 703,609 $ 8,047<br />
122<br />
8,047<br />
-
City of <strong>Moreno</strong> <strong>Valley</strong><br />
Budgetary Comparison Schedule<br />
Storm Water Management<br />
Year Ended June 30, 2011<br />
Budget Amounts Actual<br />
Variance with<br />
Final Budget<br />
Positive<br />
Original Final Amounts (Negative)<br />
Revenues:<br />
Intergovernmental $ 165,300 $ 165,300 $ 201,211 $ 35,911<br />
Charges for services 624,547 651,042 519,331 (131,711)<br />
Total Revenues 789,847 816,342 720,542 (95,800)<br />
Expenditures:<br />
Current:<br />
Public works 931,302<br />
Total Expenditures 931,302<br />
Excess (Deficiency) of Revenues<br />
Over (Under) Expenditures (141,455)<br />
Other Financing Sources (Uses):<br />
Transfers in 215,095<br />
Total Other Financing Sources (Uses) 215,095<br />
Net Change in Fund Balances 73,640<br />
Fund Balance, Beginning of Year 308,721<br />
931,302<br />
931,302<br />
(114,960)<br />
188,600<br />
188,600<br />
73,640<br />
308,721<br />
915,995<br />
915,995<br />
(195,453)<br />
188,600<br />
188,600<br />
(6,853)<br />
308,721<br />
15,307<br />
15,307<br />
(111,107)<br />
-<br />
-<br />
(111,107)<br />
Fund Balance, End of Year $ 382,361 $ 382,361 $ 301,868 $ (111,107)<br />
123<br />
-
City of <strong>Moreno</strong> <strong>Valley</strong><br />
Budgetary Comparison Schedule<br />
HOME<br />
Year Ended June 30, 2011<br />
Budget Amounts Actual<br />
Variance with<br />
Final Budget<br />
Positive<br />
Original Final Amounts (Negative)<br />
Revenues:<br />
Intergovernmental $ 666,600 $ 666,600 $ 45,601 $ (620,999)<br />
Use of money and property -<br />
- 26,542<br />
26,542<br />
Total Revenues 666,600 666,600 72,143 (594,457)<br />
Expenditures:<br />
Current:<br />
Community development 406,670<br />
Capital outlay 282,930<br />
Total Expenditures 689,600<br />
Net Change in Fund Balances (23,000)<br />
Fund Balance, Beginning of Year 4,405,942<br />
649,570<br />
64,742<br />
714,312<br />
(47,712)<br />
4,405,942<br />
49,741<br />
65,956<br />
115,697<br />
(43,554)<br />
4,405,942<br />
599,829<br />
(1,214)<br />
598,615<br />
(1,193,072)<br />
Fund Balance, End of Year $ 4,382,942 $ 4,358,230 $ 4,362,388 $ (1,193,072)<br />
124<br />
-
City of <strong>Moreno</strong> <strong>Valley</strong><br />
Budgetary Comparison Schedule<br />
Child Care Grant<br />
Year Ended June 30, 2011<br />
Budget Amounts Actual<br />
Variance with<br />
Final Budget<br />
Positive<br />
Original Final Amounts (Negative)<br />
Revenues:<br />
Intergovernmental $ 797,300 $ 797,300 $ 610,012 $ (187,288)<br />
Charges for services 25,000 25,000 22,802<br />
(2,198)<br />
Total Revenues 822,300 822,300 632,814 (189,486)<br />
Expenditures:<br />
Current:<br />
Community and cultural 905,092<br />
Debt service:<br />
Principal retirement 16,500<br />
Total Expenditures 921,592<br />
Net Change in Fund Balances (99,292)<br />
Fund Balance, Beginning of Year, as Restated (18,325)<br />
905,092<br />
16,500<br />
921,592<br />
(99,292)<br />
(18,325)<br />
616,374<br />
16,440<br />
632,814<br />
-<br />
(18,325)<br />
288,718<br />
60<br />
288,778<br />
(478,264)<br />
Fund Balance, End of Year $ (117,617) $ (117,617) $ (18,325) $ (478,264)<br />
125<br />
-
City of <strong>Moreno</strong> <strong>Valley</strong><br />
Budgetary Comparison Schedule<br />
Used Oil Recycling<br />
Year Ended June 30, 2011<br />
Budget Amounts Actual<br />
Variance with<br />
Final Budget<br />
Positive<br />
Original Final Amounts (Negative)<br />
Revenues:<br />
Intergovernmental $ 27,900 $ 27,900 $ 53,468 $ 25,568<br />
Total Revenues 27,900 27,900 53,468<br />
25,568<br />
Expenditures:<br />
Current:<br />
General government 27,855<br />
Total Expenditures 27,855<br />
Net Change in Fund Balances 45<br />
Fund Balance, Beginning of Year (25,674)<br />
27,855<br />
27,855<br />
45<br />
(25,674)<br />
27,794<br />
27,794<br />
25,674<br />
(25,674)<br />
61<br />
61<br />
25,507<br />
Fund Balance, End of Year $ (25,629) $ (25,629) $ - $ 25,507<br />
126<br />
-
City of <strong>Moreno</strong> <strong>Valley</strong><br />
Budgetary Comparison Schedule<br />
Traffic Congestion Relief<br />
Year Ended June 30, 2011<br />
Budget Amounts Actual<br />
Variance with<br />
Final Budget<br />
Positive<br />
Original Final Amounts (Negative)<br />
Revenues:<br />
Intergovernmental $ 1,830,944 $ 1,830,944 $ - $ (1,830,944)<br />
Use of money and property 32,000 32,000 31,475<br />
(525)<br />
Total Revenues 1,862,944 1,862,944 31,475 (1,831,469)<br />
Expenditures:<br />
Current:<br />
Public works -<br />
Capital outlay 1,550,000<br />
Total Expenditures 1,550,000<br />
Net Change in Fund Balances 312,944<br />
Fund Balance, Beginning of Year 1,560,771<br />
-<br />
1,550,000<br />
1,550,000<br />
312,944<br />
1,560,771<br />
61,650<br />
1,518,268<br />
1,579,918<br />
(1,548,443)<br />
1,560,771<br />
(61,650)<br />
31,732<br />
(29,918)<br />
(1,801,551)<br />
Fund Balance, End of Year $ 1,873,715 $ 1,873,715 $ 12,328 $ (1,801,551)<br />
127<br />
-
City of <strong>Moreno</strong> <strong>Valley</strong><br />
Budgetary Comparison Schedule<br />
Storm Water Maintenance<br />
Year Ended June 30, 2011<br />
Budget Amounts Actual<br />
Variance with<br />
Final Budget<br />
Positive<br />
Original Final Amounts (Negative)<br />
Revenues:<br />
Intergovernmental $ 421,400 $ 421,400 $ 390,239 $ (31,161)<br />
Total Revenues 421,400 421,400 390,239 (31,161)<br />
Expenditures:<br />
Current:<br />
Public works 376,106<br />
Total Expenditures 376,106<br />
Net Change in Fund Balances 45,294<br />
Fund Balance, Beginning of Year (19,170)<br />
376,106<br />
376,106<br />
45,294<br />
(19,170)<br />
302,605<br />
302,605<br />
87,634<br />
(19,170)<br />
73,501<br />
73,501<br />
(104,662)<br />
Fund Balance, End of Year $ 26,124 $ 26,124 $ 68,464 $ (104,662)<br />
128<br />
-
Expenditures:<br />
Current:<br />
City of <strong>Moreno</strong> <strong>Valley</strong><br />
Budgetary Comparison Schedule<br />
H.E.A.L.<br />
Year Ended June 30, 2011<br />
Variance with<br />
Final Budget<br />
Budget Amounts Actual Positive<br />
Original Final Amounts (Negative)<br />
Community development $ - $ 3,000 $ 3,000 $<br />
-<br />
Total Expenditures -<br />
3,000<br />
3,000<br />
-<br />
Net Change in Fund Balances -<br />
Fund Balance, Beginning of Year 3,000<br />
(3,000)<br />
3,000<br />
(3,000)<br />
Fund Balance, End of Year $ 3,000 $ - $ - $<br />
-<br />
129<br />
3,000<br />
-<br />
-
City of <strong>Moreno</strong> <strong>Valley</strong><br />
Budgetary Comparison Schedule<br />
ASES Program Grants<br />
Year Ended June 30, 2011<br />
Budget Amounts Actual<br />
Variance with<br />
Final Budget<br />
Positive<br />
Original Final Amounts (Negative)<br />
Revenues:<br />
Intergovernmental $ 5,863,600 $ 6,178,600 $ 5,951,162 $ (227,438)<br />
Use of money and property 25,000 25,000<br />
5,638 (19,362)<br />
Miscellaneous 3,000<br />
3,000<br />
4,767<br />
1,767<br />
Total Revenues 5,891,600 6,206,600 5,961,567 (245,033)<br />
Expenditures:<br />
Current:<br />
Community and cultural 5,811,898<br />
Total Expenditures 5,811,898<br />
Net Change in Fund Balances 79,702<br />
Fund Balance, Beginning of Year 115,293<br />
6,126,898<br />
6,126,898<br />
79,702<br />
115,293<br />
6,072,946<br />
6,072,946<br />
(111,379)<br />
115,293<br />
53,952<br />
53,952<br />
(298,985)<br />
Fund Balance, End of Year $ 194,995 $ 194,995 $ 3,914 $ (298,985)<br />
130<br />
-
City of <strong>Moreno</strong> <strong>Valley</strong><br />
Budgetary Comparison Schedule<br />
CFD #4M<br />
Year Ended June 30, 2011<br />
Budget Amounts Actual<br />
Variance with<br />
Final Budget<br />
Positive<br />
Original Final Amounts (Negative)<br />
Revenues:<br />
Charges for services $ 35,000 $ 35,000 $ 33,904 $ (1,096)<br />
Use of money and property -<br />
-<br />
1,039<br />
1,039<br />
Total Revenues 35,000 35,000 34,943<br />
(57)<br />
Expenditures:<br />
Current:<br />
Public works 35,000<br />
Total Expenditures 35,000<br />
Net Change in Fund Balances -<br />
Fund Balance, Beginning of Year 55,783<br />
35,000<br />
35,000<br />
-<br />
55,783<br />
27,887<br />
27,887<br />
7,056<br />
55,783<br />
7,113<br />
7,113<br />
(7,170)<br />
Fund Balance, End of Year $ 55,783 $ 55,783 $ 62,839 $ (7,170)<br />
131<br />
-
City of <strong>Moreno</strong> <strong>Valley</strong><br />
Budgetary Comparison Schedule<br />
Neighborhood Stabilization Grant<br />
Year Ended June 30, 2011<br />
Budget Amounts Actual<br />
Variance with<br />
Final Budget<br />
Positive<br />
Original Final Amounts (Negative)<br />
Revenues:<br />
Intergovernmental $ - $ - $ 3,322,567 $ 3,322,567<br />
Total Revenues -<br />
- 3,322,567 3,322,567<br />
Expenditures:<br />
Current:<br />
Community development -<br />
Total Expenditures -<br />
Net Change in Fund Balances -<br />
Fund Balance, Beginning of Year (848,212)<br />
6,109,509<br />
6,109,509<br />
(6,109,509)<br />
(848,212)<br />
2,991,605<br />
2,991,605<br />
330,962<br />
(848,212)<br />
3,117,904<br />
3,117,904<br />
204,663<br />
Fund Balance, End of Year $ (848,212) $ (6,957,721) $ (517,250) $ 204,663<br />
132<br />
-
City of <strong>Moreno</strong> <strong>Valley</strong><br />
Budgetary Comparison Schedule<br />
Homelessness Prevention Program<br />
Year Ended June 30, 2011<br />
Budget Amounts Actual<br />
Variance with<br />
Final Budget<br />
Positive<br />
Original Final Amounts (Negative)<br />
Revenues:<br />
Intergovernmental $ 183,218 $ 183,218 $ 217,810 $ 34,592<br />
Total Revenues 183,218 183,218 217,810<br />
34,592<br />
Expenditures:<br />
Current:<br />
Community development 183,218<br />
Total Expenditures 183,218<br />
Net Change in Fund Balances -<br />
Fund Balance, Beginning of Year -<br />
313,010<br />
313,010<br />
(129,792)<br />
-<br />
229,466<br />
229,466<br />
(11,656)<br />
-<br />
83,544<br />
83,544<br />
(48,952)<br />
Fund Balance, End of Year $ - $ (129,792) $ (11,656) $ (48,952)<br />
133<br />
-
City of <strong>Moreno</strong> <strong>Valley</strong><br />
Budgetary Comparison Schedule<br />
CDBG Recovery Act of 2009<br />
Year Ended June 30, 2011<br />
Budget Amounts Actual<br />
Variance with<br />
Final Budget<br />
Positive<br />
Original Final Amounts (Negative)<br />
Revenues:<br />
Intergovernmental $ 137,192 $ 137,192 $ 331,974 $ 194,782<br />
Total Revenues 137,192 137,192 331,974 194,782<br />
Expenditures:<br />
Current:<br />
Community development 137,192<br />
Total Expenditures 137,192<br />
Excess (Deficiency) of Revenues<br />
Over (Under) Expenditures -<br />
Other Financing Sources (Uses):<br />
Transfers out -<br />
Total Other Financing Sources (Uses) -<br />
Net Change in Fund Balances -<br />
Fund Balance, Beginning of Year -<br />
467,777<br />
467,777<br />
(330,585)<br />
-<br />
-<br />
(330,585)<br />
-<br />
224,133<br />
224,133<br />
107,841<br />
(107,841)<br />
(107,841)<br />
-<br />
-<br />
243,644<br />
243,644<br />
(48,862)<br />
107,841<br />
107,841<br />
58,979<br />
Fund Balance, End of Year $ - $ (330,585) $ - $ 58,979<br />
134<br />
-
City of <strong>Moreno</strong> <strong>Valley</strong><br />
Budgetary Comparison Schedule<br />
Prop 1B<br />
Year Ended June 30, 2011<br />
Budget Amounts Actual<br />
Variance with<br />
Final Budget<br />
Positive<br />
Original Final Amounts (Negative)<br />
Revenues:<br />
Miscellaneous $ - $ - $ 598 $ 598<br />
Total Revenues -<br />
-<br />
598<br />
598<br />
Expenditures:<br />
Current:<br />
Public works 2,682,869<br />
Total Expenditures 2,682,869<br />
Net Change in Fund Balances (2,682,869)<br />
Budgetary Fund Balance, Beginning of Year 4,213,093<br />
4,212,725<br />
4,212,725<br />
(4,212,725)<br />
4,213,093<br />
3,835,596<br />
3,835,596<br />
(3,834,998)<br />
4,213,093<br />
377,129<br />
377,129<br />
377,727<br />
Budgetary Fund Balance, End of Year $ 1,530,224 $ 368 $ 378,095 $ 377,727<br />
135<br />
-
City of <strong>Moreno</strong> <strong>Valley</strong><br />
Budgetary Comparison Schedule<br />
FHWA TRANSIMS<br />
Year Ended June 30, 2011<br />
Budget Amounts Actual<br />
Variance with<br />
Final Budget<br />
Positive<br />
Original Final Amounts (Negative)<br />
Revenues:<br />
Intergovernmental $ 186,600 $ 186,600 $ 78,522 $ (108,078)<br />
Total Revenues 186,600 186,600 78,522 (108,078)<br />
Expenditures:<br />
Current:<br />
Public works 30,000<br />
Total Expenditures 30,000<br />
Excess (Deficiency) of Revenues<br />
Over (Under) Expenditures 156,600<br />
Other Financing Sources (Uses):<br />
Transfers out -<br />
Total Other Financing Sources (Uses) -<br />
Net Change in Fund Balances 156,600<br />
Budgetary Fund Balance, Beginning of Year (24,333)<br />
38,717<br />
38,717<br />
147,883<br />
-<br />
-<br />
147,883<br />
(24,333)<br />
53,047<br />
53,047<br />
25,475<br />
(1,142)<br />
(1,142)<br />
24,333<br />
(24,333)<br />
(14,330)<br />
(14,330)<br />
(122,408)<br />
(1,142)<br />
(1,142)<br />
(123,550)<br />
Budgetary Fund Balance, End of Year $ 132,267 $ 123,550 $ - $ (123,550)<br />
136<br />
-
City of <strong>Moreno</strong> <strong>Valley</strong><br />
Budgetary Comparison Schedule<br />
TR16-06-1 Targeted Rubberized<br />
Year Ended June 30, 2011<br />
Budget Amounts Actual<br />
Variance with<br />
Final Budget<br />
Positive<br />
Original Final Amounts (Negative)<br />
Revenues:<br />
Intergovernmental $ 56,000 $ 56,000 $ 120,000 $ 64,000<br />
Total Revenues 56,000 56,000 120,000<br />
64,000<br />
Expenditures:<br />
Current:<br />
Community development 56,000<br />
Total Expenditures 56,000<br />
Net Change in Fund Balances -<br />
Budgetary Fund Balance, Beginning of Year (26,474)<br />
56,000<br />
56,000<br />
-<br />
(26,474)<br />
-<br />
-<br />
120,000<br />
(26,474)<br />
56,000<br />
56,000<br />
120,000<br />
Budgetary Fund Balance, End of Year $ (26,474) $ (26,474) $ 93,526 $ 120,000<br />
137<br />
-
City of <strong>Moreno</strong> <strong>Valley</strong><br />
Budgetary Comparison Schedule<br />
Civil Penalties<br />
Year Ended June 30, 2011<br />
Budget Amounts Actual<br />
Variance with<br />
Final Budget<br />
Positive<br />
Original Final Amounts (Negative)<br />
Revenues:<br />
Use of money and property $ - $ - $ 7,899 $ 7,899<br />
Miscellaneous - 17,600 59,786<br />
42,186<br />
Total Revenues - 17,600 67,685<br />
50,085<br />
Expenditures:<br />
Current:<br />
Community development -<br />
Total Expenditures -<br />
Net Change in Fund Balances -<br />
Budgetary Fund Balance, Beginning of Year 284,414<br />
17,600<br />
17,600<br />
-<br />
284,414<br />
19,905<br />
19,905<br />
47,780<br />
284,414<br />
(2,305)<br />
(2,305)<br />
52,390<br />
47,780<br />
-<br />
Budgetary Fund Balance, End of Year $ 284,414 $ 284,414 $ 332,194 $ 100,170<br />
138
City of <strong>Moreno</strong> <strong>Valley</strong><br />
Budgetary Comparison Schedule<br />
Emergency Services Agency Fines<br />
Year Ended June 30, 2011<br />
Budget Amounts Actual<br />
Variance with<br />
Final Budget<br />
Positive<br />
Original Final Amounts (Negative)<br />
Revenues:<br />
Intergovernmental $ 14,000 $ 14,000 $ 51,536 $ 37,536<br />
Use of money and property -<br />
-<br />
4,953<br />
4,953<br />
Total Revenues 14,000 14,000 56,489<br />
42,489<br />
Net Change in Fund Balances 14,000<br />
Budgetary Fund Balance, Beginning of Year 198,386<br />
14,000<br />
198,386<br />
56,489<br />
198,386<br />
42,489<br />
Budgetary Fund Balance, End of Year $ 212,386 $ 212,386 $ 254,875 $ 42,489<br />
139<br />
-
City of <strong>Moreno</strong> <strong>Valley</strong><br />
Budgetary Comparison Schedule<br />
Disaster<br />
Year Ended June 30, 2011<br />
Budget Amounts Actual<br />
Variance with<br />
Final Budget<br />
Positive<br />
Original Final Amounts (Negative)<br />
Revenues:<br />
Intergovernmental $ - $ - $ 61,586 $ 61,586<br />
Use of money and property -<br />
- 10,669<br />
10,669<br />
Total Revenues -<br />
- 72,255<br />
72,255<br />
Expenditures:<br />
Current:<br />
Public safety -<br />
Total Expenditures -<br />
Net Change in Fund Balances -<br />
Budgetary Fund Balance, Beginning of Year 340,453<br />
-<br />
-<br />
-<br />
340,453<br />
55,796<br />
55,796<br />
16,459<br />
340,453<br />
(55,796)<br />
(55,796)<br />
16,459<br />
Budgetary Fund Balance, End of Year $ 340,453 $ 340,453 $ 356,912 $ 16,459<br />
140<br />
-
Revenues:<br />
Taxes:<br />
City of <strong>Moreno</strong> <strong>Valley</strong><br />
Budgetary Comparison Schedule<br />
Community Redevelopment Agency Capital Projects<br />
Year Ended June 30, 2011<br />
Variance with<br />
Final Budget<br />
Budget Amounts Actual Positive<br />
Original Final Amounts (Negative)<br />
Property taxes $ - $ - $ 3,522,959 $ 3,522,959<br />
Use of money and property 1,218,500 1,218,500<br />
838,385<br />
(380,115)<br />
Miscellaneous -<br />
-<br />
159,106<br />
159,106<br />
Total Revenues 1,218,500 1,218,500 4,520,450 3,301,950<br />
Expenditures<br />
Current:<br />
General government 2,350,946<br />
Community development -<br />
Capital outlay 35,856,924<br />
Total Expenditures 38,207,870<br />
Excess (Deficiency) of Revenues<br />
Over (Under) Expenditures (36,989,370)<br />
Other Financing Sources (Uses):<br />
Transfers in 5,005,720<br />
Total Other Financing Sources (Uses) 5,005,720<br />
Net Change in Fund Balances (31,983,650)<br />
Fund Balance, Beginning of Year 71,307,582<br />
2,358,446<br />
-<br />
47,410,904<br />
49,769,350<br />
(48,550,850)<br />
5,005,720<br />
5,005,720<br />
(43,545,130)<br />
71,307,582<br />
1,244,090<br />
8,119,944<br />
-<br />
9,364,034<br />
(4,843,584)<br />
595,863<br />
595,863<br />
(4,247,721)<br />
71,307,582<br />
1,114,356<br />
(8,119,944)<br />
47,410,904<br />
40,405,316<br />
43,707,266<br />
(4,409,857)<br />
(4,409,857)<br />
39,297,409<br />
Fund Balance, End of Year $ 39,323,932 $ 27,762,452 $ 67,059,861 $ 39,297,409<br />
141<br />
-
City of <strong>Moreno</strong> <strong>Valley</strong><br />
Budgetary Comparison Schedule<br />
City Hall Capital / Administration<br />
Year Ended June 30, 2011<br />
Budget Amounts Actual<br />
Variance with<br />
Final Budget<br />
Positive<br />
Original Final Amounts (Negative)<br />
Revenues:<br />
Miscellaneous $ - $ - $ 620 $ 620<br />
Total Revenues -<br />
-<br />
620<br />
620<br />
Expenditures<br />
Capital outlay 4,376,901<br />
Total Expenditures 4,376,901<br />
Net Change in Fund Balances (4,376,901)<br />
Fund Balance, Beginning of Year 10,521,601<br />
6,382,197<br />
6,382,197<br />
(6,382,197)<br />
10,521,601<br />
937,649<br />
937,649<br />
(937,029)<br />
10,521,601<br />
5,444,548<br />
5,444,548<br />
5,445,168<br />
Fund Balance, End of Year $ 6,144,700 $ 4,139,404 $ 9,584,572 $ 5,445,168<br />
142<br />
-
City of <strong>Moreno</strong> <strong>Valley</strong><br />
Budgetary Comparison Schedule<br />
Public Works Capital Projects<br />
Year Ended June 30, 2011<br />
Budget Amounts Actual<br />
Variance with<br />
Final Budget<br />
Positive<br />
Original Final Amounts (Negative)<br />
Revenues:<br />
Charges for services $ 30,000 $ 705,657 $ 321,205 $ (384,452)<br />
Use of money and property 900<br />
900<br />
-<br />
(900)<br />
Total Revenues 30,900 706,557 321,205 (385,352)<br />
Expenditures<br />
Current:<br />
Public works -<br />
Capital outlay 30,000<br />
Total Expenditures 30,000<br />
Net Change in Fund Balances 900<br />
Fund Balance, Beginning of Year 71,859<br />
-<br />
705,657<br />
705,657<br />
900<br />
71,859<br />
13,216<br />
307,271<br />
320,487<br />
718<br />
71,859<br />
(13,216)<br />
398,386<br />
385,170<br />
Fund Balance, End of Year $ 72,759 $ 72,759 $ 72,577 $ (182)<br />
143<br />
(182)<br />
-
Expenditures<br />
Current:<br />
City of <strong>Moreno</strong> <strong>Valley</strong><br />
Budgetary Comparison Schedule<br />
Fire Services Capital Projects<br />
Year Ended June 30, 2011<br />
Variance with<br />
Final Budget<br />
Budget Amounts Actual Positive<br />
Original Final Amounts (Negative)<br />
Public safety $ - $ - $ 11,212 $ (11,212)<br />
Capital outlay 1,910,000 1,910,000 42,329 1,867,671<br />
Total Expenditures 1,910,000 1,910,000 53,541 1,856,459<br />
Net Change in Fund Balances (1,910,000)<br />
Fund Balance, Beginning of Year 1,903,373<br />
(1,910,000)<br />
1,903,373<br />
(53,541)<br />
1,903,373<br />
1,856,459<br />
Fund Balance, End of Year $ (6,627) $ (6,627) $ 1,849,832 $ 1,856,459<br />
144<br />
-
Expenditures<br />
Current:<br />
City of <strong>Moreno</strong> <strong>Valley</strong><br />
Budgetary Comparison Schedule<br />
Towngate Capital / Administration<br />
Year Ended June 30, 2011<br />
Variance with<br />
Final Budget<br />
Budget Amounts Actual Positive<br />
Original Final Amounts (Negative)<br />
Public works $ 183,800 $ 183,800 $ 188,508 $ (4,708)<br />
Total Expenditures 183,800 183,800 188,508<br />
(4,708)<br />
Excess (Deficiency) of Revenues<br />
Over (Under) Expenditures (183,800)<br />
Other Financing Sources (Uses):<br />
Transfers in 183,900<br />
Total Other Financing Sources (Uses) 183,900<br />
Net Change in Fund Balances 100<br />
Fund Balance, Beginning of Year 6,349<br />
(183,800)<br />
183,900<br />
183,900<br />
100<br />
6,349<br />
(188,508)<br />
190,260<br />
190,260<br />
1,752<br />
6,349<br />
(4,708)<br />
6,360<br />
6,360<br />
Fund Balance, End of Year $ 6,449 $ 6,449 $ 8,101 $ 1,652<br />
145<br />
1,652<br />
-
Revenues:<br />
Taxes:<br />
City of <strong>Moreno</strong> <strong>Valley</strong><br />
Budgetary Comparison Schedule<br />
Warner Ranch Capital / Development<br />
Year Ended June 30, 2011<br />
Variance with<br />
Final Budget<br />
Budget Amounts Actual Positive<br />
Original Final Amounts (Negative)<br />
Property taxes $ 8,400 $ 8,400 $ 8,325 $ (75)<br />
Total Revenues 8,400<br />
8,400<br />
8,325<br />
(75)<br />
Expenditures<br />
Current:<br />
Public works 7,100<br />
Total Expenditures 7,100<br />
Net Change in Fund Balances 1,300<br />
Fund Balance, Beginning of Year 8,118<br />
7,100<br />
7,100<br />
1,300<br />
8,118<br />
2,770<br />
2,770<br />
5,555<br />
8,118<br />
4,330<br />
4,330<br />
Fund Balance, End of Year $ 9,418 $ 9,418 $ 13,673 $ 4,255<br />
146<br />
4,255<br />
-
Expenditures<br />
Current:<br />
City of <strong>Moreno</strong> <strong>Valley</strong><br />
Budgetary Comparison Schedule<br />
Auto Mall Capital / Administration<br />
Year Ended June 30, 2011<br />
Variance with<br />
Final Budget<br />
Budget Amounts Actual Positive<br />
Original Final Amounts (Negative)<br />
Public works $ 61,900 $ 61,900 $ 138,508 $ (76,608)<br />
Total Expenditures 61,900 61,900 138,508 (76,608)<br />
Excess (Deficiency) of Revenues<br />
Over (Under) Expenditures (61,900)<br />
Other Financing Sources (Uses):<br />
Transfers in 62,500<br />
Total Other Financing Sources (Uses) 62,500<br />
Net Change in Fund Balances 600<br />
Fund Balance, Beginning of Year (2,256)<br />
(61,900)<br />
62,500<br />
62,500<br />
600<br />
(2,256)<br />
(138,508)<br />
137,400<br />
137,400<br />
(1,108)<br />
(2,256)<br />
(76,608)<br />
74,900<br />
74,900<br />
(1,708)<br />
Fund Balance, End of Year $ (1,656) $ (1,656) $ (3,364) $ (1,708)<br />
147<br />
-
Expenditures<br />
Current:<br />
City of <strong>Moreno</strong> <strong>Valley</strong><br />
Budgetary Comparison Schedule<br />
Parks and Community Services Capital Projects<br />
Year Ended June 30, 2011<br />
Variance with<br />
Final Budget<br />
Budget Amounts Actual Positive<br />
Original Final Amounts (Negative)<br />
Community and cultural $ - $ - $ 23,393 $ (23,393)<br />
Public works -<br />
-<br />
1,936<br />
(1,936)<br />
Capital outlay 4,092,761 4,088,272 1,109,005 2,979,267<br />
Total Expenditures 4,092,761 4,088,272 1,134,334 2,953,938<br />
Net Change in Fund Balances (4,092,761)<br />
Fund Balance, Beginning of Year 6,451,815<br />
(4,088,272)<br />
6,451,815<br />
(1,134,334)<br />
6,451,815<br />
2,953,938<br />
Fund Balance, End of Year $ 2,359,054 $ 2,363,543 $ 5,317,481 $ 2,953,938<br />
148<br />
-
City of <strong>Moreno</strong> <strong>Valley</strong><br />
Budgetary Comparison Schedule<br />
TUMF Capital Projects<br />
Year Ended June 30, 2011<br />
Budget Amounts Actual<br />
Variance with<br />
Final Budget<br />
Positive<br />
Original Final Amounts (Negative)<br />
Revenues:<br />
Intergovernmental $ 6,000,000 $ 6,000,000 $ 2,572,753 $ (3,427,247)<br />
Miscellaneous -<br />
-<br />
2,586<br />
2,586<br />
Total Revenues 6,000,000 6,000,000 2,575,339 (3,424,661)<br />
Expenditures<br />
Current:<br />
Public works -<br />
Capital outlay 6,245,920<br />
Total Expenditures 6,245,920<br />
Net Change in Fund Balances (245,920)<br />
Fund Balance, Beginning of Year (640,714)<br />
-<br />
8,265,607<br />
8,265,607<br />
(2,265,607)<br />
(640,714)<br />
1,007<br />
2,144,452<br />
2,145,459<br />
429,880<br />
(640,714)<br />
(1,007)<br />
6,121,155<br />
6,120,148<br />
2,695,487<br />
Fund Balance, End of Year $ (886,634) $ (2,906,321) $ (210,834) $ 2,695,487<br />
149<br />
-
City of <strong>Moreno</strong> <strong>Valley</strong><br />
Budgetary Comparison Schedule<br />
DIF Capital Projects<br />
Year Ended June 30, 2011<br />
Budget Amounts Actual<br />
Variance with<br />
Final Budget<br />
Positive<br />
Original Final Amounts (Negative)<br />
Revenues:<br />
Intergovernmental $ - $ - $ 18,900 $ 18,900<br />
Miscellaneous 2,000<br />
2,000<br />
3,992<br />
1,992<br />
Total Revenues 2,000<br />
2,000 22,892<br />
20,892<br />
Expenditures<br />
Current:<br />
Public works -<br />
Capital outlay 5,531,954<br />
Total Expenditures 5,531,954<br />
Excess (Deficiency) of Revenues<br />
Over (Under) Expenditures (5,529,954)<br />
Other Financing Sources (Uses):<br />
Transfers in 2,035,000<br />
Total Other Financing Sources (Uses) 2,035,000<br />
Net Change in Fund Balances (3,494,954)<br />
Fund Balance, Beginning of Year 4,157,699<br />
-<br />
6,190,581<br />
6,190,581<br />
(6,188,581)<br />
2,035,000<br />
2,035,000<br />
(4,153,581)<br />
4,157,699<br />
141,978<br />
1,719,354<br />
1,861,332<br />
(1,838,440)<br />
2,035,000<br />
2,035,000<br />
196,560<br />
4,157,699<br />
(141,978)<br />
4,471,227<br />
4,329,249<br />
4,350,141<br />
-<br />
-<br />
4,350,141<br />
Fund Balance, End of Year $ 662,745 $ 4,118 $ 4,354,259 $ 4,350,141<br />
150<br />
-
City of <strong>Moreno</strong> <strong>Valley</strong><br />
Budgetary Comparison Schedule<br />
Lease Revenue Bonds 2005 Capital Projects<br />
Year Ended June 30, 2011<br />
Budget Amounts Actual<br />
Variance with<br />
Final Budget<br />
Positive<br />
Original Final Amounts (Negative)<br />
Revenues:<br />
Use of money and property $ 100,000 $ 100,000 $ 833 $ (99,167)<br />
Total Revenues 100,000 100,000<br />
833 (99,167)<br />
Expenditures<br />
Capital outlay 1,962,894<br />
Total Expenditures 1,962,894<br />
Excess (Deficiency) of Revenues<br />
Over (Under) Expenditures (1,862,894)<br />
Other Financing Sources (Uses):<br />
Transfers out -<br />
Total Other Financing Sources (Uses) -<br />
Net Change in Fund Balances (1,862,894)<br />
Fund Balance, Beginning of Year 5,044,036<br />
4,379,875<br />
4,379,875<br />
(4,279,875)<br />
-<br />
-<br />
(4,279,875)<br />
5,044,036<br />
3,076,335<br />
3,076,335<br />
(3,075,502)<br />
(771)<br />
(771)<br />
(3,076,273)<br />
5,044,036<br />
1,303,540<br />
1,303,540<br />
1,204,373<br />
771<br />
771<br />
1,205,144<br />
Fund Balance, End of Year $ 3,181,142 $ 764,161 $ 1,967,763 $ 1,205,144<br />
151<br />
-
Revenues:<br />
Taxes:<br />
City of <strong>Moreno</strong> <strong>Valley</strong><br />
Budgetary Comparison Schedule<br />
Community Redevelopment Agency Debt Service<br />
Year Ended June 30, 2011<br />
Variance with<br />
Final Budget<br />
Budget Amounts Actual Positive<br />
Original Final Amounts (Negative)<br />
Property taxes $ 10,857,656 $ 10,857,656 $ 6,500,538 $ (4,357,118)<br />
Sales taxes 780,000<br />
780,000<br />
994,015<br />
214,015<br />
Intergovernmental -<br />
- 1,090,264 1,090,264<br />
Use of money and property 801,100<br />
801,100<br />
511,926<br />
(289,174)<br />
Miscellaneous -<br />
- 2,686,000 2,686,000<br />
Total Revenues 12,438,756 12,438,756 11,782,743<br />
(656,013)<br />
Expenditures:<br />
Current:<br />
General government 3,371,631<br />
Debt service:<br />
Principal retirement 130,000<br />
Interest and fiscal charges 3,660,590<br />
Total Expenditures 7,162,221<br />
Excess (Deficiency) of Revenues<br />
Over (Under) Expenditures 5,276,535<br />
Other Financing Sources (Uses):<br />
Transfers in 2,590,300<br />
Transfers out (9,998,718)<br />
Total Other Financing Sources (Uses) (7,408,418)<br />
Net Change in Fund Balances (2,131,883)<br />
Fund Balances, Beginning of Year (33,335,207)<br />
3,371,631<br />
130,000<br />
3,660,590<br />
7,162,221<br />
5,276,535<br />
2,590,300<br />
(9,998,718)<br />
(7,408,418)<br />
(2,131,883)<br />
(33,335,207)<br />
3,163,638<br />
417,581<br />
4,988,816<br />
8,570,035<br />
3,212,708<br />
-<br />
(2,881,220)<br />
(2,881,220)<br />
331,488<br />
(33,335,207)<br />
207,993<br />
(287,581)<br />
(1,328,226)<br />
(1,407,814)<br />
(2,063,827)<br />
(2,590,300)<br />
7,117,498<br />
4,527,198<br />
2,463,371<br />
Fund Balances, End of Year $ (35,467,090) $ (35,467,090) $ (33,003,719) $ 2,463,371<br />
152<br />
-
City of <strong>Moreno</strong> <strong>Valley</strong><br />
Budgetary Comparison Schedule<br />
OPA Sales Tax Agreements<br />
Year Ended June 30, 2011<br />
Budget Amounts Actual<br />
Variance with<br />
Final Budget<br />
Positive<br />
Original Final Amounts (Negative)<br />
Revenues:<br />
Use of money and property $ 350,000 $ 350,000 $ 449,473 $ 99,473<br />
Total Revenues 350,000 350,000 449,473<br />
99,473<br />
Expenditures:<br />
Debt service:<br />
Interest and fiscal charges 350,000<br />
Total Expenditures 350,000<br />
Net Change in Fund Balances -<br />
Fund Balances, Beginning of Year -<br />
350,000<br />
350,000<br />
-<br />
-<br />
449,473<br />
449,473<br />
-<br />
-<br />
(99,473)<br />
(99,473)<br />
Fund Balances, End of Year $ - $ - $ - $<br />
-<br />
153<br />
-<br />
-
Expenditures:<br />
Debt service:<br />
City of <strong>Moreno</strong> <strong>Valley</strong><br />
Budgetary Comparison Schedule<br />
City Hall COPs Series 1997<br />
Year Ended June 30, 2011<br />
Variance with<br />
Final Budget<br />
Budget Amounts Actual Positive<br />
Original Final Amounts (Negative)<br />
Principal retirement $ 615,000 $ 615,000 $ 4,875,000 $ (4,260,000)<br />
Interest and fiscal charges 207,025 207,025 85,585 121,440<br />
Total Expenditures 822,025 822,025 4,960,585 (4,138,560)<br />
Excess (Deficiency) of Revenues<br />
Over (Under) Expenditures (822,025)<br />
Other Financing Sources (Uses):<br />
Transfers in 822,025<br />
Transfers out -<br />
Total Other Financing Sources (Uses) 822,025<br />
Net Change in Fund Balances -<br />
Fund Balances, Beginning of Year 939,065<br />
(822,025)<br />
822,025<br />
-<br />
822,025<br />
-<br />
939,065<br />
(4,960,585)<br />
5,082,025<br />
(1,060,505)<br />
4,021,520<br />
(939,065)<br />
939,065<br />
(4,138,560)<br />
4,260,000<br />
(1,060,505)<br />
3,199,495<br />
(939,065)<br />
Fund Balances, End of Year $ 939,065 $ 939,065 $ - $ (939,065)<br />
154<br />
-
Revenues:<br />
Taxes:<br />
City of <strong>Moreno</strong> <strong>Valley</strong><br />
Budgetary Comparison Schedule<br />
Auto Mall Special Tax Bonds<br />
Year Ended June 30, 2011<br />
Variance with<br />
Final Budget<br />
Budget Amounts Actual Positive<br />
Original Final Amounts (Negative)<br />
Other taxes $ 1,967,600 $ 1,967,600 $ 78,021 $ (1,889,579)<br />
Use of money and property 500<br />
500<br />
155<br />
(345)<br />
Total Revenues 1,968,100 1,968,100 78,176 (1,889,924)<br />
Expenditures:<br />
Debt service:<br />
Principal retirement 1,045,000<br />
Interest and fiscal charges 1,309,300<br />
Total Expenditures 2,354,300<br />
Excess (Deficiency) of Revenues<br />
Over (Under) Expenditures (386,200)<br />
Other Financing Sources (Uses):<br />
Transfers in 220,000<br />
Transfers out (62,500)<br />
Total Other Financing Sources (Uses) 157,500<br />
Net Change in Fund Balances (228,700)<br />
Fund Balances, Beginning of Year 2,367,173<br />
1,045,000<br />
1,309,300<br />
2,354,300<br />
(386,200)<br />
220,000<br />
(62,500)<br />
157,500<br />
(228,700)<br />
2,367,173<br />
1,045,000<br />
241,750<br />
1,286,750<br />
(1,208,574)<br />
96,489<br />
(137,400)<br />
(40,911)<br />
(1,249,485)<br />
2,367,173<br />
-<br />
1,067,550<br />
1,067,550<br />
(822,374)<br />
(123,511)<br />
(74,900)<br />
(198,411)<br />
(1,020,785)<br />
Fund Balances, End of Year $ 2,138,473 $ 2,138,473 $ 1,117,688 $ (1,020,785)<br />
155<br />
-
City of <strong>Moreno</strong> <strong>Valley</strong><br />
Budgetary Comparison Schedule<br />
Public Safety Lease Revenue Bonds 1997<br />
Year Ended June 30, 2011<br />
Budget Amounts Actual<br />
Variance with<br />
Final Budget<br />
Positive<br />
Original Final Amounts (Negative)<br />
Revenues:<br />
Use of money and property $ - $ - $ 22,796 $ 22,796<br />
Total Revenues -<br />
- 22,796<br />
22,796<br />
Expenditures:<br />
Debt service:<br />
Principal retirement 205,000<br />
Interest and fiscal charges 199,200<br />
Total Expenditures 404,200<br />
Excess (Deficiency) of Revenues<br />
Over (Under) Expenditures (404,200)<br />
Other Financing Sources (Uses):<br />
Transfers in 404,200<br />
Transfers out -<br />
Total Other Financing Sources (Uses) 404,200<br />
Net Change in Fund Balances -<br />
Fund Balances, Beginning of Year 763,764<br />
205,000<br />
199,200<br />
404,200<br />
(404,200)<br />
404,200<br />
-<br />
404,200<br />
-<br />
763,764<br />
3,705,000<br />
202,216<br />
3,907,216<br />
(3,884,420)<br />
3,559,407<br />
(438,751)<br />
3,120,656<br />
(763,764)<br />
763,764<br />
(3,500,000)<br />
(3,016)<br />
(3,503,016)<br />
(3,480,220)<br />
3,155,207<br />
(438,751)<br />
2,716,456<br />
(763,764)<br />
Fund Balances, End of Year $ 763,764 $ 763,764 $ - $ (763,764)<br />
156<br />
-
City of <strong>Moreno</strong> <strong>Valley</strong><br />
Budgetary Comparison Schedule<br />
Lease Revenue Bonds 2005 Debt Service<br />
Year Ended June 30, 2011<br />
Budget Amounts Actual<br />
Variance with<br />
Final Budget<br />
Positive<br />
Original Final Amounts (Negative)<br />
Revenues:<br />
Use of money and property $ - $ - $ 244 $ 244<br />
Total Revenues -<br />
-<br />
244<br />
244<br />
Expenditures:<br />
Debt service:<br />
Principal retirement 840,000<br />
Interest and fiscal charges 1,804,491<br />
Total Expenditures 2,644,491<br />
Excess (Deficiency) of Revenues<br />
Over (Under) Expenditures (2,644,491)<br />
Other Financing Sources (Uses):<br />
Transfers in 2,644,491<br />
Total Other Financing Sources (Uses) 2,644,491<br />
Net Change in Fund Balances -<br />
Fund Balances, Beginning of Year 8,788,144<br />
840,000<br />
1,804,491<br />
2,644,491<br />
(2,644,491)<br />
2,644,491<br />
2,644,491<br />
-<br />
8,788,144<br />
840,000<br />
1,801,743<br />
2,641,743<br />
(2,641,499)<br />
2,644,136<br />
2,644,136<br />
2,637<br />
8,788,144<br />
-<br />
2,748<br />
2,748<br />
Fund Balances, End of Year $ 8,788,144 $ 8,788,144 $ 8,790,781 $ 2,637<br />
157<br />
2,992<br />
(355)<br />
(355)<br />
2,637<br />
-
Revenues:<br />
Taxes:<br />
City of <strong>Moreno</strong> <strong>Valley</strong><br />
Budgetary Comparison Schedule<br />
2007 Towngate Improvement Refunding<br />
Year Ended June 30, 2011<br />
Variance with<br />
Final Budget<br />
Budget Amounts Actual Positive<br />
Original Final Amounts (Negative)<br />
Other taxes $ 114,400 $ 114,400 $ 112,162 $ (2,238)<br />
Use of money and property 100<br />
100<br />
64<br />
(36)<br />
Total Revenues 114,500 114,500 112,226<br />
(2,274)<br />
Expenditures:<br />
Debt service:<br />
Principal retirement 195,000<br />
Interest and fiscal charges 160,300<br />
Total Expenditures 355,300<br />
Excess (Deficiency) of Revenues<br />
Over (Under) Expenditures (240,800)<br />
Other Financing Sources (Uses):<br />
Transfers in 279,500<br />
Transfers out (38,250)<br />
Total Other Financing Sources (Uses) 241,250<br />
Net Change in Fund Balances 450<br />
Fund Balances, Beginning of Year 820,975<br />
195,000<br />
160,300<br />
355,300<br />
(240,800)<br />
279,500<br />
(38,250)<br />
241,250<br />
450<br />
820,975<br />
195,000<br />
160,375<br />
355,375<br />
(243,149)<br />
276,459<br />
(47,480)<br />
228,979<br />
(14,170)<br />
820,975<br />
-<br />
(75)<br />
(75)<br />
(2,349)<br />
(3,041)<br />
(9,230)<br />
(12,271)<br />
(14,620)<br />
Fund Balances, End of Year $ 821,425 $ 821,425 $ 806,805 $ (14,620)<br />
158<br />
-
City of <strong>Moreno</strong> <strong>Valley</strong><br />
Budgetary Comparison Schedule<br />
2007 Towngate Refunding<br />
Year Ended June 30, 2011<br />
Budget Amounts Actual<br />
Variance with<br />
Final Budget<br />
Positive<br />
Original Final Amounts (Negative)<br />
Revenues:<br />
Use of money and property $ 500 $ 500 $ 231 $ (269)<br />
Total Revenues 500<br />
500<br />
231<br />
(269)<br />
Expenditures:<br />
Debt service:<br />
Principal retirement 630,000<br />
Interest and fiscal charges 382,500<br />
Total Expenditures 1,012,500<br />
Excess (Deficiency) of Revenues<br />
Over (Under) Expenditures (1,012,000)<br />
Other Financing Sources (Uses):<br />
Transfers in 1,158,200<br />
Transfers out (145,650)<br />
Total Other Financing Sources (Uses) 1,012,550<br />
Net Change in Fund Balances 550<br />
Fund Balances, Beginning of Year 2,138,951<br />
630,000<br />
382,500<br />
1,012,500<br />
(1,012,000)<br />
1,158,200<br />
(145,650)<br />
1,012,550<br />
550<br />
2,138,951<br />
630,000<br />
382,569<br />
1,012,569<br />
(1,012,338)<br />
1,168,536<br />
(142,780)<br />
1,025,756<br />
13,418<br />
2,138,951<br />
-<br />
(69)<br />
(69)<br />
(338)<br />
10,336<br />
2,870<br />
13,206<br />
12,868<br />
Fund Balances, End of Year $ 2,139,501 $ 2,139,501 $ 2,152,369 $ 12,868<br />
159<br />
-
City of <strong>Moreno</strong> <strong>Valley</strong><br />
Budgetary Comparison Schedule<br />
Celebration Park Endowment<br />
Year Ended June 30, 2011<br />
Budget Amounts Actual<br />
Variance with<br />
Final Budget<br />
Positive<br />
Original Final Amounts (Negative)<br />
Revenues:<br />
Use of money and property $ 1,000 $ 1,000 $ 990 $ (10)<br />
Total Revenues 1,000<br />
1,000<br />
990<br />
(10)<br />
Net Change in Fund Balances 1,000<br />
Fund Balance, Beginning of Year 57,304<br />
1,000<br />
57,304<br />
990<br />
57,304<br />
Fund Balance, End of Year $ 58,304 $ 58,304 $ 58,294 $ (10)<br />
160<br />
(10)<br />
-
Internal Service<br />
Funds
General Liability Insurance Fund<br />
INTERNAL SERVICE FUNDS<br />
This fund is used to account for the costs of maintaining the City’s general liability insurance<br />
program, on a reimbursement basis through charges to benefiting funds; and maintaining<br />
responsible reserves based on current actuarial assumptions.<br />
Workers’ Compensation Insurance Fund<br />
This fund is used to account for the costs of maintaining the City worker’s compensation<br />
insurance program, on a reimbursement basis through charges to benefiting funds; and<br />
maintaining responsible reserves based on current actuarial assumptions.<br />
Technology Services Fund<br />
This fund is used to account for the costs of maintaining and replacing the City’s information<br />
systems including major software, hardware, radios, telephones, and the City’s backbone<br />
telecommunications infrastructure. The fund recovers costs through charges to benefiting funds.<br />
Facilities Maintenance Fund<br />
This fund is used to account for the costs of maintaining all City-owned and leased buildings. Its<br />
user charges include the recovery of both depreciation on the City Hall building and debt service<br />
on the 1997 variable rate Certificates of Participation originally issued in 1995 to finance the<br />
acquisition of the building.<br />
Equipment Maintenance Fund<br />
This fund is used to account for the maintenance costs of the City’s inventory of vehicles and<br />
equipment, on a cost reimbursement basis through user charges to benefiting funds.<br />
Equipment Replacement Reserve Fund<br />
This fund is used to account for the accumulation of cash reserves to replace City vehicles and<br />
capital equipment, based on replacement cost and useful life. The reserve receives cash through<br />
user charges for each fund’s share of annual depreciation; and provides cash as a funding source<br />
to participating funds for capital replacement.<br />
161
Assets:<br />
Current:<br />
Pooled cash and investments<br />
Receivables:<br />
$ 2,285,425 $ 3,422,109 $ 8,877,768 $ 5,419,820<br />
Accounts 1,098<br />
39<br />
94<br />
103<br />
Prepaid costs -<br />
-<br />
-<br />
21,506<br />
Inventories -<br />
-<br />
-<br />
-<br />
Total Current Assets 2,286,523<br />
Noncurrent:<br />
Capital assets - net of<br />
accumulated depreciation -<br />
Total Noncurrent Assets -<br />
3,422,148<br />
-<br />
-<br />
8,877,862<br />
691,868<br />
691,868<br />
5,441,429<br />
7,082,244<br />
7,082,244<br />
Total Assets $ 2,286,523 $ 3,422,148 $ 9,569,730 $ 12,523,673<br />
Liabilities and Net Assets:<br />
City of <strong>Moreno</strong> <strong>Valley</strong><br />
Combining Statement of Net Assets<br />
Internal Service Funds<br />
June 30, 2011<br />
General<br />
Liability<br />
Insurance<br />
Liabilities:<br />
Current:<br />
Accounts payable $ 10,353 $ 3,250 $ 37,439 $ 96,889<br />
Accrued liabilities 1,561<br />
520<br />
31,164<br />
12,437<br />
Compensated absences 20,307<br />
-<br />
250,309<br />
43,725<br />
Self-insurance payable 398,000<br />
512,000<br />
-<br />
-<br />
Total Current Liabilities 430,221<br />
Noncurrent:<br />
Compensated absences 13,538<br />
Self-insurance payable 1,046,000<br />
Total Noncurrent Liabilities 1,059,538<br />
Total Liabilities 1,489,759<br />
Net Assets:<br />
Invested in capital assets, net of related debt -<br />
Unrestricted 796,764<br />
Total Net Assets 796,764<br />
Workers'<br />
Compensation<br />
Insurance<br />
515,770<br />
-<br />
1,471,000<br />
1,471,000<br />
1,986,770<br />
-<br />
1,435,378<br />
1,435,378<br />
Technology<br />
Services<br />
318,912<br />
166,873<br />
-<br />
166,873<br />
485,785<br />
691,868<br />
8,392,077<br />
9,083,945<br />
Facilities<br />
Maintenance<br />
153,051<br />
29,150<br />
-<br />
29,150<br />
182,201<br />
7,082,244<br />
5,259,228<br />
12,341,472<br />
Total Liabilities and Net Assets $ 2,286,523 $ 3,422,148 $ 9,569,730 $ 12,523,673<br />
162
Equipment<br />
Equipment<br />
Replacement<br />
Maintenance Reserve<br />
Totals<br />
$ 225,057 $ 15,967,888 $ 36,198,067<br />
Assets:<br />
Current:<br />
Pooled cash and investments<br />
Receivables:<br />
-<br />
-<br />
1,334 Accounts<br />
-<br />
-<br />
21,506 Prepaid costs<br />
8,575<br />
-<br />
8,575 Inventories<br />
233,632<br />
38,091<br />
38,091<br />
15,967,888<br />
389,445<br />
389,445<br />
36,229,482<br />
8,201,648<br />
8,201,648<br />
Total Current Assets<br />
Noncurrent:<br />
Capital assets - net of<br />
accumulated depreciation<br />
Total Noncurrent Assets<br />
$ 271,723 $ 16,357,333 $ 44,431,130 Total Assets<br />
Liabilities and Net Assets:<br />
$ 22,975 $ - $ 170,906<br />
Liabilities:<br />
Current:<br />
Accounts payable<br />
3,633<br />
-<br />
49,315 Accrued liabilities<br />
2,485<br />
-<br />
316,826 Compensated absences<br />
-<br />
- 910,000 Self-insurance payable<br />
29,093<br />
1,657<br />
-<br />
1,657<br />
30,750<br />
38,091<br />
202,882<br />
240,973<br />
-<br />
-<br />
-<br />
-<br />
-<br />
389,445<br />
15,967,888<br />
16,357,333<br />
1,447,047<br />
211,218<br />
2,517,000<br />
2,728,218<br />
4,175,265<br />
8,201,648<br />
32,054,217<br />
40,255,865<br />
Total Current Liabilities<br />
Noncurrent:<br />
Compensated absences<br />
Self-insurance payable<br />
Total Noncurrent Liabilities<br />
Total Liabilities<br />
Net Assets:<br />
Invested in capital assets, net of related debt<br />
Unrestricted<br />
Total Net Assets<br />
$ 271,723 $ 16,357,333 $ 44,431,130 Total Liabilities and Net Assets<br />
163
Total Operating Revenues 948,080<br />
Operating Expenses:<br />
Cost of services 166,045<br />
Depreciation expense -<br />
Self-insurance claims and charges 730,998<br />
Total Operating Expenses 897,043<br />
Operating Income (Loss) 51,037<br />
Nonoperating Revenues (Expenses):<br />
Gain (loss) on disposal of capital assets -<br />
Total Nonoperating<br />
Revenues (Expenses) -<br />
Income (Loss) Before Transfers 51,037<br />
Transfers in -<br />
Transfers out -<br />
Changes in Net Assets 51,037<br />
Net Assets:<br />
City of <strong>Moreno</strong> <strong>Valley</strong><br />
Combining Statement of Revenues, Expenses<br />
and Changes in Fund Net Assets<br />
Internal Service Funds<br />
Year Ended June 30, 2011<br />
General Workers'<br />
Liability Compensation Technology Facilities<br />
Insurance Insurance Services Maintenance<br />
Operating Revenues:<br />
Sales and service charges $ 947,884 $ - $ 4,279,224 $ 2,904,084<br />
Miscellaneous 196<br />
-<br />
1,971<br />
20,066<br />
Beginning of Year 745,727<br />
-<br />
122,031<br />
-<br />
251,298<br />
373,329<br />
(373,329)<br />
-<br />
-<br />
(373,329)<br />
-<br />
(263,000)<br />
(636,329)<br />
2,071,707<br />
4,281,195<br />
3,283,349<br />
261,807<br />
-<br />
3,545,156<br />
736,039<br />
-<br />
-<br />
736,039<br />
-<br />
-<br />
736,039<br />
8,347,906<br />
2,924,150<br />
2,749,474<br />
274,095<br />
-<br />
3,023,569<br />
(99,419)<br />
-<br />
-<br />
(99,419)<br />
1,060,505<br />
(855,025)<br />
106,061<br />
12,235,411<br />
End of Fiscal Year $ 796,764 $ 1,435,378 $ 9,083,945 $ 12,341,472<br />
164
Equipment<br />
Equipment<br />
Replacement<br />
Maintenance Reserve<br />
Totals<br />
$ 493,264 $ 2,304,055 $ 10,928,511<br />
Operating Revenues:<br />
Sales and service charges<br />
-<br />
-<br />
22,233 Miscellaneous<br />
Total Operating Revenues<br />
493,264 2,304,055 10,950,744<br />
626,850<br />
25,761<br />
-<br />
652,611<br />
(159,347)<br />
-<br />
-<br />
(159,347)<br />
114,000<br />
-<br />
(45,347)<br />
286,320<br />
2,973<br />
202,982<br />
-<br />
205,955<br />
2,098,100<br />
605<br />
605<br />
2,098,705<br />
-<br />
(146,300)<br />
1,952,405<br />
14,404,928<br />
6,950,722<br />
764,645<br />
982,296<br />
8,697,663<br />
2,253,081<br />
605<br />
605<br />
2,253,686<br />
1,174,505<br />
(1,264,325)<br />
2,163,866<br />
38,091,999<br />
Operating Expenses:<br />
Cost of services<br />
Depreciation expense<br />
Self-insurance claims and charges<br />
Total Operating Expenses<br />
Operating Income (Loss)<br />
Nonoperating Revenues (Expenses):<br />
Gain (loss) on disposal of capital assets<br />
Total Nonoperating<br />
Revenues (Expenses)<br />
Income (Loss) Before Transfers<br />
Transfers in<br />
Transfers out<br />
Changes in Net Assets<br />
Net Assets:<br />
Beginning of Year<br />
$ 240,973 $ 16,357,333 $ 40,255,865 End of Fiscal Year<br />
165
City of <strong>Moreno</strong> <strong>Valley</strong><br />
Combining Statement of Cash Flows<br />
Internal Service Funds<br />
Year Ended June 30, 2011<br />
General Workers'<br />
Liability Compensation Technology Facilities<br />
Insurance Insurance Services Maintenance<br />
Cash Flows from Operating Activities:<br />
Cash received from customers $ 947,884 $ - $ 4,279,130 $ 2,904,154<br />
Cash paid to suppliers for goods and services (128,081) (65,544) (1,672,212) (2,147,397)<br />
Cash paid for claims (718,998) (456,298)<br />
-<br />
-<br />
Cash paid to employees for services (71,773) (59,700) (1,603,004) (682,295)<br />
Other operating revenues (expenses) 196<br />
(39)<br />
1,971<br />
20,066<br />
Net Cash Provided (Used) by Operating Activities 29,228<br />
Cash Flows from Non-Capital<br />
Financing Activities:<br />
Cash transfers out -<br />
Cash transfers in -<br />
Net Cash Provided (Used) by<br />
Non-Capital Financing Activities -<br />
Cash Flows from Capital<br />
and Related Financing Activities:<br />
Acquisition and construction of capital assets -<br />
Net Cash Provided (Used) by<br />
Capital and Related Financing Activities -<br />
Net Increase (Decrease) in Cash<br />
and Cash Equivalents 29,228<br />
Cash and Cash Equivalents at Beginning of Year 2,256,197<br />
(581,581)<br />
(263,000)<br />
-<br />
(263,000)<br />
-<br />
-<br />
(844,581)<br />
4,266,690<br />
1,005,885<br />
-<br />
-<br />
-<br />
(74,255)<br />
(74,255)<br />
931,630<br />
7,946,138<br />
94,528<br />
(855,025)<br />
1,060,505<br />
205,480<br />
(145,512)<br />
(145,512)<br />
154,496<br />
5,265,324<br />
Cash and Cash Equivalents at End of Year $ 2,285,425 $ 3,422,109 $ 8,877,768 $ 5,419,820<br />
Reconciliation of Operating Income to Net Cash<br />
Provided (Used) by Operating Activities:<br />
Operating income (loss)<br />
Adjustments to reconcile operating income (loss)<br />
net cash provided (used) by operating activities:<br />
$ 51,037 $ (373,329) $ 736,039 $ (99,419)<br />
Depreciation -<br />
- 261,807 274,095<br />
(Increase) decrease in accounts receivable -<br />
(39)<br />
(94)<br />
70<br />
(Increase) decrease in prepaid expense -<br />
-<br />
376 (13,571)<br />
(Increase) decrease in inventories -<br />
-<br />
-<br />
-<br />
Increase (decrease) in accounts payable (46,398)<br />
2,972<br />
26,085<br />
30,043<br />
Increase (decrease) in accrued liabilities (2,940)<br />
(1,471) (65,056) (29,626)<br />
Increase (decrease) in self-insurance payable 12,000 (205,000)<br />
-<br />
-<br />
Increase (decrease) in compensated absences 15,529<br />
(4,714) 46,728 (67,064)<br />
Total Adjustments (21,809)<br />
(208,252)<br />
269,846<br />
193,947<br />
Net Cash Provided (Used) by<br />
Operating Activities $ 29,228 $ (581,581) $ 1,005,885 $ 94,528<br />
Non-Cash Investing, Capital, and Financing Activities:<br />
There were no significant noncash investing, capital and noncapital financing activities for the year ended June 30, 2011.<br />
166
Equipment<br />
Equipment<br />
Replacement<br />
Maintenance Reserve Totals<br />
$ 493,264 $ 2,304,055 $ 10,928,487<br />
Cash Flows from Operating Activities:<br />
Cash received from customers<br />
(483,532) (2,973) (4,499,739) Cash paid to suppliers for goods and services<br />
-<br />
- (1,175,296) Cash paid for claims<br />
(170,467)<br />
- (2,587,239) Cash paid to employees for services<br />
-<br />
-<br />
22,194 Other operating revenues (expenses)<br />
(160,735)<br />
-<br />
114,000<br />
114,000<br />
24<br />
24<br />
(46,711)<br />
271,768<br />
2,301,082<br />
(146,300)<br />
-<br />
(146,300)<br />
605<br />
605<br />
2,155,387<br />
13,812,501<br />
2,688,407<br />
(1,264,325)<br />
1,174,505<br />
(89,820)<br />
(219,138)<br />
(219,138)<br />
2,379,449<br />
33,818,618<br />
Net Cash Provided (Used) by Operating Activities<br />
Cash Flows from Non-Capital<br />
Financing Activities:<br />
Cash transfers out<br />
Cash transfers in<br />
Net Cash Provided (Used) by<br />
Non-Capital Financing Activities<br />
Cash Flows from Capital<br />
and Related Financing Activities:<br />
Acquisition and construction of capital assets<br />
Net Cash Provided (Used) by<br />
Capital and Related Financing Activities<br />
Net Increase (Decrease) in Cash<br />
and Cash Equivalents<br />
Cash and Cash Equivalents at Beginning of Year<br />
$ 225,057 $ 15,967,888 $ 36,198,067 Cash and Cash Equivalents at End of Year<br />
$ (159,347) $ 2,098,100 $ 2,253,081<br />
Reconciliation of Operating Income to Net Cash<br />
Provided (Used) by Operating Activities:<br />
Operating income (loss)<br />
Adjustments to reconcile operating income (loss)<br />
net cash provided (used) by operating activities:<br />
25,761 202,982 764,645 Depreciation<br />
-<br />
-<br />
(63) (Increase) decrease in accounts receivable<br />
-<br />
- (13,195) (Increase) decrease in prepaid expense<br />
(8,575)<br />
-<br />
(8,575) (Increase) decrease in inventories<br />
958<br />
-<br />
13,660 Increase (decrease) in accounts payable<br />
(8,531)<br />
- (107,624) Increase (decrease) in accrued liabilities<br />
-<br />
- (193,000) Increase (decrease) in self-insurance payable<br />
(11,001)<br />
- (20,522) Increase (decrease) in compensated absences<br />
(1,388)<br />
202,982<br />
435,326<br />
Total Adjustments<br />
$ (160,735) $ 2,301,082 $ 2,688,407<br />
Net Cash Provided (Used) by<br />
Operating Activities<br />
167
168
Agency Funds
Deposit Liability Fund<br />
AGENCY FUNDS<br />
This fund is used to account for miscellaneous deposits collected by the City.<br />
Assessment District 87-4 Fund<br />
This fund is used to account for the receipt and remittance of special assessments for the<br />
Assessment District 87-4 Limited Obligation Improvement Bonds. The bonds are not secured by<br />
the general taxing power of the City, the State of California or any other political subdivision<br />
thereof, and neither the City nor the State, nor any potential subdivision thereof, has pledged its<br />
full faith and credit for the payment thereof.<br />
Assessment District 98-1 Fund<br />
This fund is used to account for the receipt and remittance of special assessments for the<br />
Assessment District 98-1 Limited Obligation Improvement Bonds. All property owners except one<br />
paid their fees upfront.<br />
TUMF Trust Fund<br />
This fund is used to account for the receipt of the Transportation Uniform Mitigation Fees (TUMF)<br />
and their remittance to the Western Riverside Council of Governments (WRCOG).<br />
MSHCP Trust Fund<br />
This fund is used to account for the receipt of the Multi-Species Habitat Conservation Plan<br />
(MSHCP) fees and their remittance to the Western Riverside County Regional Conservation<br />
Agency (WRCRCA).<br />
<strong>Moreno</strong> <strong>Valley</strong> Foundation Donations Fund<br />
This fund is being used on a temporary basis to account for the receipts and disbursements of the<br />
<strong>Moreno</strong> <strong>Valley</strong> Community Foundation until such time that the Foundation is officially cleared by<br />
the Internal Revenue Service to become operational as a tax-exempt 501(c)3 organization.<br />
CFD #5 Stoneridge Fund<br />
This fund is used to account for the receipt and remittance of special taxes for the CFD #5<br />
Stoneridge Special Tax Bonds. The bonds are not secured by the general taxing power of the<br />
City, the State of California or any other political subdivision thereof, and neither the City nor the<br />
State, nor any potential subdivision thereof, has pledged its full faith and credit for the payment<br />
thereof.<br />
Arts Commission Fund<br />
This fund is used to account for funds received to encourage, stimulate, promote and foster<br />
programs for the cultural enrichment of the City, thereby contributing to the quality of life of its<br />
residents. This fund also accounts for funding received to develop an awareness of the value of<br />
arts in <strong>Moreno</strong> <strong>Valley</strong>’s business community, local government and the general public.<br />
169
City of <strong>Moreno</strong> <strong>Valley</strong><br />
Combining Balance Sheet<br />
All Agency Funds<br />
June 30, 2011<br />
Deposit Assessment Assessment<br />
Liability District 87-4 District 98-1 TUMF Trust MSHCP Trust<br />
Assets:<br />
Pooled cash and investments<br />
Receivables:<br />
$ 6,683,508 $ 105,232 $ 2,649 $ 17,746 $ 279,383<br />
Accounts 25,158<br />
-<br />
-<br />
-<br />
-<br />
Due from other governments<br />
Restricted assets:<br />
-<br />
60<br />
-<br />
-<br />
-<br />
Cash with fiscal agents -<br />
-<br />
-<br />
-<br />
-<br />
Total Assets $ 6,708,666 $ 105,292 $ 2,649 $ 17,746 $ 279,383<br />
Liabilities:<br />
Accounts payable $ 990 $ - $ - $ 17,746 $ 279,383<br />
Deposits payable 6,707,676<br />
-<br />
-<br />
-<br />
-<br />
Payable to trustee -<br />
105,292<br />
2,649<br />
-<br />
-<br />
Total Liabilities $ 6,708,666 $ 105,292 $ 2,649 $ 17,746 $ 279,383<br />
170
<strong>Moreno</strong> <strong>Valley</strong><br />
Foundation CFD # 5<br />
Arts<br />
Donations Stoneridge Commission Totals<br />
$ 221,650 $ - $ 1,625 $ 7,311,793<br />
Assets:<br />
Pooled cash and investments<br />
Receivables:<br />
-<br />
26,875<br />
-<br />
52,033 Accounts<br />
-<br />
42,791<br />
-<br />
42,851 Due from other governments<br />
Restricted assets:<br />
-<br />
665,165<br />
-<br />
665,165 Cash with fiscal agents<br />
$ 221,650 $ 734,831 $ 1,625 $ 8,071,842<br />
Total Assets<br />
$ - $ - $ - $ 298,119<br />
Liabilities:<br />
Accounts payable<br />
-<br />
-<br />
-<br />
6,707,676 Deposits payable<br />
221,650<br />
734,831<br />
1,625<br />
1,066,047 Payable to trustee<br />
$ 221,650 $ 734,831 $ 1,625 $ 8,071,842<br />
Total Liabilities<br />
171
Deposit Liability<br />
Balance Balance<br />
7/1/2010 Additions Deductions 6/30/2011<br />
Assets:<br />
Pooled cash and investments<br />
Receivables:<br />
$ 6,539,875 $ 1,308,907 $ 1,165,274 $ 6,683,508<br />
Accounts 1,395<br />
25,158<br />
1,395<br />
25,158<br />
Total Assets<br />
Liabilities:<br />
$ 6,541,270 $ 1,334,065 $ 1,166,669 $ 6,708,666<br />
Accounts payable $ 105,636 $ 298,589 $ 403,235 $ 990<br />
Deposits payable 6,435,634 1,332,670 1,060,628 6,707,676<br />
Total Liabilities $ 6,541,270 $ 1,631,259 $ 1,463,863 $ 6,708,666<br />
Assessment District 87-4<br />
Assets:<br />
Pooled cash and investments $ 107,936 $ - $ 2,704 $ 105,232<br />
Due from other governments -<br />
60<br />
-<br />
60<br />
Total Assets<br />
Liabilities:<br />
$ 107,936 $ 60 $ 2,704 $ 105,292<br />
Payable to trustee $ 107,936 $ 60 $ 2,704 $ 105,292<br />
Total Liabilities $ 107,936 $ 60 $ 2,704 $ 105,292<br />
Assessment District 98-1<br />
Assets:<br />
Pooled cash and investments $ 954 $ 2,703 $ 1,008 $ 2,649<br />
Total Assets<br />
Liabilities:<br />
$ 954 $ 2,703 $ 1,008 $ 2,649<br />
Payable to trustee $ 954 $ 1,695 $ - $ 2,649<br />
Total Liabilities $ 954 $ 1,695 $ - $ 2,649<br />
TUMF Trust<br />
Assets:<br />
Pooled cash and investments $ 4,437 $ 917,815 $ 904,506 $ 17,746<br />
Total Assets<br />
Liabilities:<br />
$ 4,437 $ 917,815 $ 904,506 $ 17,746<br />
Accounts payable $ 4,437 $ 917,815 $ 904,506 $ 17,746<br />
Total Liabilities $ 4,437 $ 917,815 $ 904,506 $ 17,746<br />
MSHCP Trust<br />
City of <strong>Moreno</strong> <strong>Valley</strong><br />
Combining Statement of Changes in Assets and Liabilities<br />
All Agency Funds<br />
Year Ended June 30, 2011<br />
Assets:<br />
Pooled cash and investments $ 6,530 $ 957,478 $ 684,625 $ 279,383<br />
Due from other governments 26,416<br />
-<br />
26,416<br />
-<br />
Total Assets<br />
Liabilities:<br />
$ 32,946 $ 957,478 $ 711,041 $ 279,383<br />
Accounts payable $ 32,946 $ 957,478 $ 711,041 $ 279,383<br />
Total Liabilities $ 32,946 $ 957,478 $ 711,041 $ 279,383<br />
172
<strong>Moreno</strong> <strong>Valley</strong> Foundation Donations<br />
City of <strong>Moreno</strong> <strong>Valley</strong><br />
Combining Statement of Changes in Assets and Liabilities<br />
All Agency Funds<br />
Year Ended June 30, 2011<br />
Balance Balance<br />
7/1/2010 Additions Deductions 6/30/2011<br />
Assets:<br />
Pooled cash and investments $ 221,650 $ - $ - $ 221,650<br />
Total Assets<br />
Liabilities:<br />
$ 221,650 $ - $ - $ 221,650<br />
Payable to trustee $ 221,650 $ - $ - $ 221,650<br />
Total Liabilities $ 221,650 $ - $ - $ 221,650<br />
CFD # 5 Stoneridge<br />
Assets:<br />
Pooled cash and investments<br />
Receivables:<br />
$ 22,500 $ 360,095 $ 382,595 $<br />
-<br />
Accounts -<br />
26,875<br />
-<br />
26,875<br />
Due from other governments<br />
Restricted assets:<br />
-<br />
42,791<br />
-<br />
42,791<br />
Cash with fiscal agents 720,373<br />
-<br />
55,208<br />
665,165<br />
Total Assets<br />
Liabilities:<br />
$ 742,873 $ 429,761 $ 437,803 $ 734,831<br />
Payable to trustee $ 742,873 $ 429,761 $ 437,803 $ 734,831<br />
Total Liabilities $ 742,873 $ 429,761 $ 437,803 $ 734,831<br />
Arts Commission<br />
Assets:<br />
Pooled cash and investments $ 802 $ 1,327 $ 504 $ 1,625<br />
Total Assets<br />
Liabilities:<br />
$ 802 $ 1,327 $ 504 $ 1,625<br />
Payable to trustee $ 802 $ 823 $ - $ 1,625<br />
Total Liabilities $ 802 $ 823 $ - $ 1,625<br />
Totals - All Agency Funds<br />
Assets:<br />
Pooled cash and investments<br />
Receivables:<br />
$ 6,904,684 $ 3,548,325 $ 3,141,216 $ 7,311,793<br />
Accounts 1,395<br />
52,033<br />
1,395<br />
52,033<br />
Due from other governments<br />
Restricted assets:<br />
26,416<br />
42,851<br />
26,416<br />
42,851<br />
Cash with fiscal agents 720,373<br />
-<br />
55,208<br />
665,165<br />
Total Assets<br />
Liabilities:<br />
$ 7,652,868 $ 3,643,209 $ 3,224,235 $ 8,071,842<br />
Accounts payable $ 143,019 $ 2,173,882 $ 2,018,782 $ 298,119<br />
Deposits payable 6,435,634 1,332,670 1,060,628 6,707,676<br />
Payable to trustee 1,074,215<br />
432,339<br />
440,507 1,066,047<br />
Total Liabilities $ 7,652,868 $ 3,938,891 $ 3,519,917 $ 8,071,842<br />
173
174
Capital Assets
175
Function and Activity:<br />
General government:<br />
City of <strong>Moreno</strong> <strong>Valley</strong><br />
Schedule of General Capital Assets<br />
By Function and Activity<br />
June 30, 2011<br />
Land CIP<br />
Buildings and<br />
Improvements<br />
Furniture and<br />
Equipment<br />
City manager $ - $ - $ - $ 203,255<br />
City attorney - - - 12,068<br />
City clerk - - - 313,048<br />
Human resources - - - 16,467<br />
Finance - - - 23,534<br />
Other - unclassified 45,940,067 449,001 3,944,918 21,832<br />
Total General Government 45,940,067 449,001 3,944,918 590,204<br />
Public safety:<br />
Police 137,173 - 11,304,420 1,367,248<br />
Fire 893,270 122,887 17,407,539 853,925<br />
Animal control 590,127 - 3,040,331 93,064<br />
Volunteer services - 1,200,741 4,392,851 47,901<br />
Total Public Safety 1,620,570 1,323,628 36,145,141 2,362,138<br />
Public works 250,963,217 46,644,401 - 928,608<br />
Community development - - 4,587,526 364,889<br />
Community services district 450,000 362,604 48,960,419 1,669,764<br />
Redevelopment agency 9,435,936 1,402,196 12,191,837 352,837<br />
Internal service funds - 127,836 10,389,587 6,305,398<br />
Grand Total $ 308,409,790 $ 50,309,666 $ 116,219,428 $ 12,573,838<br />
176
Vehicles Infrastructure Total<br />
$ 84,428 $ -<br />
287,683<br />
Function and Activity:<br />
General government:<br />
City manager<br />
- - 12,068 City attorney<br />
- - 313,048 City clerk<br />
- - 16,467 Human resources<br />
62,805 - 86,339 Finance<br />
- - 50,355,818 Other - unclassified<br />
147,233 - 51,071,423 Total General Government<br />
Public safety:<br />
1,074,855 - 13,883,696 Police<br />
2,100,719 - 21,378,340 Fire<br />
314,556 - 4,038,078 Animal control<br />
170,667 - 5,812,160 Volunteer services<br />
3,660,797 - 45,112,274 Total Public Safety<br />
2,504,185 624,765,580 925,805,991 Public works<br />
388,770 - 5,341,185 Community development<br />
529,504 101,457 52,073,748 Community services district<br />
- 9,599,517 32,982,323 Redevelopment agency<br />
2,580,421 401,116 19,804,358 Internal service funds<br />
$ 9,810,910 $ 634,867,670 $ 1,132,191,302 Grand Total<br />
177
178
Statistical Section
This part of the City of <strong>Moreno</strong> <strong>Valley</strong>'s comprehensive annual financial report presents detailed<br />
information as a context for understanding what the information in the financial statements, note<br />
disclosures, and required supplementary information says about the City's overall financial health.<br />
Contents Page #<br />
<strong>Financial</strong> Trends 180<br />
These schedules contain trend information to help the reader<br />
understand how the city's financial performance and well-being<br />
have changed over time.<br />
Revenue Capacity 185<br />
These schedules contain information to help the reader assess the<br />
factors affecting the city's ability to generate its key revenues.<br />
Debt Capacity 192<br />
These schedules present information to help the reader assess the<br />
affordability of the city's current levels of outstanding debt and the<br />
city's ability to issue additional debt in the future.<br />
Demographic and Economic Information 197<br />
These schedules offer demographic and economic indicators to help<br />
the reader understand the environment within which the city's<br />
financial activities take place and help make comparisons over time<br />
and with other governments.<br />
Operating Information 200<br />
These schedules contain information about the city's operations and<br />
resources to help the reader understand how the city's financial<br />
information relates to the services the city provides and the activities<br />
it performs.<br />
Sources: Unless otherwise noted, the information in these schedules is derived from the comprehensive annual<br />
financial reports for the relevant year. The city implemented Statement 34 in 2003; schedules presenting governmentwide<br />
information include information beginning in that year.<br />
179
180<br />
City of <strong>Moreno</strong> <strong>Valley</strong><br />
Net Assets by Component,<br />
Last eight fiscal years<br />
(accrual basis of accounting)<br />
2004 2005 2006 2007 2008 2009 2010 2011<br />
Governmental activities<br />
Invested in capital assets, net of related debt<br />
Restricted for:<br />
$ 465,542,271 $ 475,642,146 $ 523,083,597 $ 594,870,636 $ 622,102,140 $704,987,685 $ 768,345,954 $ 784,881,452<br />
Community development projects 6,961,781 6,404,249 10,076,376<br />
- 41,908,201 19,960,752 36,341,964 7,079,640<br />
Community and cultural -<br />
-<br />
-<br />
- 8,259,181<br />
- 8,368,534 8,968,479<br />
Public safety 2,086,222 2,649,176 1,655,374 973,667 663,854 280,107 2,103,241 644,786<br />
Capital projects 40,769,509 47,442,301 60,687,985 66,493,508 79,745,801 71,335,816 61,365,635 109,095,517<br />
Debt service 23,966,889 21,673,132 12,985,998 12,538,629 7,291,425 17,373,369 15,818,072 12,867,643<br />
Other Programs -<br />
-<br />
- 14,863,573 3,598,110 11,731,764 2,545,781 301,868<br />
Permanent funds-nonexpendable -<br />
- 59,359<br />
62,537<br />
64,692<br />
66,436 169,287 170,162<br />
Unrestricted 32,744,174 46,215,255 73,846,697 101,941,651 104,545,617 69,630,581 46,594,052 24,461,651<br />
Total Governmental activities net assets $ 572,070,846 $ 600,026,259 $ 682,395,386 $ 791,744,201 $ 868,179,021 $ 895,366,510 $ 941,652,520 $ 948,471,198<br />
Business-type activities<br />
Invested in capital assets, net of related debt<br />
Restricted<br />
$ 709,310 $ 1,815,311 $ 18,151,135 $ 14,130,659 $ 14,110,399 $ 10,083,679 $ 12,201,754 $ 13,942,981<br />
Regulatory contingencies -<br />
-<br />
- 1,604,444 948,207 1,767,402 1,158,200 1,702,037<br />
Unrestricted (575,790) (799,941) (3,713,053) (634,406) (2,252,565) (4,023,374) (4,520,034) (5,623,674)<br />
Total Business-type activities net assets $ 133,520 $ 1,015,370 $ 14,438,082 $ 15,100,697 $ 12,806,041 $ 7,827,707 $ 8,839,920 $ 10,021,344<br />
Primary government<br />
Invested in capital assets, net of related debt<br />
Restricted for:<br />
$ 466,251,581 $ 477,457,457 $ 541,234,732 $ 609,001,295 $ 636,212,539 $ 715,071,364 $ 780,547,708 $ 798,824,433<br />
Community development projects 6,961,781 6,404,249 10,076,376<br />
- 41,908,201 19,960,752 36,341,964 7,079,640<br />
Community and cultural -<br />
-<br />
-<br />
- 8,259,181<br />
- 8,368,534 8,968,479<br />
Public safety 2,086,222 2,649,176 1,655,374 973,667 663,854 280,107 2,103,241 644,786<br />
Capital projects 40,769,509 47,442,301 60,687,985 66,493,508 79,745,801 71,335,816 61,365,635 109,095,517<br />
Debt service 23,966,889 21,673,132 12,985,998 12,538,629 7,291,425 17,373,369 15,818,072 12,867,643<br />
Other Programs -<br />
-<br />
- 14,863,573 3,598,110 11,731,764 2,545,781 301,868<br />
Permanent funds-nonexpendable -<br />
- 59,359<br />
62,537<br />
64,692<br />
66,436 169,287 170,162<br />
Regulatory contingencies -<br />
-<br />
- 1,604,444 948,207 1,767,402 1,158,200 1,702,037<br />
Unrestricted 32,168,384 45,415,314 70,133,644 101,307,245 102,293,052 65,607,207 42,074,018 18,837,977<br />
Total primary government net assets $ 572,204,366 $ 601,041,629 $ 696,833,468 $ 806,844,898 $ 880,985,062 $ 903,194,217 $ 950,492,440 $ 958,492,542<br />
Note: The city implemented the GASB 34 reporting model in Fiscal Year 2003. Information prior to the implementation of GASB 34 is not available.
181<br />
City of <strong>Moreno</strong> <strong>Valley</strong><br />
Change in Net Assets,<br />
Last eight fiscal years<br />
(accrual basis of accounting)<br />
2004 2005 2006 2007 2008 2009 2010 2011<br />
Expenses<br />
Governmental activities:<br />
General government $ 10,902,771 $ 18,583,987 $ 12,817,483 $ 10,796,963 $ 14,416,941 $ 14,948,628 $ 12,093,157 $ 13,001,340<br />
Public safety 39,563,567 42,797,971 47,282,305 43,415,662 54,412,284 50,856,439 58,165,412 59,640,431<br />
Community development 8,198,449 10,041,715 13,666,378 9,643,084 10,964,507 12,036,237 29,663,451 10,003,780<br />
Community and cultural 13,789,758 14,132,146 15,999,800 21,181,096 33,717,135 27,904,884 22,700,681 25,046,848<br />
Public works 10,287,806 11,352,870 10,273,707 30,750,411 29,247,892 36,095,949 14,990,867 34,432,579<br />
Interest on long-term debt 5,869,952 5,514,358 8,079,935 8,724,134 12,081,884 10,334,932 9,126,054 8,333,540<br />
Total Governmental activities expenses 88,612,303 102,423,047 108,119,608 124,511,350 154,840,643 152,177,069 146,739,622 150,458,518<br />
Business-type activities:<br />
Electric 76,106 1,080,589 3,673,509 8,298,955 12,282,161 14,067,086 13,812,966 14,807,788<br />
Total business-type activities expenses 76,106 1,080,589 3,673,509 8,298,955 12,282,161 14,067,086 13,812,966 14,807,788<br />
Total primary government expenses $ 88,688,409 $ 103,503,636 $ 111,793,117 $ 132,810,305 $ 167,122,804 $ 166,244,155 $ 160,552,588 $ 165,266,306<br />
Program revenues<br />
Governmental activities:<br />
Charges for services:<br />
General government $ 1,699,588 $ 1,855,342 $ 2,447,730 $ 2,994,550 $ 1,329,861 $ 1,144,983 $ 3,148,712 $ 5,008,441<br />
Public safety 922,986 1,158,745 2,040,725 1,212,229 4,948,923 6,559,817 4,371,535 2,787,962<br />
Community development 7,964,124 10,814,238 12,576,280 12,947,546 6,962,389 7,607,316 4,071,460 4,911,984<br />
Community and cultural 8,397,842 9,012,514 10,067,509 10,963,716 12,163,575 14,982,931 11,254,752 11,237,049<br />
Public works<br />
Operating contributions and grants:<br />
16,113,736 14,639,669 20,523,959 10,612,170 19,134,172 7,840,754 2,264,619 3,364,804<br />
General government 2,315,147 2,121,229 422,310 622,513<br />
- 92,319 66,861 940,799<br />
Public safety 973,642 773,875 838,921 931,062 704,324 385,195 1,016,552 1,009,290<br />
Community development 866,940 1,586,824 3,252,611 4,023,295 2,873,752 2,541,925 8,909,018 5,769,165<br />
Community and cultural 1,216 68,396 133,325 100,777 6,911,186 5,936,040 5,174,090 6,635,271<br />
Public works<br />
Capital contributions and grants<br />
626,074 887,750 2,985,031 460,787 631,830 3,901,583 6,345,620 6,353,159<br />
General government -<br />
-<br />
-<br />
-<br />
-<br />
- 31,307<br />
-<br />
Public safety 221,729<br />
-<br />
-<br />
-<br />
-<br />
- 146,606 534,771<br />
Community development -<br />
-<br />
-<br />
-<br />
-<br />
- 918,785 20,180<br />
Community and cultural -<br />
-<br />
-<br />
-<br />
- 239,746<br />
-<br />
-<br />
Public works 1,157,085 2,160,498 24,442,306 74,752,980 74,004,139 31,573,778 70,826,175 29,208,716<br />
Total governmental activities program revenues 41,260,109 45,079,080 79,730,707 119,621,625 129,664,151 82,806,387 118,546,092 77,781,591<br />
Business-type activities:<br />
Charges for services<br />
Electric 319,135 1,356,555 11,445,287 8,712,097 10,311,654 12,430,482 13,326,364 15,671,939<br />
Capital contributions and grants -<br />
-<br />
- 1,604,577<br />
-<br />
-<br />
-<br />
-<br />
Total business-type activities program revenues 319,135 1,356,555 11,445,287 10,316,674 10,311,654 12,430,482 13,326,364 15,671,939<br />
Total primary government program revenues $ 41,579,244 $ 46,435,635 $ 91,175,994 $ 129,938,299 $ 139,975,805 $ 95,236,869 $ 131,872,456 $ 93,453,530<br />
(Continued)
182<br />
City of <strong>Moreno</strong> <strong>Valley</strong><br />
Change in Net Assets,<br />
Last eight fiscal years<br />
(accrual basis of accounting)<br />
2004 2005 2006 2007 2008 2009 2010 2011<br />
Net (Expense)/Revenue<br />
Governmental activities $ (47,352,194) $ (57,343,967) $ (28,388,901) $ (4,889,725) $ (25,176,492) $ (69,370,682) $ (28,193,530) $ (72,676,927)<br />
Business-type activities 243,029 275,966 7,771,778 2,017,719 (1,970,507) (1,636,604) (486,602) 864,151<br />
Total primary government net (expense)/revenue $ (47,109,165) $ (57,068,001) $ (20,617,123) $ (2,872,006) $ (27,146,999) $ (71,007,286) $ (28,680,132) $ (71,812,776)<br />
General Revenues and Other Changes in Net Assets<br />
Governmental activities:<br />
Taxes:<br />
Property taxes $ 12,897,208 $ 19,678,253 $ 18,001,808 $ 23,379,735 $ 30,351,211 $ 28,316,208 $ 16,836,699 $ 22,699,683<br />
Property taxes in lieu - 8,644,834 12,068,070 14,150,000 16,728,600 16,791,078 13,703,197 13,055,796<br />
Transient occupancy tax 455,009 519,193 582,307 586,383 593,009 497,936 535,775 692,586<br />
Sales tax 15,469,300 18,054,078 12,275,626 15,701,460 13,623,654 12,163,719 10,982,811 12,277,450<br />
Franchise taxes 3,599,486 3,791,547 4,099,859 4,349,870 4,381,882 4,876,055 4,607,594 4,888,143<br />
Business license taxes 1,289,434 1,457,521 1,240,764 1,315,039 1,111,021 1,051,702 961,303 1,053,146<br />
Utility users tax 10,980,848 12,527,514 13,811,740 15,463,291 15,186,616 15,081,286 15,358,341 15,317,439<br />
Other taxes 7,963,160 4,497,323 5,448,829 6,320,978 2,620,059 2,683,193 2,278,529 1,204,064<br />
Franchise in lieu taxes -<br />
9,699<br />
42,788 78,573 96,816 120,969 132,548 150,456<br />
Documentary transfer tax 1,055,205 1,391,199 1,548,205 972,995 575,003 598,084 479,208 424,931<br />
Intergovernmental-motor vehicle in lieu, unrestricted 7,288,137 3,484,623 11,899,563 16,054,145 800,667 865,718 547,188<br />
-<br />
Use of property and money 1,608,126 5,295,415 6,959,412 13,467,580 16,380,462 9,381,199 10,850,116 5,298,098<br />
Gain on sale of capital assets -<br />
-<br />
-<br />
-<br />
2,575<br />
-<br />
-<br />
605<br />
Miscellaneous 14,427,133 5,435,103 1,820,976 405,679 885,602 1,787,772 1,238,641 2,784,308<br />
Transfers 193,000 (16,857) (1,257,370) (75,851) 61,817 653,554 225,192 (107,841)<br />
Total governmental activities 77,226,046 84,769,445 88,542,577 112,169,877 103,398,994 94,868,473 78,737,142 79,738,864<br />
Business-type activities<br />
Use of property and money -<br />
-<br />
-<br />
-<br />
-<br />
- 61,428 29,540<br />
Other 83,491 589,027<br />
-<br />
-<br />
- 131,033 1,250,000 179,892<br />
Transfers (193,000) 16,857 1,257,370 75,851 (61,817) (653,554) (225,192) 107,841<br />
Total business-type activities (109,509) 605,884 1,257,370 75,851 (61,817) (522,521) 1,086,236 317,273<br />
Total primary government $ 77,116,537 $ 85,375,329 $ 89,799,947 $ 112,245,728 $ 103,337,177 $ 94,345,952 $ 79,823,378 $ 80,056,137<br />
Change in Net Assets<br />
Government activities $ 29,873,852 $ 27,425,478 $ 60,153,676 $ 107,280,152 $ 78,222,502 $ 25,497,791 $ 50,543,612 $ 7,061,937<br />
Business-type activities 133,520 881,850 9,029,148 2,093,570 (2,032,324) (2,159,125) 599,634 1,181,424<br />
Total primary government $ 30,007,372 $ 28,307,328 $ 69,182,824 $ 109,373,722 $ 76,190,178 $ 23,338,666 $ 51,143,246 $ 8,243,361<br />
Note: The city implemented the GASB 34 reporting model in Fiscal Year 2003. Information prior to the implementation of GASB 34 is not available.
183
184<br />
City of <strong>Moreno</strong> <strong>Valley</strong><br />
Fund Balances, Governmental Funds<br />
Last eight fiscal years<br />
(modified accrual basis of accounting)<br />
2004 2005 2006 2007 2008 2009 2010 2011<br />
General Fund<br />
Reserved $ 6,654,472 $ 6,052,320 $ 11,808,994 $ 13,580,492 $ 35,752,164 $ 34,787,698 $ 33,788,960 $<br />
-<br />
Unreserved 11,943,948 24,992,976 25,920,111 39,494,188 21,937,845 17,066,883 17,500,579<br />
-<br />
Nonspendable -<br />
-<br />
-<br />
-<br />
-<br />
-<br />
- 5,716,008<br />
Committed -<br />
-<br />
-<br />
-<br />
-<br />
-<br />
- 2,600,000<br />
Assigned -<br />
-<br />
-<br />
-<br />
-<br />
-<br />
- 1,414,860<br />
Unassigned -<br />
-<br />
-<br />
-<br />
-<br />
-<br />
- 36,634,651<br />
Total General Fund $ 18,598,420 $ 31,045,296 $ 37,729,105 $ 53,074,680 $ 57,690,009 $ 51,854,581 $ 51,289,539 $ 46,365,519<br />
All Other Funds<br />
Reserved<br />
Unreserved reported in:<br />
$ 26,685,317 $ 21,994,729 $ 49,040,215 $ 49,559,718 $ 90,143,820 $ 86,530,127 $ 79,688,486 $<br />
-<br />
Special revenue funds 37,493,168 44,049,195 47,464,569 48,534,518 50,516,963 42,222,678 30,378,947<br />
-<br />
Capital projects funds (6,891,945) (2,959,368) 27,383,018 36,453,807 29,300,262 27,359,094 27,373,151<br />
-<br />
Debt service funds 4,304,047<br />
917,262<br />
949,518<br />
-<br />
-<br />
-<br />
-<br />
-<br />
Permanent funds -<br />
-<br />
59,359<br />
-<br />
-<br />
66,436<br />
169,287<br />
-<br />
Nonspendable -<br />
-<br />
-<br />
-<br />
-<br />
-<br />
- 32,582,050<br />
Restricted -<br />
-<br />
-<br />
-<br />
-<br />
-<br />
- 106,735,045<br />
Committed -<br />
-<br />
-<br />
-<br />
-<br />
-<br />
-<br />
13,321<br />
Assigned -<br />
-<br />
-<br />
-<br />
-<br />
-<br />
- 15,151,482<br />
Unassigned -<br />
-<br />
-<br />
-<br />
-<br />
-<br />
- (33,954,694)<br />
Total all other funds $ 61,590,587 $ 64,001,818 $ 124,896,679 $ 134,548,043 $ 169,961,045 $ 156,178,335 $ 137,609,871 $ 120,527,204<br />
Notes: The city implemented the GASB 34 reporting model in Fiscal Year 2003. Information prior to the implementation of GASB 34 is not available.<br />
The city implemented GASB Statement No. 54 in fiscal year 2011.
185<br />
City of <strong>Moreno</strong> <strong>Valley</strong><br />
Changes in Fund Balances, Governmental Funds<br />
Last eight fiscal years<br />
(modified accrual basis of accounting)<br />
2004 2005 2006 2007 2008 2009 2010 2011<br />
Revenue<br />
Taxes $ 46,216,887 $ 54,463,821 $ - $ - $ - $ - $ - $ -<br />
Property tax -<br />
- 14,342,099 26,854,009 30,351,211 28,316,208 16,836,699 22,699,683<br />
Property taxes in lieu -<br />
- 12,068,070 14,150,000 16,728,600 16,791,078 13,703,197 13,055,796<br />
Utility taxes -<br />
- 13,811,740 15,463,291 15,186,616 15,081,286 15,358,341 15,317,439<br />
Sales taxes -<br />
- 12,275,627 15,701,460 13,623,654 12,163,719 10,982,811 12,277,450<br />
Other taxes -<br />
- 16,622,460 9,637,850 9,377,790 9,827,939 8,994,957 8,413,326<br />
Assessments 41,683<br />
-<br />
-<br />
-<br />
-<br />
-<br />
-<br />
Licenses, fees and permits 8,868,460 12,159,692 13,041,187 13,552,983 2,650,530 1,930,905 1,354,188 1,532,514<br />
Charges for services 26,874,096 25,755,085 18,574,210 25,046,576 24,745,073 21,876,389 20,182,147 21,497,689<br />
Intergovernmental 20,164,244 27,037,053 33,213,048 16,703,254 31,497,898 32,642,154 39,049,424 27,591,342<br />
Use of property and money 1,571,485 4,438,468 7,199,105 13,466,716 16,380,462 9,381,199 10,850,116 7,027,197<br />
Fines and forfeitures 929,813 1,097,508 1,205,173 1,159,350 1,293,056 1,262,712 1,176,403 833,799<br />
Miscellaneous 1,393,391 4,078,406 2,652,320 1,089,949 885,602 1,787,772 1,238,641 4,251,577<br />
Total revenues 106,060,059<br />
Expenditures<br />
General government 8,937,124<br />
Public Safety 32,300,542<br />
Community development 6,790,803<br />
Community and cultural 11,492,361<br />
Public works 8,724,368<br />
Capital outlay<br />
Debt service<br />
14,647,639<br />
Principal retirement 20,472,246<br />
Interest and fiscal charges 5,897,812<br />
Bond issuance costs -<br />
Total expenditures 109,262,895<br />
Excess of revenues over/<br />
(under) expenditures (3,202,836)<br />
129,030,033<br />
14,983,932<br />
36,806,865<br />
8,711,599<br />
12,331,683<br />
9,999,497<br />
19,885,754<br />
2,723,847<br />
5,381,740<br />
-<br />
110,824,917<br />
18,205,116<br />
145,005,039<br />
10,723,374<br />
43,478,949<br />
24,608,096<br />
14,889,677<br />
21,262,923<br />
-<br />
2,896,585<br />
7,334,361<br />
664,638<br />
125,858,603<br />
19,146,436<br />
152,825,438<br />
12,060,789<br />
50,276,192<br />
10,116,658<br />
19,286,807<br />
31,391,248<br />
-<br />
3,095,000<br />
8,476,750<br />
326,385<br />
135,029,829<br />
17,795,609<br />
162,720,492<br />
14,681,999<br />
56,361,973<br />
18,144,115<br />
32,683,219<br />
34,616,617<br />
-<br />
18,538,387<br />
9,213,625<br />
2,413,464<br />
186,653,399<br />
(23,932,907)<br />
151,061,361<br />
14,825,012<br />
57,866,348<br />
13,895,163<br />
27,331,726<br />
45,328,685<br />
-<br />
4,154,660<br />
10,382,080<br />
-<br />
173,783,674<br />
(22,722,313)<br />
139,726,924<br />
12,607,630<br />
58,311,716<br />
15,003,855<br />
21,982,074<br />
13,796,314<br />
26,269,751<br />
3,690,094<br />
9,198,762<br />
-<br />
160,860,196<br />
(21,133,272)<br />
134,497,812<br />
14,504,781<br />
58,152,125<br />
17,181,128<br />
23,006,061<br />
15,018,071<br />
15,759,712<br />
11,724,021<br />
8,345,084<br />
-<br />
163,690,983<br />
(29,193,171)
186<br />
City of <strong>Moreno</strong> <strong>Valley</strong><br />
Changes in Fund Balances, Governmental Funds<br />
Last eight fiscal years<br />
(modified accrual basis of accounting)<br />
Other Financing Sources (Uses)<br />
Issuance of debt -<br />
Transfers in 13,058,959<br />
Transfers out (12,125,059)<br />
Sale of capital assets -<br />
Premium on debt issued -<br />
Discount on debt issued -<br />
Payment to refunded bond escrow agents -<br />
Other debts issued 1,199,343<br />
Total other financing sources (uses) 2,133,243<br />
2004 2005 2006 2007 2008 2009 2010 2011<br />
(Continued)<br />
-<br />
24,871,852<br />
(24,165,709)<br />
-<br />
-<br />
-<br />
(5,006,586)<br />
250,767<br />
(4,049,676)<br />
48,205,000<br />
37,201,043<br />
(38,480,919)<br />
-<br />
570,840<br />
(385,640)<br />
-<br />
-<br />
47,110,324<br />
5,870,000<br />
33,422,242<br />
(30,526,931)<br />
-<br />
-<br />
-<br />
-<br />
-<br />
8,765,311<br />
58,412,429<br />
38,016,856<br />
(36,688,115)<br />
442,085<br />
-<br />
-<br />
-<br />
-<br />
60,183,255<br />
-<br />
27,284,397<br />
(24,926,511)<br />
-<br />
-<br />
-<br />
-<br />
-<br />
2,357,886<br />
-<br />
29,322,934<br />
(26,106,962)<br />
-<br />
-<br />
-<br />
-<br />
-<br />
3,215,972<br />
7,447,764<br />
18,994,235<br />
(19,012,256)<br />
-<br />
-<br />
-<br />
-<br />
-<br />
7,429,743<br />
Net change in fund balances $ (1,069,593) $ 14,155,440 $ 66,256,760 $ 26,560,920 $ 36,250,348 $ (20,364,427) $ (17,917,300) $ (21,763,428)<br />
Debt service as a percentage<br />
of noncapital expenditures 27.87% 8.91% 10.54% 10.56% 19.40% 10.65% 9.58% 13.57%<br />
Note: The city implemented the GASB 34 reporting model in Fiscal Year 2003. Information prior to the implementation of GASB 34 is not available.
187<br />
City of <strong>Moreno</strong> <strong>Valley</strong><br />
Tax Revenues by Source, General Fund<br />
(modified accrual basis of accounting)<br />
Property Tax<br />
In-Lieu of<br />
Business<br />
Fiscal<br />
Vehicle<br />
Transient<br />
Motor Vehicle License Gross Documentary<br />
Year Property License Fees (2) Utility Users Sales & Use Occupancy Franchise In-Lieu<br />
Receipt Transfer Total<br />
2003 $ 5,710,105 $ - $ 9,718,667 $ 8,171,861 $ 358,530 $ 3,253,708 $ 9,239,894 $ 806,462 $ 599,128 $ 37,858,355<br />
2004 6,354,247<br />
- 10,980,848 9,100,608 455,009 3,599,485 7,283,124 (1) 920,928 1,055,205 39,749,454<br />
2005 7,230,082 8,644,834 (2) 12,527,514 11,753,794 519,193 3,791,546 3,478,877 (2) 1,059,009 1,391,200 50,396,049<br />
2006 11,930,618 12,068,070 13,811,740 11,317,841 (3) 582,307 4,142,646 1,275,342 1,240,764 1,548,205 57,917,533<br />
2007 14,022,135 14,150,000 15,463,291 13,116,271 586,383 4,349,870<br />
943,313 1,315,039<br />
972,995 (4) 64,919,297<br />
2008 14,361,253 16,728,600 15,186,616 11,694,525 593,009 4,478,698<br />
800,667 1,111,021<br />
575,003 65,529,392<br />
2009 12,790,196 16,791,078 15,081,286 10,202,384 497,936 4,997,024<br />
865,718 1,051,701<br />
598,084 62,875,407<br />
2010 9,917,734 13,703,197 15,358,341 9,298,296 535,775 4,757,920<br />
547,188<br />
961,303<br />
479,208 55,558,962<br />
2011 9,431,578 13,055,796 15,317,439 11,283,435 692,586 5,038,600<br />
887,331 1,053,145<br />
424,931 57,184,841<br />
Change<br />
2003 to 2011 65.00% (3) 100.00% (3) 58.00% (3) 38.00% (3) 93.00% 55.00% -90.00% 31.00% -29.00% 51.00%<br />
(1) In 2004 the State of California discontinued the back-fill of the Vehicle License Fee In-Lieu. At the same time the basis of the revenue stream was changed from a per<br />
capita calculation to the change in assessed valuations of property.<br />
(2) In 2005 the governor instituted the "triple-flip" which changed the funding source for Vehicle License Fees to the ERAF fund and changed the allocation of funds to cities<br />
from a per capita computation to the change in the assessed valuation of property. The foundation of the fee is not based on the tax rates established by the city and as such<br />
is not considered to be property tax. Because this revenue is under the control of the state it would be considered a "shared" revenue rather than an "own-source" revenue.<br />
(3) The decline in sales tax reported in FY 2006 is related to the implementation of the "Triple-Flip" and a take-back of revenues related to a change in the formula that was<br />
used to allocate funds to the cities. The amount of the take-back was $720,000.<br />
(4) Documentary Transfer Tax has declined since FY 2006. This decline is due to the combination of a decrease in the number of properties that transferred ownership and<br />
the decline in the value of properties being transferred.<br />
Source: City of <strong>Moreno</strong> <strong>Valley</strong> Finance Department
188<br />
City of <strong>Moreno</strong> <strong>Valley</strong><br />
Key Revenues, General Fund<br />
Last Ten Fiscal Years<br />
2002 2003 2004 2005 2006 2007 2008 2009 2010 2011<br />
Utility Users Tax $ 9,078,814 $ 9,718,667 $ 10,980,848 $ 12,527,514 $ 13,811,740 $ 15,463,291 $ 15,186,616 $15,081,286 $15,358,341 $15,317,439<br />
Property Tax 5,192,833<br />
Property Tax In-Lieu of VLF -<br />
Vehicle License In-Lieu Fees 8,459,660<br />
Sales Tax 7,194,055<br />
Property Tax In-Lieu of Sales Tax -<br />
Development Services 4,186,830<br />
Notes:<br />
5,710,105<br />
-<br />
9,239,894<br />
8,171,861<br />
-<br />
5,478,729<br />
6,354,247<br />
-<br />
7,283,124<br />
9,100,608<br />
-<br />
7,992,934<br />
7,230,082<br />
8,644,834<br />
3,478,877<br />
8,696,776<br />
3,057,018<br />
10,968,374<br />
11,930,618<br />
12,068,070<br />
1,275,342<br />
8,623,390<br />
2,694,451<br />
12,592,569<br />
14,022,135<br />
14,150,000<br />
943,313<br />
9,472,304<br />
3,643,967<br />
12,976,965<br />
14,361,253<br />
16,728,600<br />
800,667<br />
7,942,982<br />
3,751,543<br />
12,790,196<br />
16,791,078<br />
865,718<br />
7,135,246<br />
3,067,138<br />
9,917,734<br />
13,703,197<br />
In late FY 2004 due to budget constraints the State of California discountinued the back-fill of the Vehicle In-Lieu fees which accounted for approximately two-thirds of the total amount<br />
paid to local government. In 2005 this "gap" amount was repaid to local agencies which for the City of <strong>Moreno</strong> <strong>Valley</strong> amounted to $2,547,036.<br />
9,092,514<br />
7,442,475<br />
547,188<br />
6,952,123<br />
2,346,173<br />
5,243,215<br />
9,431,578<br />
13,055,796<br />
The FY 03/04 State of California budget withheld a portion of the Vehicle License Fee backfill owed to cities. Under the terms of the borrowing the Vehicle License Fee gap loan, as it was<br />
known, was to be repaid in FY 06/07. The City of <strong>Moreno</strong> <strong>Valley</strong>, along with a number of other cities, sold the rights to the receivable to a third party, California Communities, in order to<br />
receive the cash on a more timely basis. The agreement resulted in the city receiving a discounted amount or $2,347,317 of the original receivable amount of $2,547,036 in FY 04/05.<br />
In FY 2005 in order to provide collateral for the Budget Deficit Bonds the State of California began withholding twenty five percent of the city's sales tax and replaced it with a like amount<br />
from the ERAF fund. This switch was one of the components of the "Triple-flip" and unlike the switch of vehicle license fees, which is permanent, only lasts until the bonds are repaid or<br />
mature.<br />
Source: City of <strong>Moreno</strong> <strong>Valley</strong> Finance Department<br />
887,331<br />
8,113,635<br />
3,169,800<br />
4,746,772
189<br />
City of <strong>Moreno</strong> <strong>Valley</strong><br />
Assessed Value and Estimated Actual Value of Taxable Property<br />
Last Ten Fiscal Years<br />
(in thousands of dollars)<br />
Fiscal Year<br />
Ended June 30, Secured Value<br />
Unsecured<br />
Value<br />
Total Assessed and<br />
Estimated Full Value<br />
Less:<br />
Exemptions<br />
Taxable Direct Tax<br />
Assessed Value Rate Secured Value<br />
Unsecured<br />
Value<br />
Total Assessed and<br />
Estimated Full Value<br />
Less:<br />
Exemptions<br />
Taxable<br />
Assessed Value<br />
2002 $ 5,652,986 $ 147,086 $ 5,800,072 $ (96,346) $ 5,703,726 0.00133 $ 1,073,616 $ 91,783 $ 1,165,399 $ (23,802) $ 1,141,597 0.00472 0.00189<br />
2003 6,303,862 146,028<br />
6,449,890 (102,466) 6,347,424 0.00131 1,205,730 81,997<br />
1,287,727 (28,489) 1,259,238 0.00483 0.00189<br />
2004 7,323,326 144,893<br />
7,468,219 (94,858) 7,373,361 0.00124 1,382,232 86,290<br />
1,468,522 (28,117) 1,440,405 0.00517 0.00188<br />
2005 9,182,553 154,604<br />
9,337,157 (109,759) 9,227,398 0.00116 1,643,835 82,341<br />
1,726,176 (34,169) 1,692,007 0.00572 0.00187<br />
2006 11,327,235 165,133<br />
11,492,368 (118,051) 11,374,317 0.00131 2,028,330 85,608<br />
2,113,938 (35,633) 2,078,305 0.00643 0.00210<br />
2007 13,419,168 198,776<br />
13,617,944 (147,891) 13,470,053 0.00140 2,546,327 109,685<br />
2,656,012 (47,345) 2,608,667 0.00672 0.00226<br />
2008 13,491,161 232,774<br />
13,723,935 (194,693) 13,529,242 0.00143 2,788,876 137,206<br />
2,926,082 (75,251) 2,850,831 0.00838 0.00264<br />
2009 13,132,444 243,521<br />
13,375,965 (154,973) 13,220,992 0.00131 2,229,290 117,596<br />
2,346,886 (72,232) 2,274,654 0.01045 0.00265<br />
2010 10,625,910 236,904<br />
10,862,814 (154,289) 10,708,525 0.00160 2,391,494 154,639<br />
2,546,133 (81,595) 2,464,538 0.00675 0.00256<br />
2011 10,516,338 238,786<br />
10,755,124 (227,178) 10,527,946 0.00164 2,375,549 157,430<br />
2,532,979 (81,830) 2,451,149 0.00575 0.00242<br />
Source: Riverside County Auditor/Controller<br />
Source: City of <strong>Moreno</strong> <strong>Valley</strong> Finance Department<br />
County of Riverside Auditor-Controller<br />
City Redevelopment Agency<br />
Note: In 1978 the voters of the State of California passed Proposition 13 which limited property taxes to a maximum rate of 1% based upon the assessed value of the property being taxed. Each year, the assessed value of the property<br />
may be increased by an "inflation factor" (limited to a maximum increase of 2%). With few exceptions, property is only reassessed at the time that it is sold to a new owner. At that point, the new assessed value is reassessed at the<br />
purchase price of the property sold. The assessed valuation data shown above represents the only data currently available with respect to the actual market value of taxable property and is subject to the limitations described above.<br />
Direct Tax<br />
Rate<br />
Total<br />
Direct Tax<br />
Rate
190<br />
City of <strong>Moreno</strong> <strong>Valley</strong><br />
Property Tax Rates<br />
Direct and Overlapping Governments<br />
Last Six Fiscal Years<br />
(per $100 of assessed value)<br />
Fiscal Year 2005-06 2006-07 2007-08 2008-09 2009-10 2010-11<br />
City Direct Rate: $0.00131 $0.00140 $0.00143 $0.00131 $0.00827 $0.00164<br />
Redevelopment Agency Direct Rate: 0.00643 0.00672 0.00838 0.01045 0.00830 0.00575<br />
Total Direct Tax Rate: 0.00210 0.00226 0.00264 0.00265 0.00828 0.00242<br />
Eastern Municipal Water Imp Dist U-13 0.01400 0.00900 0.00800 0.00000 0.03000 0.03000<br />
Metro Water Dist East-1301999 0.00520 0.00470 0.00450 0.00430 0.00430 0.00370<br />
<strong>Moreno</strong> <strong>Valley</strong> Unified School District 0.00000 0.02271 0.03066 0.03081 0.02660 0.03357<br />
Riverside Community College 0.01800 0.01800 0.01259 0.01254 0.01242 0.01499<br />
Total Tax Rate $0.16684 $0.17761 $0.19523 $0.21154 $0.22471 $0.22157<br />
NOTE:<br />
In 1978, California voters passed Proposition 13 which sets the property tax rate at a 1.00% fixed amount. This 1.00% is shared by all taxing agencies for which the subject<br />
property resides within. In addition to the 1.00% fixed amount, property owners are charged taxes as a percentage of assessed property values for the payment of the<br />
Metropolitan Water District bonds, the Eastern Municipal Water District bonds and the Riverside Community College bonds.<br />
Source: City of <strong>Moreno</strong> <strong>Valley</strong> Finance Department<br />
County of Riverside Auditor-Controller
City of <strong>Moreno</strong> <strong>Valley</strong><br />
Principal Property Tax Payers<br />
Current Year and Nine Years Ago<br />
Taxpayer<br />
Taxable<br />
Assessed Value Rank<br />
Percent of Total City<br />
Taxable Assessed Value<br />
Taxable<br />
Assessed Value Rank<br />
Percent of Total City<br />
Taxable Assessed Value<br />
Walgreen Company $ 143,140,920 1 1.36% $ -<br />
0.00%<br />
Ridge <strong>Moreno</strong> <strong>Valley</strong> 101,585,819<br />
Ross Dress for Less, Inc. 96,867,378<br />
Stonegate 552 78,812,770<br />
Broadstone at <strong>Valley</strong> View 73,233,000<br />
Kaiser Foundation Hospitals 56,956,844<br />
<strong>Moreno</strong> <strong>Valley</strong> Day Street Apartments 54,528,555<br />
Knickerbocker Properties, Inc 49,301,872<br />
Realty Associates Fund IX LP 47,042,983<br />
2250 Town Circle Holdings LLC 46,440,540<br />
2 0.96% -<br />
3 0.92% -<br />
4 0.75% -<br />
0.00%<br />
0.00%<br />
0.00%<br />
5 0.70% - 0.00%<br />
6 0.54% 0.00%<br />
7 0.52% - 0.00%<br />
8 0.47% - 0.00%<br />
9 0.45% - 0.00%<br />
10 0.44% - 0.00%<br />
Homart Newco Two, Inc 44,300,000<br />
PB MV -<br />
TSC -<br />
Sienna Pointe Apartments -<br />
May Department Stores -<br />
Atsugi Kokusai Kando Inc -<br />
Hemlock Properties -<br />
Dayton Hudson Corporation -<br />
J C Penney Properties -<br />
0.00% 24,400,000<br />
0.00% 24,015,267<br />
0.00% 18,124,234<br />
0.00% 17,722,060<br />
0.00% 15,702,994<br />
0.00% 14,807,164<br />
0.00% 14,323,153<br />
0.00% 13,567,268<br />
MVR Properties - 0.00% 13,379,990<br />
1 0.84%<br />
2 0.46%<br />
3 0.45%<br />
4 0.34%<br />
5 0.34%<br />
6 0.30%<br />
7 0.28%<br />
8 0.27%<br />
9 0.26%<br />
10 0.25%<br />
$ 747,910,681<br />
7.11% $ 200,342,130<br />
3.79%<br />
The amounts shown above include assessed value data for both the City and the Redevelopment Agency<br />
Source: Hdl Coren & Cone<br />
Fiscal Year 2010/11 Fiscal Year 2001/2002<br />
191
192<br />
City of <strong>Moreno</strong> <strong>Valley</strong><br />
Property Tax Levies and Collections<br />
Last Ten Fiscal Years<br />
Fiscal Year<br />
Ended June 30,<br />
Taxes Levied<br />
for the Fiscal<br />
Year<br />
Collected within the Fiscal<br />
Year of Levy<br />
Collections in Total Collections to Date<br />
Percent of Subsequent<br />
Percent of<br />
Amount Levy years<br />
Amount Levy<br />
2002 $ 21,302,107 $ 19,936,925 93.59% $ 11,514 $ 19,948,439 93.65%<br />
2003 22,594,477 22,876,331<br />
2004 26,353,337 24,884,530<br />
2005 28,865,321<br />
2006 30,426,678<br />
26,775,299<br />
32,347,436<br />
101.25% - 22,876,331<br />
94.43% 11,609 24,896,139<br />
92.76% 7,922<br />
106.31% 37,812<br />
2007 35,606,935 39,141,295 109.93% 64,980<br />
2008 41,349,349<br />
2009 36,524,643<br />
2010 31,875,985<br />
2011 30,099,696<br />
43,457,010<br />
41,165,168<br />
35,492,693<br />
33,658,226<br />
105.10% 104,898<br />
112.71% 119,943<br />
111.35% 80,963<br />
111.82% 55,108<br />
26,783,221<br />
32,385,248<br />
39,206,275<br />
43,561,908<br />
41,285,111<br />
35,573,656<br />
33,713,334<br />
The City began participating in the "Teeter Plan" in FY 1993-94 which resulted in a lower amount of subsequent delinquent tax collections.<br />
Note: Collections include supplemental tax receipts from the County that are not included in the taxes levied for the fiscal year.<br />
Source: County of Riverside Auditor-Controller<br />
City of <strong>Moreno</strong> <strong>Valley</strong> Finance Department<br />
101.25%<br />
94.47%<br />
92.79%<br />
106.44%<br />
110.11%<br />
105.35%<br />
113.03%<br />
111.60%<br />
112.01%
City of <strong>Moreno</strong> <strong>Valley</strong><br />
Direct and Overlapping Debt<br />
Fiscal Year 2010/11 Assessed Valuation $ 10,521,788,956<br />
Redevelopment Incremental Valuation 2,006,907,043<br />
Adjusted Assessed Valuation $ 8,514,881,913<br />
Total Debt % City's Share of<br />
OVERLAPPING TAX AND ASSESSMENT DEBT 6/30/2011 Applicable(1) Debt 6/30/11<br />
Metropolitan Water District $ 227,670,000 0.477% $ 1,085,986<br />
Eastern Municpal Water District I.D. No U-22 4,531,000 100. 4,531,000<br />
Riverside Community College District 236,720,387 14.766 34,954,132<br />
<strong>Moreno</strong> <strong>Valley</strong> Unified School District 44,163,521 92.260 40,745,264<br />
San Jacinto Unified School District 44,202,338 0.590 260,794<br />
Val Verde Unified School District 41,816,948 42.638 17,829,910<br />
<strong>Moreno</strong> <strong>Valley</strong> Unified School District Community Facilities District No. 88-1 9,185,000 100. 9,185,000<br />
<strong>Moreno</strong> <strong>Valley</strong> Unified School District Community Facilities District No. 2002-1 7,935,000 100. 7,935,000<br />
<strong>Moreno</strong> <strong>Valley</strong> Unified School District Community Facilities District No. 2003-1&2 10,810,000 100. 10,810,000<br />
<strong>Moreno</strong> <strong>Valley</strong> Unified School District Community Facilities District No. 2004-1 3,090,000 100. 3,090,000<br />
<strong>Moreno</strong> <strong>Valley</strong> Unified School District Community Facilities District No. 2004-2 5,465,000 100. 5,465,000<br />
<strong>Moreno</strong> <strong>Valley</strong> Unified School District Community Facilities District No. 2004-3 3,945,000 100. 3,945,000<br />
<strong>Moreno</strong> <strong>Valley</strong> Unified School District Community Facilities District No. 2004-5 4,940,000 100. 4,940,000<br />
<strong>Moreno</strong> <strong>Valley</strong> Unified School District Community Facilities District No. 2004-6 27,460,000 100. 27,460,000<br />
<strong>Moreno</strong> <strong>Valley</strong> Unified School District Community Facilities District No. 2005 2&3 15,295,000 100. 15,295,000<br />
Val Verde Unified School District Community Facilities Disctrict No. 98-1 25,500,000 100. 25,500,000<br />
Val Verde Unified School District Community Facilities Disctrict No. 2003-1 2,665,000 100. 2,665,000<br />
Eastern Municpal Water District Community Facilities District 12,245,000 100. 12,245,000<br />
City of <strong>Moreno</strong> <strong>Valley</strong> Community Facilities District No. 3 1,325,000 100. 1,325,000<br />
City of <strong>Moreno</strong> <strong>Valley</strong> Community Facilities District No. 5 5,835,000 100. 5,835,000<br />
City of <strong>Moreno</strong> <strong>Valley</strong> Community Facilities District No. 87-1 8,860,000 100. 8,860,000<br />
City of <strong>Moreno</strong> <strong>Valley</strong> Community Facilities District No. 87-1 and I.A. No. 1 3,470,000 100. 3,470,000<br />
TOTAL GROSS OVERLAPPING TAX AND ASSESSMENT DEBT<br />
Less: <strong>Moreno</strong> <strong>Valley</strong> Community Facilities District No. 3 & 87-1 (100% self-supporting<br />
$ 247,432,087<br />
from tax increment revenues) 10,185,000<br />
TOTAL NET OVERLAPPING TAX AND ASSESSMENT DEBT $ 237,247,087<br />
OVERLAPPING OTHER DEBT<br />
Riverside County General Fund Obligations $ 696,634,853 5.822% $ 40,558,081<br />
Riverside County Pension Obligations 366,945,000 5.822 21,363,538<br />
Riverside County Board of Education Certificates of Participation 6,170,000 5.822 359,217<br />
Mt. San Jacinto Community College District General Fund Obligations 12,215,000 0.018 2,199<br />
<strong>Moreno</strong> <strong>Valley</strong> Unified School District Certificates of Participation 20,460,000 92.260 18,876,396<br />
San Jacinto Unified School District Certificates of Participation 43,380,000 0.590 255,942<br />
Val Verde Unified School District Certificates of Participation 84,710,000 42.638 36,118,650<br />
City of <strong>Moreno</strong> <strong>Valley</strong> General Fund Obligations 77,200,000 100. 77,200,000 (1)<br />
TOTAL GROSS DIRECT AND OVERLAPPING GENERAL FUND DEBT $ 194,734,023<br />
Less: Riverside County self-supporting obligations 803,621<br />
TOTAL NET DIRECT AND OVERLAPPING GENERAL FUND DEBT $ 193,930,402<br />
GROSS COMBINED TOTAL DEBT 442,166,110<br />
NET COMBINED DEBT $ 431,177,489<br />
Notes:<br />
(1) Percentage of each overlapping agencies assessed valuation located within the boundaries of the city.<br />
(2) Excludes tax and revenue anticipation notes, enterprise revenue, mortgage revenue and tax allocation bonds and non-bonded capital lease obligations<br />
Ratios to FY 2010-11 Assessed Valuation:<br />
Total Gross Overlapping Tax and Assessment Debt 2.35%<br />
Total Net Overlapping Tax and Assessment Debt 2.25%<br />
Ratios to Adjusted Assessed Valuation:<br />
Combined Direct Debt ($77,200,000) 0.91%<br />
Gross Combined Total Debt 5.19%<br />
Net Combined Total Debt 5.06%<br />
State School Building Aid Repayable as of 6/30/11 $<br />
-<br />
AB: ($450)<br />
Source: California Municipal Statistics<br />
193<br />
$ (2)
194<br />
City of <strong>Moreno</strong> <strong>Valley</strong><br />
Legal Debt Margin<br />
Last Five Fiscal Years<br />
(dollars in thousands)<br />
Legal Debt Margin Calculation for Fiscal Year 2011<br />
Assessed Value $ 10,366,869<br />
Debt Limit (15% of assessed value) 1,555,030<br />
Debt applicable to limit:<br />
-<br />
Total net debt applicable to limit $ -<br />
Fiscal Year (1)<br />
2007 2008 2009 2010 2011<br />
Assessed Valuation (in thousands) $ 11,220,188 $ 13,374,229 $ 13,375,965 $ 10,862,814 $ 10,366,869<br />
Conversion percentage 25% 25% 25% 25% 25%<br />
Adjusted assessed valuation (in thousands) $ 2,805,047 $ 3,343,557 $ 3,343,991 $ 2,715,704 $ 2,591,717<br />
Debt limit percentage 15% 15% 15% 15% 15%<br />
Debt Limit (in thousands) $ 420,757 $ 501,534 $ 501,599 $ 407,356 $ 388,758<br />
Total net debt applicable to limit $ - $ - $ - $ - $ -<br />
Legal debt margin (in thousands) $ 420,757 $ 501,534 $ 501,599 $ 407,356 $ 388,758<br />
Total net debt applicable to the limit as a percentage of the debt limit $ - $ - $ - $ - $ -<br />
1) GASB 44 allowed for the implementation of historical reporting on a prospective basis. The City has elected to report historical data in this manner.<br />
Source: City of <strong>Moreno</strong> <strong>Valley</strong> Finance Department<br />
County of Riverside Auditor-Controller<br />
-
195<br />
City of <strong>Moreno</strong> <strong>Valley</strong><br />
Ratios of Outstanding Debt by Type<br />
Last Six Fiscal Years<br />
Governmental Activities<br />
Business-type<br />
Activities<br />
Fiscal Year Special Tax Certificates of Lease Revenue RDA Tax Notes and Governmental Lease Revenue Total Primary Percentage of Debt per<br />
Ended June 30 (2) Bonds Participation Bonds Allocation Bonds Other Activities Bonds Government Personal Income 1<br />
2006 $ 23,345,000 $ 7,115,000 $ 47,530,000 $ - $ 4,866,378 $ 82,856,378 $ 4,647,000 $ 87,503,378 2.75% 501<br />
2007 21,415,000 6,590,000 46,890,000 -<br />
2008 18,925,000 6,040,000 46,160,000 43,495,000<br />
2009 17,265,000 5,470,001 45,205,000 42,725,000<br />
2010 15,525,000 4,875,000 44,205,000 42,605,000<br />
2011 13,655,000 0 (3) 39,660,000 (3) 42,475,000<br />
Notes:<br />
1) These ratios are calculated using personal income and population for the prior year.<br />
4,696,689 79,591,689<br />
4,318,513 118,938,513<br />
6,849,487 117,514,488<br />
6,667,850 113,877,850<br />
12,301,668 (3) 108,091,668<br />
30,870,000<br />
30,870,000<br />
30,775,000<br />
30,285,000<br />
29,780,000<br />
2) GASB 44 allowed for the implementation of historical reporting on a prospective basis. The City has elected to report historical data in this manner.<br />
3) In Fiscal Year 2011 the City defeased the 1997 Lease Revevue Bonds and the 1997 City Hall COPs with private placement financing.<br />
Source: City of <strong>Moreno</strong> <strong>Valley</strong> Finance Department<br />
City of <strong>Moreno</strong> <strong>Valley</strong> Economic Development Department<br />
Riverside County Economic Development Agency<br />
State of California Department of Finance<br />
110,461,689<br />
149,808,513<br />
148,289,488<br />
144,162,850<br />
137,871,668<br />
Capita 1<br />
3.38% 612<br />
4.38% 815<br />
4.01% 796<br />
3.98% 765<br />
3.80% 706
196<br />
City of <strong>Moreno</strong> <strong>Valley</strong><br />
Ratio of Bonded Debt<br />
Last Six Fiscal Years<br />
Fiscal Year<br />
Ended Special Tax<br />
June 30, (2) Bonds<br />
2006 23,345,000<br />
Certificates of<br />
Participation<br />
7,115,000<br />
Lease Revenue<br />
Bonds<br />
47,530,000<br />
Total<br />
Governmental<br />
Activities<br />
77,990,000<br />
2007 21,415,000 6,590,000 46,890,000 74,895,000<br />
2008 18,925,000 6,040,000 46,160,000 71,125,000<br />
2009 17,265,000 5,470,001 45,205,000 67,940,001<br />
2010 15,525,000 4,875,000 44,205,000 64,605,000<br />
2011 13,655,000 -<br />
(3) 39,660,000 (3) 53,315,000<br />
General bonded debt is debt payable with governmental fund resources and general obligation bonds recorded in<br />
enterprise funds (of which the City has none).<br />
1) Assessed value has been used because the actual value of taxable property is not readily available in the State of<br />
California<br />
Percent of<br />
Assessed Value (1) Per Capita<br />
0.86% 447<br />
0.67% 415<br />
0.53% 387<br />
0.51% 365<br />
0.59% 343<br />
0.50% 273<br />
2) GASB 44 allowed for the implementation of historical reporting on a prospective basis. The City has elected to report historical data in this manner.<br />
3) In Fiscal Year 2011 the City defeased the 1997 Lease Revevue Bonds and the 1997 City Hall COPs with private placement financing.<br />
Data Source: City of <strong>Moreno</strong> <strong>Valley</strong> Finance Department
197<br />
City of <strong>Moreno</strong> <strong>Valley</strong><br />
Pledged Revenue Coverage<br />
Last Ten Years<br />
Community Facilities District No. 5 of the City of Towngate Community Facilities District No. 87-1, Towngate Community Facilities District No. 87-1, Improvement<br />
Community Facilities District No. 3, AutoMall Refinancing<br />
<strong>Moreno</strong> <strong>Valley</strong> (Stoneridge)<br />
2007 Special Tax Refunding Bonds<br />
No. 1 Special Tax Refunding Bonds<br />
Fiscal Year<br />
Ended<br />
Property Tax Debt Service Special Debt Service Property Tax Debt Service Special Property Tax Debt Service<br />
June 30, Special Tax Levy Increment Principal Interest Coverage Tax Levy Principal Interest Coverage Increment Principal Interest Coverage Tax Levy Increment Principal Interest Coverage<br />
2002 $ 1,029,290 $ 135,550 $ 200,000 $ 556,150 1.54 $ - $ - $ -<br />
$ - $ - $ -<br />
$ - $ - $ - $ -<br />
2003 1,074,499 114,766 465,000<br />
2004 1,067,950 145,265 515,000<br />
2005 1,121,094 116,871 575,000<br />
2006 1,189,465 73,700 640,000<br />
2007 1,179,479 108,986 710,000<br />
2008 1,088,427 190,425 785,000<br />
2009 1,212,713 103,026 865,000<br />
2010 1,173,443 185,125 950,000<br />
2011 78,021 96,489 1,045,000<br />
538,113<br />
507,300<br />
469,150<br />
426,625<br />
379,375<br />
327,050<br />
269,300<br />
205,775<br />
135,950<br />
Community Redevelopment Agency 2007 Tax Allocation Bonds<br />
Fiscal Year<br />
Ended<br />
Debt Service<br />
June 30, Property Tax Increment Principal Interest Coverage<br />
2008 $ 23,890,555 $ - $ 359,683 66.42<br />
2009 23,775,956 770,000 2,073,084 8.36<br />
2010 0 0 0<br />
2011 0 0 0<br />
1.19 -<br />
1.19 -<br />
1.19 -<br />
1.18 -<br />
1.18 -<br />
1.15 198,306<br />
1.16 344,701<br />
1.18 362,124<br />
0.15 376,005<br />
-<br />
-<br />
-<br />
-<br />
-<br />
-<br />
-<br />
15,000<br />
20,000<br />
1) The interest payment related to the CFD 5 - Stoneridge was paid from the capitalized interest account but in future years this will be paid from the special tax<br />
Data Source: City of <strong>Moreno</strong> <strong>Valley</strong> Finance Department<br />
City of <strong>Moreno</strong> <strong>Valley</strong> Community Redevelopment Agency<br />
City of <strong>Moreno</strong> <strong>Valley</strong> Special Districts<br />
-<br />
-<br />
-<br />
-<br />
-<br />
217,261<br />
288,613<br />
288,313<br />
287,613<br />
0.91 2,072,568<br />
1.19 1,164,131<br />
1.19 373,011<br />
1.22 1,168,536<br />
-<br />
-<br />
-<br />
-<br />
-<br />
-<br />
-<br />
-<br />
-<br />
-<br />
-<br />
575,000<br />
600,000<br />
630,000<br />
-<br />
-<br />
-<br />
-<br />
-<br />
226,176<br />
435,881<br />
409,381<br />
382,569<br />
-<br />
-<br />
-<br />
-<br />
-<br />
9.16 429,990<br />
1.15 108,706<br />
0.37 78,519<br />
1.15 112,162<br />
-<br />
-<br />
-<br />
-<br />
-<br />
-<br />
287,228<br />
303,573<br />
277,359<br />
-<br />
-<br />
-<br />
-<br />
-<br />
220,000<br />
190,000<br />
195,000<br />
-<br />
-<br />
-<br />
-<br />
-<br />
- 60,994<br />
175,859<br />
168,029<br />
160,375<br />
0.00<br />
1.00<br />
1.07<br />
1.10
198<br />
City of <strong>Moreno</strong> <strong>Valley</strong><br />
Demographic and Economic Statistics<br />
Last five years<br />
Calendar<br />
Year Population (1)<br />
Personal Income<br />
(in thousands) (2)<br />
Per Capita<br />
Personal Income (2)<br />
Unemployment<br />
Rate (3), (A)<br />
2007 180,466 3,264,593 17,257 7.0%<br />
2008 183,860 3,423,011 17,997 9.9%<br />
2009 186,301 3,702,458 18,898 15.7%<br />
2010 188,537 3,836,808 19,230 17.6%<br />
2011 195,216 3,463,419 17,519 16.1%<br />
Source: 1- California Department of Finance<br />
2-City of <strong>Moreno</strong> <strong>Valley</strong> Economic Development Department<br />
3-California Employment Development Department<br />
A- This data is for the <strong>Moreno</strong> <strong>Valley</strong> area.
199<br />
City of <strong>Moreno</strong> <strong>Valley</strong><br />
Principal Employers<br />
Current Year and Two Years Ago<br />
Employer Sector Business Type<br />
March Air Reserve Base<br />
<strong>Moreno</strong> <strong>Valley</strong> Unified<br />
School District<br />
Riverside County<br />
Regional Medical Center<br />
Val Verde Unified School<br />
District (MV only)<br />
<strong>Moreno</strong> <strong>Valley</strong><br />
Mall/General Growth<br />
Ross Dress For Less/DD's<br />
Discounts<br />
City of <strong>Moreno</strong><br />
<strong>Valley</strong>/Police/Fire Depts<br />
Number of<br />
Employees<br />
Percent of<br />
Total<br />
Employment<br />
Number of<br />
Employees<br />
Percent of<br />
Total<br />
Employment<br />
Military/Public Sector Military Reserve Base 9,000 31.65% 9,000 26.67%<br />
Public Sector Public Schools 3,490 12.27% 3,752 11.12%<br />
Medical Facilities County Hospital 2,416 8.50% 2,215 6.56%<br />
Public Sector Public Schools 2,179 7.66% 734 2.18%<br />
Retail Retail Mall 1,760 6.19% 1,669 4.95%<br />
Distribution Retail Distribution 1,500 5.28% 600 1.78%<br />
Public Sector Municipal Government 762 2.68% 1,183 3.51%<br />
Walgreens Co. Distribution Retail Distribution 694 2.44% 650 1.93%<br />
Skechers USA Distribution Retail Distribution 550 1.93% 0 0.00%<br />
<strong>Moreno</strong> <strong>Valley</strong> College Public Sector Higher Education 510 1.79% 1,038 3.08%<br />
"Total Employment" as used above represents the total employment of all employers located within City limits.<br />
Source: City of <strong>Moreno</strong> <strong>Valley</strong> Economic Development Department<br />
Note: The city implemented the GASB 34 reporting model in Fiscal Year 2003. Information prior to the implementation of GASB 34 is not available.<br />
2011<br />
2009
City of <strong>Moreno</strong> <strong>Valley</strong><br />
Full-time and Part-time City Employees by Function<br />
Past Six Years<br />
Function 2006 2007 2008 2009 2010 2011<br />
General Government 143 153 150 142 150 147<br />
Public Works 126 134 141 151 146 143<br />
Community Development 71 74 74 72 68 59<br />
Parks and Community<br />
Services<br />
123 184 (2) 240 238 453 101 (3)<br />
Animal Services 24 26 27 29 27 21<br />
Redevelopment Agency 17 17 18 16 14 12<br />
Public Safety (1) 329 356 383 393 415 407<br />
Total 833 944 1,033 1,041 1,273 890<br />
This data represents a count of people employed by the City not the number of approved full time equivalents.<br />
(1) The City contracts with the County of Riverside for Police and Fire services<br />
(2) In 2007 the Parks and Community Services Department received a grant from the State of California related to the After School<br />
Education and Safety Grant. This grant resulted in an increase in staffing to achieve the grant growth objectives.<br />
(3) In 2011 the Parks and Community Services Department received a grant from the State of California related to the After School<br />
Education and Safety Grant, however staffing for this services was contracted to an outside agency. This resulted in a large decrease in<br />
staffing<br />
Note: GASB 44 allowed for the implementation of historical reporting on a prospective basis. The City has elected to report historical data in this manner.<br />
Source: City of <strong>Moreno</strong> <strong>Valley</strong> Finance Department<br />
200
City of <strong>Moreno</strong> <strong>Valley</strong><br />
Capital Asset Statistics<br />
Last Five Fiscal Years<br />
2007 2008 2009 2010 2011<br />
Lane miles of streets 1,127 1,076 1,076 1,076 1,076<br />
Number of street lights 10,710 11,027 11,037 11,046 11,260<br />
Number of traffic signals 148 162 167 170 173<br />
Fire protection:<br />
Number of stations 6 6 6 6 6<br />
Police protection:<br />
Number of policing stations 3 5 5 5 5<br />
Recreation and culture:<br />
Parks 36 38 39 37 37<br />
Maintained acreage of parks 519.94 529.55 531.48 531.48 531.66<br />
Parks under construction 6 7 6 6 1<br />
Acreage of parks under construction 19.97 27.07 25.14 25.14 12.25<br />
Multi-use athletic fields 21 21 21 21 21<br />
Conference/Recreation centers 1 1 1 1 1<br />
Square footage of recreation centers 42,413 42,413 42,413 42,413 42,413<br />
Senior Centers 1 1 1 1 1<br />
Square footage of senior centers 14,700 14,700 14,700 14,700 14,700<br />
Equestrian centers 1 1 1 1 1<br />
Maintained acreage of equestrian centers 45 45 45 45 45<br />
Multi-use equestrian trails maintained 10 Miles 10 Miles 10 Miles 10 Miles 10 Miles<br />
Community centers 4 4 4 4 4<br />
Square footage of community centers 38,758 38,758 38,758 38,758 38,758<br />
Sports courts 44 44 44 44 44<br />
Skate parks/Roller hockey rinks 1 1 1 1 1<br />
Square footage of skate parks 850 850 850 850 850<br />
Nine-hole golf courses 1 1 1 1 1<br />
Play apparatus 23 23 24 26 26<br />
Water play features 2 2 2 2 2<br />
Utilities:<br />
Residential utility meters 4,229 4,702 4,802 4,904 5,003<br />
Commercial utility meters 383 499 565 545 599<br />
1) GASB 44 allowed for the implementation of historical reporting on a prospective basis. The City has elected to report historical data in this manner.<br />
201
City of <strong>Moreno</strong> <strong>Valley</strong><br />
Operating Indicators by Function<br />
Last Five Fiscal Years<br />
2007 2008 2009 2010 2011<br />
Square mileage of area<br />
Fire protection:<br />
Provided by the County of Riverside in cooperation with the<br />
State Department of Forestry and Fire:<br />
51 52 52 52 52<br />
Sworn personnel 72 85 81 80 79<br />
Volunteers 30 25 25 25 10<br />
Non-sworn personnel 13 10 8 8 8<br />
Responses to emergency calls 12,525 13,011 12,971 13,530 15,268<br />
Inspections and Permits 4,834 4,269 3,522 2,369 3,383<br />
Plan checks 1,445 1,482 664 424 358<br />
Counter/Public inquires<br />
Police protection:<br />
Provided through contract with the County of Riverside<br />
Sheriff's Department:<br />
8,264 7,932 7,249 2,734 2,452<br />
Sworn officers 174 188 186 184 186<br />
Classified personnel 49.5 56 55 54 55<br />
City support personnel 3.5 4 3 3 3<br />
Volunteers<br />
Responses to Calls:<br />
25 39 56 62 77<br />
Priority 1 891 429 572 519 423<br />
Priority 1A 1,210 1,271 1,110 1,181 1,274<br />
Priority 2 25,046 24,819 24,967 24,938 27,797<br />
Priority 3 25,295 24,859 26,466 24,800 27,487<br />
Priority 4 17,304 16,932 17,592 16,630 18,625<br />
Priority 5 276 2 91 1 1<br />
Priority 6 0 0 0 0 0<br />
Priority 7 0 0 0 0 0<br />
Priority 8 0 0 0 0 1<br />
Priority 9 76 174 248 279 312<br />
Cancelled 6,826 5,983 5,359 5,222 5,543<br />
Disp/Arr Time Missing 9,841 9,437 8,540 7,638 7,944<br />
Same Disp/Arr Time 49,490 50,516 60,510 54,645 54,379<br />
T. R. U. Calls<br />
Building and Safety:<br />
54 32 43 32 37<br />
Building permits issued 3,363 2,413 2,058 1,645 1,700<br />
Counter requests for service<br />
Planning:<br />
12,276 11,249 8,922 6,611 6,105<br />
Planning applications processed 1,261 1,100 894 682 644<br />
Counter requests for service<br />
Recreation and culture:<br />
8,639 6,550 4,669 3,875 3,683<br />
Rounds of golf played 14,008 12,000 6,123 6,638 9,719<br />
Facility rentals 1,302 971 893 1,026 1,005<br />
Participants in recreation programs 64,006 57,139 46,075 46,561 46,040<br />
Utilities:<br />
Average residential daily consumption (kilowatt hours) 19.2 18 19.8 18.5 18.5<br />
Average commercial daily consumption (kilowatt hours) 396.0 171 254.8 284.4 296.3<br />
New residential connections 1,033 473 123 93 99<br />
New commercial connections 78 118 65 5 54<br />
Employees:<br />
Members of City Council 5 5 5 5 5<br />
Members of the Planning Commission 7 7 7 7 7<br />
Full-time career status (FTE) 388 406 324 312 283<br />
Part-time career status (FTE) 15 18 14 29 21<br />
3) GASB 44 allowed for the implementation of historical reporting on a prospective basis. The City has elected to report historical data in this manner.<br />
202
Community<br />
Redevelopment Agency<br />
of the City of <strong>Moreno</strong> <strong>Valley</strong><br />
<strong>Financial</strong> Statements<br />
Year Ended June 30, 2011<br />
(with independent Auditors’ <strong>Report</strong> Thereon)
COMMUNITY REDEVELOPMENT AGENCY OF THE<br />
CITY OF MORENO VALLEY, CALIFORNIA<br />
FINANCIAL STATEMENTS<br />
YEAR ENDED JUNE 30, 2011
FINANCIAL SECTION<br />
INDEPENDENT AUDITOR’S REPORT<br />
COMMUNITY REDEVELOPMENT AGENCY OF THE<br />
CITY OF MORENO VALLEY, CALIFORNIA<br />
YEAR ENDED JUNE 30,2011<br />
TABLE OF CONTENTS<br />
<strong>Financial</strong> Audit ......................................................................................................................................... 1<br />
Compliance Audit .................................................................................................................................... 3<br />
BASIC FINANCIAL STATEMENTS<br />
Government-Wide <strong>Financial</strong> Statements:<br />
Statement of Net Assets ............................................................................................................ 5<br />
Statement of Activities ................................................................................................................ 6<br />
Fund <strong>Financial</strong> Statements:<br />
Page<br />
Number<br />
Governmental Funds Balance Sheet ......................................................................................... 7<br />
Reconciliation of the Balance Sheet of Governmental Funds<br />
to the Statement of Net Assets .................................................................................................. 8<br />
Governmental Funds Statement of Revenues, Expenditures and Changes in<br />
Funds Balances ......................................................................................................................... 9<br />
Reconciliation of the Statement of Revenues, Expenditures and<br />
Changes in Fund Balances of Governmental Funds to the Statement of Activities ................ 10<br />
Notes to the <strong>Financial</strong> Statements.................................................................................................. 11<br />
SUPPLEMENTARY INFORMATION<br />
Governmental Funds Combining Balance Sheet ........................................................................... 24<br />
Governmental Funds Combining Statement of Revenues, Expenditures and<br />
Changes in Fund Balances ............................................................................................................ 26<br />
Computation of Low and Moderate Income Housing Funds Excess/Surplus ................................ 28
Brandon W. Burrows, CPA<br />
David E. Hale, CPA, CFP<br />
A Professional Corporation<br />
Donald G. Slater, CPA<br />
Richard K. Kikuchi, CPA<br />
Susan F. Matz, CPA<br />
Shelly K. Jackley, CPA<br />
Bryan S. Gruber, CPA<br />
INDEPENDENT AUDITOR'S REPORT<br />
To the Honorable Chair and Members of the Governing Board<br />
Community Redevelopment Agency of the City of <strong>Moreno</strong> <strong>Valley</strong><br />
<strong>Moreno</strong> <strong>Valley</strong>, California<br />
We have audited the accompanying financial statements of the governmental activities, each major fund,<br />
and the aggregate remaining fund information of the Community Redevelopment Agency of the City of<br />
<strong>Moreno</strong> <strong>Valley</strong> (Agency), a component unit of the City of <strong>Moreno</strong> <strong>Valley</strong>, California, as of and for the year<br />
ended June 30, 2011, which collectively comprise the Agency's basic financial statements as listed in the<br />
table of contents. These financial statements are the responsibility of the Agency's management. Our<br />
responsibility is to express opinions on these financial statements based on our audit.<br />
We conducted our audit in accordance with auditing standards generally accepted in the United States of<br />
America and the standards applicable to financial audits contained in Government Auditing Standards,<br />
issued by the Comptroller General of the United States. Those standards require that we plan and<br />
perform the audit to obtain reasonable assurance about whether the financial statements are free of<br />
material misstatement. An audit includes examining, on a test basis, evidence supporting the amounts<br />
and disclosures in the financial statements. An audit also includes assessing the accounting principles<br />
used and the significant estimates made by management, as well as evaluating the overall financial<br />
statement presentation. We believe that our audit provides a reasonable basis for our opinion.<br />
In our opinion, the financial statements referred to above present fairly, in all material respects, the<br />
respective financial position of the governmental activities, each major fund, and the aggregate remaining<br />
fund information of the Agency, as of June 30, 2011, and the respective changes in financial position,<br />
thereof for the year then ended in conformity with accounting principles generally accepted in the United<br />
States of America.<br />
We would like to draw the reader’s attention to Note 9 – “California Redevelopment Agency Uncertainty”.<br />
The note provides information on two bills passed, AB1X26 and 27 which dissolve redevelopment<br />
agencies effective October 1, 2011 and provide an option to avoid dissolution by making certain defined<br />
payments.<br />
In accordance with Government Auditing Standards, we have also issued our report dated<br />
December 22, 2011, on our consideration of the Agency’s internal control over financial reporting and on<br />
our tests of its compliance with certain provisions of laws, regulations, contracts, and grant agreements<br />
and other matters. The purpose of that report is to describe the scope of our testing of internal control<br />
over financial reporting and compliance and the results of that testing, and not to provide an opinion on<br />
internal control over financial reporting or on compliance. That report is an integral part of an audit<br />
performed in accordance with Government Auditing Standards and should be considered in assessing<br />
the results of our audit.<br />
Our audit was conducted for the purpose of forming opinions on the financial statements that collectively<br />
comprise the Agency’s financial statements as a whole. The combining project area statements and<br />
computation of low and moderate income housing funds excess/surplus are presented for purposes of<br />
additional analysis and are not a required part of the financial statements. These are the responsibility of<br />
management and were derived from and relate directly to the underlying accounting and other records<br />
Lance, Soll & Lunghard, LLP 203 North Brea Boulevard Suite 203 Brea, CA 92821 TEL: 714.672.0022 Fax: 714.672.0331 www.lslcpas.com<br />
41185 Golden Gate Circle Suite 103 Murrieta, CA 92562 TEL: 951.304.2728 Fax: 951.304.3940
To the Honorable Chair and Members of the Governing Board<br />
Community Redevelopment Agency of the City of <strong>Moreno</strong> <strong>Valley</strong><br />
used to prepare the financial statements. The information has been subjected to the auditing procedures<br />
applied in the audit of the financial statements and certain additional procedures, including comparing and<br />
reconciling such information directly to the underlying accounting and other records used to prepare the<br />
financial statements or to the financial statements themselves, and other additional procedures in<br />
accordance with auditing standards generally accepted in the United States of America. In our opinion,<br />
the information is fairly stated in all material respects in relation to the financial statements as a whole.<br />
The Agency has not presented a management’s discussion and analysis that accounting principles<br />
generally accepted in the United States of America has determined is necessary to supplement, although<br />
not required to be part of, the basic financial statements.<br />
Brea, California<br />
December 22, 2011<br />
2
Brandon W. Burrows, CPA<br />
David E. Hale, CPA, CFP<br />
A Professional Corporation<br />
Donald G. Slater, CPA<br />
Richard K. Kikuchi, CPA<br />
Susan F. Matz, CPA<br />
Shelly K. Jackley, CPA<br />
Bryan S. Gruber, CPA<br />
INDEPENDENT AUDITOR’S REPORT ON COMPLIANCE<br />
AND INTERNAL CONTROL OVER COMPLIANCE<br />
To the Honorable Chair and Members of the Governing Board<br />
Community Redevelopment Agency of the City of <strong>Moreno</strong> <strong>Valley</strong><br />
<strong>Moreno</strong> <strong>Valley</strong>, California<br />
Compliance<br />
We have audited the Community Redevelopment Agency of the City of <strong>Moreno</strong> <strong>Valley</strong>’s (Agency)<br />
compliance with the California Health and Safety Code as required by Section 33080.1 for the year ended<br />
June 30, 2011. Compliance with the requirements referred to above is the responsibility of Agency’s<br />
management. Our responsibility is to express an opinion on Agency’s compliance based on our audit.<br />
We conducted our audit of compliance in accordance with auditing standards generally accepted in the<br />
United States of America; the standards applicable to financial audits contained in Government Auditing<br />
Standards, issued by the Comptroller General of the United States; and the Guidelines for Compliance<br />
Audits of California Redevelopment Agencies, June 2011, issued by the State Controller and as<br />
interpreted in the Auditing Procedures for Accomplishing Compliance Audits of California Redevelopment<br />
Agencies, August 2011, issued by the Governmental Accounting and Auditing Committee of the California<br />
Society of Certified Public Accountants. Those standards require that we plan and perform the audit to<br />
obtain reasonable assurance about whether noncompliance with the compliance requirements referred to<br />
above that could have a material effect on redevelopment program has occurred. An audit includes<br />
examining, on a test basis, evidence about the Agency’s compliance with those requirements and<br />
performing such other procedures as we considered necessary in the circumstances. We believe that our<br />
audit provides a reasonable basis for our opinion. Our audit does not provide a legal determination of the<br />
Agency’s compliance with those requirements.<br />
In our opinion, the Agency complied, in all material respects, with the compliance requirements referred to<br />
above that are applicable to the redevelopment program for the year ended June 30, 2011. However, the<br />
results of our auditing procedures disclosed instances of noncompliance with those requirements that are<br />
required to be reported under Government Auditing Standards.<br />
<strong>Financial</strong> Disclosure and <strong>Report</strong>ing<br />
Redevelopment Agency Budget<br />
Per Health and Safety Code section 33606, the Agency is to adopt a budget for the fiscal<br />
year which includes a work program and goals for the coming year. Upon inspection of<br />
the fiscal year 2010-11 budget it was noted that document did not include a work<br />
program and goals for the year.<br />
Lance, Soll & Lunghard, LLP 203 North Brea Boulevard Suite 203 Brea, CA 92821 TEL: 714.672.0022 Fax: 714.672.0331 www.lslcpas.com<br />
41185 Golden Gate Circle Suite 103 Murrieta, CA 92562 TEL: 951.304.2728 Fax: 951.304.3940
To the Honorable Chair and Members of the Governing Board<br />
Community Redevelopment Agency of the City of <strong>Moreno</strong> <strong>Valley</strong><br />
Affordable Housing<br />
Planning and Administrative Expenditures<br />
The agency is required annually by Health and Safety Code section 33334.3[d] to<br />
prepare a written determination showing that planning and administrative expenditures<br />
charged in the Low and Moderate Income Housing Fund were necessary for the<br />
production, improvement, or preservation of low and moderate income housing.<br />
Although a written determination was prepared for the fiscal year 2010-11, there has<br />
been no council action to receive and approve this finding as of our audit contact.<br />
Internal Control Over Compliance<br />
Management of the Agency is responsible for establishing and maintaining effective internal control over<br />
compliance with the compliance requirements referred to above. In planning and performing our audit, we<br />
considered the Agency’s internal control over compliance to determine the auditing procedures for the<br />
purpose of expressing our opinion on compliance, but not for the purpose of expressing an opinion on the<br />
effectiveness of internal control over compliance. Accordingly, we do not express an opinion on the<br />
effectiveness of the Agency’s internal control over compliance.<br />
A deficiency in internal control over compliance exists when the design or operation of a control does not<br />
allow management or employees, in the normal course of performing their assigned functions, to prevent,<br />
or detect and correct, noncompliance on a timely basis. A material weakness in internal control over<br />
compliance is a deficiency, or combination of deficiencies in internal control over compliance, such that<br />
there is a reasonable possibility that material noncompliance with a compliance requirement will not be<br />
prevented, or detected and corrected, on a timely basis.<br />
Our consideration of internal control over compliance was for the limited purpose described in the first<br />
paragraph of this section and was not designed to identify all deficiencies in internal control that might be<br />
deficiencies, significant deficiencies, or material weaknesses in internal control over compliance. We did<br />
not identify any deficiencies in internal control over compliance that we consider to be material<br />
weaknesses, as defined above.<br />
This report is intended for the information of management, the Audit Committee, and the California State<br />
Controller and it is not intended to be and should not be used by anyone other then these specified<br />
parties.<br />
Brea, California<br />
December 22, 2011<br />
4
Governmental<br />
Activities<br />
Assets:<br />
Pooled cash and investments (note 3)<br />
Receivables:<br />
$ 51,063,099<br />
Accounts 48,685<br />
Notes and loans (note 4) 20,519,937<br />
Interest 471,543<br />
Due from other governments 529<br />
Land held for redevelopment 3,916,126<br />
Advances to the City of <strong>Moreno</strong> <strong>Valley</strong> 189,000<br />
Capital assets not being depreciated (note 5) 10,838,132<br />
Depreciable capital assets, net of accumulated depreciation (note 5) 17,216,260<br />
Total Assets 104,263,311<br />
Liabilities:<br />
Accounts payable 1,777,712<br />
Accrued liabilities 24,654<br />
Accrued interest payable on long-term debt 853,202<br />
Due to the City of <strong>Moreno</strong> <strong>Valley</strong> 9,378<br />
Due to other governments (note 8) 5,639,404<br />
Long-term liabilities (note 6):<br />
Due within one year 210,000<br />
Due in more than one year 78,222,152<br />
Total Liabilities 86,736,502<br />
Net Assets:<br />
Community Redevelopment Agency<br />
of the City of <strong>Moreno</strong> <strong>Valley</strong><br />
Statement of Net Assets<br />
June 30, 2011<br />
Invested in capital assets, net of related debt 9,983,312<br />
Restricted for low and moderate housing 32,304,849<br />
Restricted for debt service 1,217,367<br />
Unrestricted (deficit) (25,978,719)<br />
Total Net Assets $ 17,526,809<br />
See Notes to <strong>Financial</strong> Statements 5
Expenses<br />
Functions/Programs<br />
Governmental Activities:<br />
General government 1,442,219<br />
Community development 583,597<br />
Interest on long-term debt 5,531,791<br />
Community Redevelopment Agency<br />
of the City of <strong>Moreno</strong> <strong>Valley</strong><br />
Statement of Activities<br />
Year ended June 30, 2011<br />
Charges for<br />
Services<br />
Operating<br />
Contributions<br />
and Grants<br />
Net (Expenses)<br />
Revenues and<br />
Changes in Net<br />
Assets<br />
Capital<br />
Contributions<br />
and Grants Total<br />
$ $ - $ - $ - $ (1,442,219)<br />
-<br />
- 2,686,600 2,103,003<br />
-<br />
-<br />
- (5,531,791)<br />
Total Governmental Activities $ 7,557,607 $ - $ - $ 2,686,600 (4,871,007)<br />
Change in Net Assets<br />
Net Assets, Beginning of Year<br />
Net Assets, End of Year<br />
See Notes to <strong>Financial</strong> Statements 6<br />
Program Revenues<br />
Taxes:<br />
Tax increment (net of pass through payments)<br />
Property taxes<br />
Sales taxes<br />
Use of money and property<br />
Miscellaneous<br />
Transfers to the City of <strong>Moreno</strong> <strong>Valley</strong><br />
Total General Revenues and Transfers<br />
$<br />
7,057,989<br />
1,090,264<br />
994,015<br />
1,461,848<br />
159,106<br />
(1,740,815)<br />
9,022,407<br />
4,151,400<br />
13,375,409<br />
17,526,809
Community Redevelopment Agency<br />
of the City of <strong>Moreno</strong> <strong>Valley</strong><br />
Governmental Funds<br />
Balance Sheet<br />
June 30, 2011<br />
Debt Service<br />
Funds<br />
Low and<br />
Moderate<br />
Housing Debt Service Totals<br />
Project<br />
Assets:<br />
Pooled cash and investments (note 3)<br />
Receivables:<br />
$ 32,817,339 $ 8,173,443 $ 10,072,317 $ 51,063,099<br />
Accounts -<br />
48,685<br />
-<br />
48,685<br />
Notes and loans (note 4) - 20,519,937<br />
- 20,519,937<br />
Interest -<br />
471,543<br />
-<br />
471,543<br />
Due from other governments -<br />
-<br />
529<br />
529<br />
Land held for redevelopment 3,718,466<br />
197,660<br />
- 3,916,126<br />
Advances to other funds (note 7) - 3,386,697<br />
- 3,386,697<br />
Advances to the City of <strong>Moreno</strong> <strong>Valley</strong> -<br />
-<br />
189,000<br />
189,000<br />
Total Assets $ 36,535,805 $ 32,797,965 $ 10,261,846 $ 79,595,616<br />
Liabilities and Fund Balances:<br />
Liabilities:<br />
Accounts payable $ 1,765,185 $ 12,527 $ - $ 1,777,712<br />
Accrued liabilities 15,608<br />
9,046<br />
-<br />
24,654<br />
Due to other governments (note 8) -<br />
- 5,639,404 5,639,404<br />
Due to the City of <strong>Moreno</strong> <strong>Valley</strong> -<br />
-<br />
9,378<br />
9,378<br />
Deferred revenue -<br />
471,543<br />
9,000<br />
480,543<br />
Advances from other funds (note 7) -<br />
- 3,386,697 3,386,697<br />
Total Liabilities 1,780,793<br />
Fund Balances:<br />
Nonspendable for:<br />
Long-term receivables -<br />
Land held for redevelopment 3,718,466<br />
Advances -<br />
Restricted for:<br />
Low and moderate housing -<br />
Debt service -<br />
Assigned to:<br />
Capital projects 31,036,546<br />
Total Fund Balances 34,755,012<br />
<strong>Moreno</strong> <strong>Valley</strong><br />
Redevelopment Project<br />
Capital Projects Funds<br />
493,116<br />
20,519,937<br />
197,660<br />
3,386,697<br />
8,200,555<br />
-<br />
-<br />
32,304,849<br />
9,044,479<br />
-<br />
-<br />
189,000<br />
-<br />
1,028,367<br />
-<br />
1,217,367<br />
11,318,388<br />
20,519,937<br />
3,916,126<br />
3,575,697<br />
8,200,555<br />
1,028,367<br />
31,036,546<br />
68,277,228<br />
Total Liabilities & Fund Balances $ 36,535,805 $ 32,797,965 $ 10,261,846 $ 79,595,616<br />
See Notes to <strong>Financial</strong> Statements 7
Community Redevelopment Agency<br />
of the City of <strong>Moreno</strong> <strong>Valley</strong><br />
Reconciliation of the Balance Sheet of Governmental Funds<br />
to the Statement of Net Assets<br />
June 30, 2011<br />
Fund balances of governmental funds $ 68,277,228<br />
Amounts reported for governmental activities in the statement of net assets are different because:<br />
Capital assets, net of depreciation, used in governmental activities are not financial resources<br />
and, therefore, are not reported in the funds.<br />
Capital assets not being depreciated 10,838,132<br />
Depreciable capital assets, net of accumulated depreciation 17,216,260<br />
Revenues in the statement of activities that do not provided current financial resources are not<br />
reported as revenues in the statement of revenues, expenditures, and changes in fund balances.<br />
These revenues are reported as deferred revenue in the balance sheet of governmental funds. 480,543<br />
Accrued interest payable for the current portion of interest due on long-term liabilities<br />
are not reported in the funds. (853,202)<br />
Long-term liabilities are not due and payable in the current period and, therefore, are not reported<br />
in the funds. (78,432,152)<br />
Net assets of governmental activities $ 17,526,809<br />
See Notes to <strong>Financial</strong> Statements 8
Community Redevelopment Agency<br />
of the City of <strong>Moreno</strong> <strong>Valley</strong><br />
Governmental Funds<br />
Statement of Revenues, Expenditures<br />
and Changes in Fund Balances<br />
Year ended June 30, 2011<br />
Project<br />
Revenues:<br />
Taxes and assessments:<br />
Tax increment -<br />
Property taxes -<br />
Sales taxes -<br />
Use of money and property 640,578<br />
Miscellaneous 157,235<br />
Total Revenues 797,813<br />
Expenditures:<br />
Current:<br />
General government 595,865<br />
Community development<br />
Debt Service:<br />
8,119,944<br />
Principal retirement -<br />
Interest and fiscal charges -<br />
Pass-through agreement payments -<br />
SERAF payment -<br />
Total Expenditures 8,715,809<br />
Excess (Deficiency) of Revenues<br />
Over (Under) Expenditures (7,917,996)<br />
Other Financing Sources (Uses)<br />
Transfers in (note 7) 595,863<br />
Transfers out (note 7) -<br />
Long-term debt issued -<br />
Transfers to the City of <strong>Moreno</strong> <strong>Valley</strong> -<br />
Total Other Financing Sources (Uses) 595,863<br />
Net Change in Fund Balances (7,322,133)<br />
Fund Balances, Beginning of Year 42,077,145<br />
<strong>Moreno</strong> <strong>Valley</strong><br />
Redevelopment Project<br />
Capital Projects Funds<br />
Debt Service<br />
Funds<br />
Low and<br />
Moderate<br />
Housing Debt Service Totals<br />
$ $ 3,522,959 $ 14,091,836 $ 17,614,795<br />
- 1,090,264 1,090,264<br />
-<br />
994,015<br />
994,015<br />
197,807<br />
511,926 1,350,311<br />
1,871<br />
-<br />
159,106<br />
3,722,637<br />
648,225<br />
-<br />
-<br />
-<br />
-<br />
-<br />
648,225<br />
3,074,412<br />
-<br />
-<br />
-<br />
-<br />
-<br />
3,074,412<br />
29,230,437<br />
16,688,041<br />
198,129<br />
-<br />
23,760,636<br />
5,533,958<br />
9,474,228<br />
1,082,578<br />
40,049,529<br />
(23,361,488)<br />
-<br />
(595,863)<br />
2,397,749<br />
(1,740,815)<br />
61,071<br />
(23,300,417)<br />
24,517,784<br />
21,208,491<br />
1,442,219<br />
8,119,944<br />
23,760,636<br />
5,533,958<br />
9,474,228<br />
1,082,578<br />
49,413,563<br />
(28,205,072)<br />
595,863<br />
(595,863)<br />
2,397,749<br />
(1,740,815)<br />
656,934<br />
(27,548,138)<br />
95,825,366<br />
Fund Balances, End of Year $ 34,755,012 $ 32,304,849 $ 1,217,367 $ 68,277,228<br />
See Notes to <strong>Financial</strong> Statements 9
Community Redevelopment Agency<br />
of the City of <strong>Moreno</strong> <strong>Valley</strong><br />
Reconciliation of the Statement of Revenues, Expenditures and<br />
Changes in Fund Balances of Governmental Funds to the Statement of Activities<br />
June 30, 2011<br />
Net change in fund balances of governmental funds $ (27,548,138)<br />
Amounts reported for governmental activities in the statement of activities are different because:<br />
Governmental funds report capital outlay as expenditures. However, in the statement of<br />
activities the cost of these assets is allocated over their estimated useful lives and reported<br />
as depreciation expense. (581,285)<br />
Net book value of disposed assets. (125,983)<br />
Redevelopment projects that develop capital assets for the City of <strong>Moreno</strong> <strong>Valley</strong> are not<br />
recognized as assets of the Agency (construction in progress), but are reported as<br />
community development expenditures. 8,117,633<br />
Repayment of principal on long-term debt consumes current financial resources of<br />
governmental funds, but does not have any effect of net assets in the statement of activities. 26,447,236<br />
Accrued interest payable on long-term debt reported in the statement of activities does not<br />
require the use of current financial resources and, therefore, is not reported as an<br />
expenditure in governmental funds. 2,166<br />
Proceeds of long-term debt is revenue in the governmental funds, but these are additions<br />
to the statement of net assets. (2,397,749)<br />
Revenues in the statement of activities that do not provided current financial resources are not<br />
reported as revenues in the statement of revenues, expenditures, and changes in fund balances.<br />
These revenues are reported as deferred revenue in the balance sheet of governmental funds. 237,520<br />
Change in net assets of governmental activities $ 4,151,400<br />
See Notes to <strong>Financial</strong> Statements 10
COMMUNITY REDEVELOPMENT AGENCY<br />
CITY OF MORENO VALLEY<br />
NOTES TO FINANCIAL STATEMENTS<br />
JUNE 30, 2011<br />
Note 1: Organization and Summary of Significant Accounting<br />
a. Policies Description of the <strong>Report</strong>ing Entity<br />
The Community Redevelopment Agency of the City of <strong>Moreno</strong> <strong>Valley</strong>, California, is a<br />
component unit of a reporting entity that consists of the following primary and component<br />
units:<br />
<strong>Report</strong>ing Entity:<br />
Primary Government:<br />
City of <strong>Moreno</strong> <strong>Valley</strong><br />
Component Units:<br />
Community Redevelopment Agency of the City of <strong>Moreno</strong> <strong>Valley</strong><br />
Community Services District of the City of <strong>Moreno</strong> <strong>Valley</strong><br />
Community Facilities Districts No. 2 and No. 3<br />
Towngate Community Facilities District No. 87-1<br />
<strong>Moreno</strong> <strong>Valley</strong> Public Facilities Financing Corporation<br />
<strong>Moreno</strong> <strong>Valley</strong> Public Financing Authority<br />
Industrial Development Authority<br />
The attached basic financial statements contain information relative only to the<br />
Community Redevelopment Agency of the City of <strong>Moreno</strong> <strong>Valley</strong> as one component unit,<br />
which is an integral part of the total reporting entity. They do not contain financial data<br />
relating to the other component units.<br />
The Community Redevelopment Agency of the City of <strong>Moreno</strong> <strong>Valley</strong> (the Agency) was<br />
created by a City Council ordinance adopted on February 18, 1986. The Agency was<br />
established pursuant to the State of California Health and Safety Code, Section 33000,<br />
entitled Community Redevelopment Law. Its purpose is to prepare and carry out plans for<br />
the improvement, rehabilitation and redevelopment of blighted areas within the City of<br />
<strong>Moreno</strong> <strong>Valley</strong> (the City).<br />
Governmental Accounting Standards define the reporting entity as the primary<br />
government and those component units for which the primary government is financially<br />
accountable. <strong>Financial</strong> accountability is defined as appointment of a voting majority of the<br />
component unit’s board, and either: a) the primary government has the ability to impose<br />
its will, or b) the possibility that the component unit will provide a financial benefit to or<br />
impose a financial burden on the primary government. Since the City Council of the City<br />
of <strong>Moreno</strong> <strong>Valley</strong> also serves as the Governing Board of the Agency, the City, in effect,<br />
has the ability to influence and control operations. Therefore, the City has oversight<br />
responsibility for the Agency. Accordingly, in applying the criteria of Governmental<br />
Accounting Standards, the financial statements of the Agency are included in the City’s<br />
Comprehensive Annual <strong>Financial</strong> <strong>Report</strong>. There are no other entities that are considered<br />
to be component units of the Agency. The Agency has the same fiscal year end as the<br />
City and its financial statements can be obtained from the City Clerk.<br />
11
COMMUNITY REDEVELOPMENT AGENCY<br />
CITY OF MORENO VALLEY<br />
NOTES TO FINANCIAL STATEMENTS (CONTINUED)<br />
JUNE 30, 2011<br />
Note 1: Organization and Summary of Significant Accounting (Continued)<br />
b. Government-Wide and Fund <strong>Financial</strong> Statements<br />
The government-wide financial statements (i.e., the statement of net assets and the<br />
statement of changes in net assets) report information on all of the non-fiduciary activities<br />
of the primary government and its component units. For the most part, the effect of<br />
interfund activity has been removed from these statements. Governmental activities are<br />
normally supported by taxes and intergovernmental revenues. The primary government is<br />
reported separately from certain legally separate component units for which the primary<br />
government is financially accountable.<br />
The statement of activities demonstrates the degree to which the direct expenses of a<br />
given function or segment are offset by program revenues. Direct expenses are those<br />
that are clearly identifiable with a specific function or segment. Program revenues<br />
include: 1) charges to customers or applicants who purchase, use or directly benefit from<br />
goods, services or privileges provided by a given function or segment, and 2) grants and<br />
contributions that are restricted to meeting the operational or capital requirements of a<br />
particular function or segment. Taxes and other items not properly included among<br />
program revenues are reported instead as general revenues.<br />
Major individual governmental funds are reported as separate columns in the fund<br />
financial statements.<br />
c. Measurement Focus, Basis of Accounting and <strong>Financial</strong> Statement Presentation<br />
The government-wide financial statements are reported using the economic resources<br />
measurement focus and the accrual basis of accounting. Revenues are recorded when<br />
earned and expenses are recorded when a liability is incurred, regardless of the timing of<br />
related cash flows. Property taxes are recognized as revenues in the year for which they<br />
are levied. Grants and similar items are recognized as revenue as soon as all eligibility<br />
requirements imposed by the provider have been met.<br />
Governmental fund financial statements are reported using the current financial<br />
resources measurement focus and the modified accrual basis of accounting. Revenues<br />
are recognized as soon as they are both measurable and available. Revenues are<br />
considered to be available when they are collectible within the current period or soon<br />
enough thereafter to pay liabilities of the current period. For this purpose, the government<br />
considers revenues to be available if they are collected within 60 days of the end of the<br />
current fiscal period, while grant revenues have an availability period of 120 days.<br />
Expenditures generally are recorded when a liability is incurred, as under accrual<br />
accounting. However, debt service expenditures, as well as expenditures related to<br />
compensated absences and claims and judgments, are recorded only when payment is<br />
due.<br />
Property taxes, franchise taxes, licenses and interest associated with the current fiscal<br />
period are all considered to be susceptible to accrual and so have been recognized as<br />
revenues of the current fiscal period. Only the portion of special assessments receivable<br />
due within the current fiscal period is considered to be susceptible to accrual as revenue<br />
of the current period. All other revenue items are considered to be measurable and<br />
available only when cash is received by the government.<br />
12
COMMUNITY REDEVELOPMENT AGENCY<br />
CITY OF MORENO VALLEY<br />
NOTES TO FINANCIAL STATEMENTS (CONTINUED)<br />
JUNE 30, 2011<br />
Note 1: Organization and Summary of Significant Accounting (Continued)<br />
4. Capital Assets<br />
Capital assets, which include property, plant, equipment and infrastructure assets<br />
(e.g., roads, bridges, sidewalks and similar items), are reported in the governmental<br />
activities columns in the government-wide financial statements. Capital assets are<br />
defined by the government as assets with an initial individual cost of more than<br />
$5,000 (amount not rounded) and an estimated useful life in excess of one year.<br />
Such assets are recorded at historical cost or estimated historical cost if purchased<br />
or constructed. Donated capital assets are recorded at estimated fair market value at<br />
the date of donation.<br />
The costs of normal maintenance and repairs that do not add to the value of the<br />
asset or materially extend assets lives are not capitalized.<br />
Major outlays for capital assets and improvements are capitalized as projects are<br />
constructed.<br />
Property, plant and equipment are depreciated using the straight-line method over<br />
the following estimated useful lives:<br />
Assets Years<br />
Building and Improvements 5 - 50<br />
Furniture and Equipment 3 - 15<br />
Vehicles 3 - 10<br />
Infrastructure 25 -50<br />
In accordance with GASB Statement No. 34, the Agency is required to report general<br />
infrastructure assets.<br />
Buildings are depreciated using the straight-line method over the estimated useful life<br />
of 50 years.<br />
5. Deferred Revenue<br />
The government reports unearned revenue on its combined balance sheet. Deferred<br />
revenue arises when potential revenue does not meet both the “measurable” and<br />
“available” criteria for recognition in the current period. In subsequent periods, when<br />
both revenue recognition criteria are met, the liability for deferred revenue is removed<br />
from the balance sheet and revenue is recognized.<br />
6. Long-Term Obligations<br />
In the government-wide financial statements, long-term debt and other long-term<br />
obligations are reported as liabilities in the governmental activities statement of net<br />
assets.<br />
7. Salary Expenditures<br />
The Agency does not employ any personnel and relies on the City of <strong>Moreno</strong> <strong>Valley</strong><br />
(City) for administrative services. The financial statements include expenditures for<br />
salary and other benefits, which were allocated to the Agency by the City.<br />
14
COMMUNITY REDEVELOPMENT AGENCY<br />
CITY OF MORENO VALLEY<br />
NOTES TO FINANCIAL STATEMENTS (CONTINUED)<br />
JUNE 30, 2011<br />
Note 1: Organization and Summary of Significant Accounting (Continued)<br />
The Agency reports the following major governmental funds:<br />
The Project Capital Projects Fund accounts for the financing, construction and<br />
administrative activities of the Agency.<br />
The Low and Moderate Housing Capital Projects Fund accounts for 20% of tax<br />
increment set aside for low and moderate housing activities.<br />
The Debt Service Fund accounts for the accumulation of resources for the payment<br />
of interest and principal on long-term debt of the Agency.<br />
When both restricted and unrestricted resources are available for use, it is the<br />
government’s policy to use restricted resources first, and then unrestricted resources as<br />
they are needed.<br />
d. Assets, Liabilities and Net Assets or Equity<br />
1. Investments<br />
Investments for the Agency are reported at fair value. The State Treasurer’s<br />
Investment Pool operates in accordance with appropriate state laws and regulations.<br />
The reported value of the pool is the same as the fair value of the pool shares.<br />
2. Receivables and Payables<br />
Activity between funds that is representative of lending/borrowing arrangements<br />
outstanding at the end of the fiscal year is referred to as either “due to/from other<br />
funds” (i.e., the current portion of interfund loans) or “advances to/from other funds”<br />
(i.e., the non-current portion of interfund loans). All other outstanding balances<br />
between funds are reported as “due to/from other funds”.<br />
Advances between funds, as reported in the fund financial statements, are offset by a<br />
fund balance reserve account in applicable governmental funds to indicate that they<br />
are not available for appropriation and are not expendable available financial<br />
resources.<br />
All trade and property tax receivables are shown net of an allowance for<br />
uncollectibles.<br />
Property tax revenue attach as an enforceable lien on property as of January 1. All<br />
secured personal property taxes and one-half of the taxes on real property are due<br />
November 1; the second installment is due February 1. All taxes are delinquent, if<br />
unpaid, on December 10 and April 10, respectively. Unsecured personal property<br />
taxes become due on the first of March each year and are delinquent on August 31.<br />
The County of Riverside bills and collects the property taxes, and remits them to the<br />
Agency in installments during the year. Property taxes received within 60 days after<br />
the Agency’s fiscal year end are considered “measureable” and “available” and are<br />
accrued in the Agency’s financial statements.<br />
3. Prepaid Items<br />
Certain payments to vendors reflect costs applicable to future accounting periods and<br />
are recorded as prepaid items in both government-wide and fund financial<br />
statements.<br />
13
COMMUNITY REDEVELOPMENT AGENCY<br />
CITY OF MORENO VALLEY<br />
NOTES TO FINANCIAL STATEMENTS (CONTINUED)<br />
JUNE 30, 2011<br />
Note 1: Organization and Summary of Significant Accounting (Continued)<br />
8. Land Held for Redevelopment<br />
Land purchased for the purposes of resale (or contribution to a redevelopment<br />
project) is recorded at the Agency’s cost to purchase the property or, upon entering<br />
into a contract for sale, the estimated net realizable value, if lower.<br />
9. Fund Equity<br />
In the fund financial statements, government funds report the following fund balance<br />
classifications:<br />
Nonspendable include amounts that cannot be spent because they are either (a) not<br />
in spendable form or (b) legally or contractually required to be maintained intact.<br />
Restricted include amounts that are constrained on the use of resources by either<br />
(a) external creditors, grantors, contributors, or laws of regulations of other<br />
governments or (b) by law through constitutional provisions or enabling legislation.<br />
Committed include amounts that can only be used for specific purposes pursuant to<br />
constraints imposed by formal action of the government’s highest authority, the<br />
Governing Board. The formal action that is required to be taken to establish, modify,<br />
or rescind a fund balance commitment is a minute action or a resolution.<br />
Assigned include amounts that are constrained by the government’s intent to be used<br />
for specific purposes, but are neither restricted nor committed. The <strong>Financial</strong> and<br />
Administrative Services Director is authorized to assign amounts to a specific<br />
purpose, which was established by the governing body in a resolution.<br />
Unassigned include the residual amounts that have not been restricted, committed,<br />
or assigned to specific purposes.<br />
When an expenditure is incurred for purposes for which both restricted and<br />
unrestricted fund balance is available, the Agency considers restricted amounts to be<br />
used first, then unrestricted. When an expenditure is incurred for purposes for which<br />
amounts in any of the unrestricted fund balance classifications could be used, they<br />
are considered to be spent in the order as follows: committed, assigned and then<br />
unassigned.<br />
Note 2: Stewardship, Compliance and Accountability<br />
a. Budgetary Data<br />
General Budget Policies<br />
Budgets are legally adopted and formal budgetary integration is employed as a<br />
management control device during the year for all Governmental Fund types. From the<br />
effective date of the budget, the amounts stated therein as proposed expenditures<br />
become appropriations to the various Agency departments.<br />
15
COMMUNITY REDEVELOPMENT AGENCY<br />
CITY OF MORENO VALLEY<br />
NOTES TO FINANCIAL STATEMENTS (CONTINUED)<br />
JUNE 30, 2011<br />
Note 2: Stewardship, Compliance and Accountability (Continued)<br />
<strong>Report</strong>ed budget amounts represent the original legally adopted budget as amended.<br />
The City Council, acting as the Agency Board, may approve amendments to the budget<br />
during a regular meeting, providing that sufficient monies are available and that<br />
expenditures of proceeds of taxes will not be increased beyond the constitutional<br />
appropriations limit as imposed by Article XIIIB of the State Constitution.<br />
Individual fund budgets are, in all cases where appropriations are required, the same as<br />
the appropriation amounts. In the case of the Governmental Fund types, unexpended<br />
budgeted amounts, except for amounts relating to capital projects, lapse at the end of the<br />
budget year. Spending control for most funds is established by the amount of<br />
expenditures budgeted for each department within the fund, but management control is<br />
exercised at budgetary line item levels within the departments. Management can transfer<br />
budgeted amounts between operating programs, departments, or funds, provided that<br />
such transfers do not increase the overall budget. Appropriations that increase the<br />
budget require City Council, acting as the Agency Board, approval.<br />
Encumbrances<br />
Encumbrance accounting, under which purchase orders, contracts and other<br />
commitments for the expenditure of monies are recorded in order to reserve that portion<br />
of the applicable appropriation, is employed as an extension of formal budgetary<br />
integration in the governmental funds. Unexpended and unencumbered appropriations of<br />
the governmental funds automatically lapse at the end of the fiscal year. Encumbrances<br />
at year-end are a portion of the reserved fund balance and are reappropriated the<br />
following year.<br />
Budget Basis Accounting<br />
Budgets for governmental funds are adopted on a basis consistent with generally<br />
accepted accounting principles (GAAP).<br />
Note 3: Cash and Investments<br />
Cash and investments reported in the accompanying financial statements consisted of the<br />
following:<br />
Cash and investment pooled with the City $ 51,063,099<br />
The Agency’s funds are pooled with the City of <strong>Moreno</strong> <strong>Valley</strong>’s cash and investments in<br />
order to generate optimum interest income. The information required by GASB Statement<br />
No. 40 related to authorized investments, credit risk, etc. is available in the annual report of<br />
the City.<br />
16
COMMUNITY REDEVELOPMENT AGENCY<br />
CITY OF MORENO VALLEY<br />
NOTES TO FINANCIAL STATEMENTS (CONTINUED)<br />
JUNE 30, 2011<br />
Note 4: Notes and Loans Receivable<br />
Notes and Loans receivable of $20,519,937 consisted primarily of loans and advances to<br />
developers for various projects. A summary of amounts owed to the Agency at<br />
June 30, 2011 follows:<br />
Note 5: Capital Assets<br />
Cottonwood Properties $ 3,862,034<br />
Rancho Dorado 5,550,000<br />
Sheila Street Rehabilitation 2,651,875<br />
Oakwood 2,250,000<br />
RHDC Properties 1,866,557<br />
CVHC 1,639,450<br />
Ability First 824,917<br />
Bay Family Apartments 755,000<br />
Perris Isle 413,000<br />
Others 707,104<br />
Total $ 20,519,937<br />
A summary of changes in capital:<br />
Depreciable Assets:<br />
Buildings and Improvements<br />
12,191,837<br />
Furniture and Equipment<br />
352,837<br />
Infrastructure<br />
1,152,231<br />
Total Depreciable Assets 13,696,905<br />
Accumulated Depreciation:<br />
Buildings and Improvements<br />
2,193,543<br />
Furniture and Equipment<br />
317,552<br />
Infrastructure<br />
103,702<br />
Total Accumulated Depreciation 2,614,797<br />
Depreciable Assets, Net of Depreciation 11,082,108<br />
Balance<br />
July 1, 2010 Additions Deletions Transfers<br />
-<br />
-<br />
-<br />
-<br />
487,673<br />
70,567<br />
23,045<br />
581,285<br />
581,285<br />
-<br />
-<br />
-<br />
-<br />
-<br />
-<br />
-<br />
-<br />
-<br />
-<br />
-<br />
6,715,437<br />
6,715,437<br />
-<br />
-<br />
-<br />
-<br />
6,715,437<br />
Balance<br />
June 30, 2011<br />
Non- Depreciable Assets:<br />
Land<br />
$ 9,561,919 $ - $ 125,983 $ - $ 9,435,936<br />
Construction in Progress<br />
- 8,117,633<br />
- (6,715,437) 1,402,196<br />
Total Non-Depreciated Assets 9,561,919 8,117,633 125,983 (6,715,437) 10,838,132<br />
12,191,837<br />
352,837<br />
7,867,668<br />
20,412,342<br />
2,681,216<br />
388,119<br />
126,747<br />
3,196,082<br />
17,216,260<br />
Total Capital Assets, Net of Depreciation $ 20,644,027 $ 7,536,348 $ 125,983 $ - $ 28,054,392<br />
Depreciation expense was charged to functions/programs of the Agency as follows:<br />
Governmental Activities:<br />
Community development $<br />
581,285<br />
17
COMMUNITY REDEVELOPMENT AGENCY<br />
CITY OF MORENO VALLEY<br />
NOTES TO FINANCIAL STATEMENTS (CONTINUED)<br />
JUNE 30, 2011<br />
Note 6: Long–Term Liabilities<br />
A description of the Agency’s long-term liabilities outstanding is as follows:<br />
Note Payable, Price Company<br />
The Agency had recorded a long-term payable in the original amount of $2,433,744 under a<br />
development and disposition agreement and promissory note with Price Company for the<br />
reimbursement of costs of construction of a 130,000 square-foot-retail store. The note bears<br />
interest at 8% per annum and is payable solely from 50% of site-generated sales tax. Any<br />
remainder payable after September 2015 will be forgiven. The amount outstanding as of<br />
June 30, 2011 was $1,736,067.<br />
Long-Term Liabilities to the City of <strong>Moreno</strong> <strong>Valley</strong>:<br />
The Towngate Regional Mall notes (Sears Note), totaling $13,000,000, originated from a<br />
participation agreement (as amended) whereby the Agency acquired certain parcels within<br />
the mall for subsequent transfer to major tenants. The notes bear interest of 7.25% and are<br />
payable solely from available site-generated property tax increment and up to 50% of<br />
site-generated sales tax. Furthermore, the Agency had covenanted to use reasonable best<br />
efforts to refinance these notes with Tax Allocation Bonds, provided such financing is<br />
determined to be fiscally feasible. At June 30, 2011, accrued interest amounted to<br />
$2,200,727. During 2003-2004, the City purchased the rights to the notes from the holder.<br />
These amounts are now payable to the City and were previously reported in the Project Fund<br />
and are now reported as a long-term liability in the government-wide financial statements.<br />
In 2005, the Agency purchased improved property from the City – the Conference and<br />
Recreation Center. The purchase price was $14,203,946. The loan note was $11,503,946<br />
after the initial payment of $2,700,000. A subsequent principal payment of $29,124 was made<br />
in 2004-2005. The term is 20 years with 12% simple interest. The Agency will make partial<br />
interest only annual payments with a balloon payment due at the end of the term. At<br />
June 30, 2011, the outstanding principal and accrued interest balances are $11,474,822 and<br />
$6,596,258, respectively.<br />
The Agency owes the City a total of $652,248 in future sales tax revenue for funds borrowed<br />
to finance redevelopment activities. $518,520 represents monies borrowed during 2006-2007<br />
by the Agency. $133,728 represents monies borrowed during 2007-2008 by the Agency. The<br />
interest rate on the borrowings is 12% and repayment of the long-term payable is made when<br />
funds become available. At June 30, 2011, the outstanding accrued interest on these<br />
borrowings is $297,030.<br />
In November 2007, the Agency issued 2007 Series B, Subordinate Taxable Tax Allocation<br />
Bonds in the original issue amount of $22,500,000. These bonds were purchased by the City<br />
of <strong>Moreno</strong> <strong>Valley</strong>, but were defeased in 2010-11.<br />
A summary of amounts owed to the City at June 30, 2011 follows:<br />
Borrowing Purpose Principal Interest<br />
Towngate Regional Mall (Sears) $ 13,000,000 $ 2,200,727<br />
Conference and Recreation Center 11,474,822<br />
6,596,258<br />
Redevelopment 652,248<br />
297,030<br />
Total $ 25,127,070 $ 9,094,015<br />
18
COMMUNITY REDEVELOPMENT AGENCY<br />
CITY OF MORENO VALLEY<br />
NOTES TO FINANCIAL STATEMENTS (CONTINUED)<br />
JUNE 30, 2011<br />
Note 6: Long–Term Liabilities (Continued)<br />
2007 Tax Allocation Bonds, Series A<br />
In November 2007, the Agency issued 2007 Tax Allocation Bonds, Series A, in the original<br />
issue amount of $43,495,000 for the purpose of financing various redevelopment activities<br />
and other undertakings permitted under the Redevelopment Law, to fund a reserve for the<br />
bonds and to pay issuance costs. The bonds mature in serial and term fashion through<br />
August 1, 2038 and bear interest ranging from 3.5% to 5.0%. The bonds are subject to both<br />
optional and mandatory redemption prior to maturity beginning on August 1, 2017. The bonds<br />
are payable solely from Tax Increment Revenues and other funds and amounts pledged<br />
therefore pursuant to the Indenture. This issue is fully insured in the event of nonpayment by<br />
the Agency.<br />
Year Ending<br />
June 30 Principal Interest<br />
2011-2012 $ 210,000 $ 2,043,484<br />
2012-2013 220,000<br />
2,034,884<br />
2013-2014 230,000<br />
2,025,884<br />
2014-2015 230,000<br />
2,017,259<br />
2015-2016 235,000<br />
2,009,121<br />
2017-2021 1,290,000<br />
9,898,475<br />
2022-2026 6,415,000<br />
9,204,840<br />
2027-2031 10,040,000<br />
7,187,818<br />
2032-2036 13,655,000<br />
4,261,125<br />
2037-2041 9,950,000<br />
762,500<br />
$ 42,475,000 $ 41,445,390<br />
Annual maturities for certain balances of long-term debt have not been presented, as fixed<br />
maturities have not been established.<br />
The following is a schedule of changes in long term debt of the Agency for the fiscal year<br />
ended June 30, 2011:<br />
Balance<br />
Balance Due Within<br />
July 1, 2010 Additions Deletions June 30,2011 One Year<br />
Price Company Note $ 2,023,648 $ - $ 287,581 $ 1,736,067 $<br />
-<br />
City Loans - Principal 47,627,070<br />
- 22,500,000 25,127,070<br />
-<br />
City Loans - Unpaid Interest 10,225,921 2,397,749 3,529,655<br />
9,094,015<br />
-<br />
2007 Tax Allocation Bonds Series A 42,605,000<br />
- 130,000 42,475,000 210,000<br />
Total Long-Term Liabilities $ 102,481,639 $ 2,397,749 $ 26,447,236 $ 78,432,152 $ 210,000<br />
The deletions for City loans – unpaid interest includes $2,686,600 which was forgiven and<br />
does not appear in debt service principal payments on the statement of revenues,<br />
expenditures and changes in fund balances.<br />
19
COMMUNITY REDEVELOPMENT AGENCY<br />
CITY OF MORENO VALLEY<br />
NOTES TO FINANCIAL STATEMENTS (CONTINUED)<br />
JUNE 30, 2011<br />
Note 7: Interfund Receivables, Payables and Transfers<br />
Debt Service Requirements<br />
The Agency has pledged as security for tax allocation bonds it has issued a portion of the tax<br />
increment revenue that it receives. These bonds were to provide financing for various capital<br />
projects. The Agency has committed to appropriate each year from these resources amounts<br />
sufficient to cover the principal and interest requirements on the debt. Total principal and<br />
interest remaining on the debt is $83,920,390 with annual debt service requirements<br />
indicated above. For the current year, the total tax increment revenue recognized by the<br />
Agency was $17,614,795 and the debt service obligation on the bonds was $2,180,284.<br />
a. Advances to / from other funds<br />
Advances<br />
Receivable<br />
Advances<br />
Payable<br />
Funds<br />
Capital Projects Funds:<br />
Low and Moderate Housing $ 3,386,697 $ -<br />
Debt Service Funds:<br />
Tax Increment Fund -<br />
3,386,697<br />
Totals $ 3,386,697 $ 3,386,697<br />
In June 2007, the Low and Moderate Income Housing Capital Projects Fund advanced to<br />
the Tax Increment Debt Service Fund $4,157,976 to finance the purchase of certain<br />
properties. Repayments will be made annually in an amount equal to 5% of the principal<br />
balance. Interest payments will be made annually based on the Agency’s approximate<br />
average investment returns on monies. During the year, a principal payment of $178,247<br />
was made. The outstanding balance as of June 30, 2011 was $3,386,697.<br />
b. Transfers to / from other funds<br />
Funds<br />
Capital Projects Fund:<br />
Transfers In Transfers Out<br />
Net Transfers<br />
In (Out)<br />
Administration<br />
$ 595,863 $ - $ 595,863<br />
Total Projects and Administrations 595,863<br />
-<br />
595,863<br />
Debt Service Fund:<br />
Tax Increment<br />
-<br />
2007 TABs Series A<br />
2,185,030<br />
2007 TABs Series B<br />
348,672<br />
Total Debt Service 2,533,702<br />
Total Transfers In (Out)<br />
(3,129,565)<br />
-<br />
-<br />
(3,129,565)<br />
(3,129,565)<br />
2,185,030<br />
348,672<br />
(595,863)<br />
$ 3,129,565 $ (3,129,565) $<br />
-<br />
Transfers of $2,533,702 are eliminated in the consolidation of the debt service funds in<br />
order to arrive at the totals for the Statement of Revenues, Expenditures and Changes in<br />
Fund Balances, which provides net transfers in and out of $595,863. The detail shown<br />
above is displayed in the Combining Statement of Revenues, Expenditures and Changes<br />
in Fund Balances.<br />
20
COMMUNITY REDEVELOPMENT AGENCY<br />
CITY OF MORENO VALLEY<br />
NOTES TO FINANCIAL STATEMENTS (CONTINUED)<br />
JUNE 30, 2011<br />
Note 7: Interfund Receivables, Payables and Transfers (Continued)<br />
The Tax Increment Debt Service Fund transferred $595,863 to the Administration Capital<br />
Projects Fund to cover operating expenditures for the year.<br />
The Tax Increment Debt Service Fund transferred $2,185,030 and $348,672 to the<br />
2007 TABs Series A Debt Service Fund and the 2007 TABs Series B Debt Service Fund,<br />
respectively, to cover debt service expenditures for the year.<br />
Note 8: Commitments and Contingencies<br />
Riverside County Agreement<br />
During December 1987, the City of <strong>Moreno</strong> <strong>Valley</strong> and the Agency entered into an agreement<br />
with the County of Riverside to reimburse the County for the portion of tax increment the<br />
County would have been allocated and paid had there not been a redevelopment project<br />
adopted in the City. The Agency receives these amounts up to $7 million annually. The<br />
County will receive all annual tax increment in excess of $7 million until the total increment<br />
reaches $12 million and half of annual tax increment in excess of $12 million. When total tax<br />
increment paid to the County under this agreement from increments between $7 million and<br />
$12 million reaches $75 million, tax increment in excess of $7 million annually will be split<br />
equally between the Agency and County.<br />
During April 1988, the City of <strong>Moreno</strong> <strong>Valley</strong> and the Agency entered into an agreement with<br />
the Riverside County Flood Control and Water Conservation District (District) which specifies<br />
that the Agency shall receive 100% of the District share of the tax increment until such time<br />
the total tax increment exceeds $12 million at which time the District shall receive at least<br />
50% of its share.<br />
The Agency must annually demonstrate, on a project-by-project basis, that the cumulative<br />
project costs paid by the Agency for the project improvements exceed the cumulative total of<br />
District share received by the Agency. To the extent that the cumulative project costs paid by<br />
the Agency exceed the cumulative total of District share received by the Agency, the Agency<br />
will receive the balance needed from the remaining 50% of the District share.<br />
Beginning in 2004-2005 the Agency’s tax increment exceeded $12 million. The County<br />
deducts its proportionate share from the Agency’s remittances. The amount retained by the<br />
County is included shown as a reduction in tax revenue, “pass through agreement payments”<br />
in the financial statements. An additional amount of $5,639,404 for pass through agreements<br />
that have not yet been remitted is included in Due to Other Governments.<br />
Community Facilities District No. 3 Agreement<br />
In conjunction with the issuance of the <strong>Moreno</strong> <strong>Valley</strong> Auto Mall Special Tax Bonds Series<br />
2000 (Auto Mall Refinancing), the Agency and the City are parties to an owner participation<br />
agreement which provides that the Agency will transmit to the District the available property<br />
tax increment it receives on parcels within the District as a credit against the special parcel<br />
taxes that otherwise would be payable by the owners. Furthermore, the City has agreed to<br />
loan the Agency available sales tax generated within the District for payment directly to the<br />
parcel owners should the increment be insufficient to offset the special parcel taxes. In<br />
addition, the Agency has agreed to pay to the parcel owners, subject to certain restrictions,<br />
certain available surplus sales tax from within the District. The obligations to remit sales tax<br />
terminate by December 1, 2010.<br />
21
COMMUNITY REDEVELOPMENT AGENCY<br />
CITY OF MORENO VALLEY<br />
NOTES TO FINANCIAL STATEMENTS (CONTINUED)<br />
JUNE 30, 2011<br />
Note 8: Commitments and Contingencies (Continued)<br />
This agreement replaces a previous arrangement involving these parcels when they were<br />
included in Community Facilities District No. 2.<br />
The amounts remitted during the year under the replacement and previous agreement to<br />
parcel owners totaled $ 105,800.<br />
Community Facilities District No. 87-1 Agreement<br />
In connection with the issuance of the Community Facilities District No. 87-1 (CFD) Towngate<br />
2007 Special Tax Refunding Bonds, the Agency entered into an owner participation<br />
agreement whereby the Agency has committed tax increment for the payment of debt service<br />
requirements for these Bonds.<br />
Self-Insurance<br />
The Agency is exposed to various risks of loss related to torts, theft of, damage to, and<br />
destruction of assets, errors and omissions, and injuries to employees. The City of<br />
<strong>Moreno</strong> <strong>Valley</strong> established two self-insurance funds (internal service funds) to account for<br />
and finance its uninsured risks of loss. Under this program, the self-insurance funds provide<br />
coverage for up to a maximum of $300,000 for each workers’ compensation claim and<br />
$250,000 for each general liability claim. The City purchases commercial insurance for claims<br />
in excess of coverage provided by the funds and for all other risks of loss. Settled claims in<br />
excess of coverage provided by the funds and for all other risks of loss. Settled claims have<br />
not exceeded this commercial coverage in any of the past three years. All funds of the<br />
Agency participate in the program and make payments to the self-insurance funds based on<br />
actuarial estimates of the amounts needed to pay prior and current year claims.<br />
SERAF Shift<br />
In July 2009, the California Legislature enacted ABX4-26 provides for a Supplemental<br />
Educational Revenue Augmentation Funds (SERAF). Redevelopment agencies are<br />
collectively mandated to place $1.7 billion in fiscal year 2009-2010 and $350 million in<br />
2011-2012 The Agency’s share of the SERAF for fiscal year 2010-2011 is $1,082,578. The<br />
California Redevelopment Association is continuing to be actively engaged in litigation to<br />
invalidate ABX4-26.<br />
Note 9: California Redevelopment Agency Uncertainty<br />
On July 18, 2011, the California Redevelopment Association (“CRA”) and the League of<br />
California Cities (“League”) filed a petition for writ of mandate with the California Supreme<br />
Court, requesting the Court to declare unconstitutional two bills that were passed as part of<br />
the 2011-12 State Budget, AB1X 26 and 27. AB1X 26 dissolves redevelopment agencies<br />
effective October 1, 2011. AB1X 27, give redevelopment agencies an option to avoid<br />
dissolution if it commits to making defined payments for the benefit of the State, school<br />
districts and certain special districts. In 2011-12, these payments amount to a state-wide total<br />
of $1.7 billion. In 2012-13 and subsequent years, the payments total $400 million, annually.<br />
Each city or county’s share of these payments is determined based on its proportionate share<br />
of state-wide tax increment.<br />
22
COMMUNITY REDEVELOPMENT AGENCY<br />
CITY OF MORENO VALLEY<br />
NOTES TO FINANCIAL STATEMENTS (CONTINUED)<br />
JUNE 30, 2011<br />
Note 9: California Redevelopment Agency Uncertainty (Continued)<br />
CRA and the League contend that AB1X 26 and 27 are unconstitutional because they violate<br />
Proposition 22 which was passed by the voters in November, 2010. The effect of the<br />
legislation is to achieve a possible unconstitutional result, the use of redevelopment agencies’<br />
tax increment funds to benefit the State and other units of local government, by way of<br />
threatening of the dissolution of redevelopment agencies.<br />
Therefore, the CRA and the League have requested that the Court issue a stay, suspending<br />
the effectiveness of AB1X 26 and 27 until the Court can rule on its constitutionality. CRA and<br />
the League also asked the Court to expedite the briefing and hearing of the case so that a<br />
decision can be rendered by the Court before January 15, 2012, when the first payments are<br />
due. On August 11th, the California Supreme Court agreed to hear the case and granted a<br />
partial stay which was subsequently clarified.<br />
As of the time of the issuance of this report, the outcome of AB1X 26 and 27 upon the<br />
Agency is unknown and consequently the status and even future existence of the Agency is<br />
uncertain as such. In accordance with AB1X 27, the Agency has passed a resolution of<br />
intent to continue and will be required to make a payment to the State in the estimated<br />
amount of $6,122,305, by January 15, 2012 to avoid dissolution.<br />
Note 10: Subsequent Events<br />
Subsequent events are those events and transactions that occur after the end of the fiscal<br />
period but prior to issuance of the financial statements that are important for readers of the<br />
financial statements to be aware of. The Agency does not have any subsequent events to<br />
report.<br />
23
Community Redevelopment Agency<br />
of the City of <strong>Moreno</strong> <strong>Valley</strong><br />
Governmental Funds<br />
Combining Balance Sheet<br />
June 30, 2011<br />
2007 TABS,<br />
Series A Low and<br />
Administration Capital<br />
Capital Moderate<br />
Fund Projects Fund Projects Housing<br />
Assets:<br />
Pooled cash and investments (note 3)<br />
Receivables:<br />
$ 56,066 $ 161,245 $ 32,600,028 $ 8,173,443<br />
Accounts -<br />
-<br />
-<br />
48,685<br />
Notes and loans (note 4) -<br />
-<br />
- 20,519,937<br />
Interest -<br />
-<br />
- 471,543<br />
Due from other governments -<br />
-<br />
-<br />
-<br />
Land held for redevelopment - 3,718,466<br />
- 197,660<br />
Advances to other funds (note 7) -<br />
-<br />
- 3,386,697<br />
Advances to the City of <strong>Moreno</strong> <strong>Valley</strong> -<br />
-<br />
-<br />
-<br />
Total Assets $ 56,066 $ 3,879,711 $ 32,600,028 $ 32,797,965<br />
Liabilities and Fund Balances:<br />
Liabilities:<br />
Accounts payable $ 4,388 $ 78,789 $ 1,682,008 $ 12,527<br />
Accrued liabilities 6,897<br />
1,233<br />
7,478<br />
9,046<br />
Due to other governments (note 8) -<br />
-<br />
-<br />
-<br />
Due to the City of <strong>Moreno</strong> <strong>Valley</strong> -<br />
-<br />
-<br />
-<br />
Deferred revenue -<br />
-<br />
- 471,543<br />
Advances from other funds (note 7) - - - -<br />
Total Liabilities 11,285<br />
Fund Balances:<br />
Nonspendable for:<br />
Long-term receivables -<br />
Land held for redevelopment -<br />
Advances -<br />
Nonspendable for:<br />
Low and moderate housing -<br />
Debt service -<br />
Assigned to:<br />
Capital projects 44,781-<br />
Total Fund Balances 44,781<br />
<strong>Moreno</strong> <strong>Valley</strong><br />
Redevelopment Project<br />
Capital Projects Funds<br />
80,022<br />
-<br />
3,718,466<br />
-<br />
-<br />
-<br />
81,223-<br />
3,799,689<br />
1,689,486<br />
-<br />
-<br />
-<br />
-<br />
-<br />
30,910,542-<br />
30,910,542<br />
493,116<br />
20,519,937<br />
197,660<br />
3,386,697<br />
8,200,555<br />
-<br />
-<br />
32,304,849<br />
Total Liabilities & Fund Balances $ 56,066 $ 3,879,711 $ 32,600,028 $ 32,797,965<br />
24
Tax<br />
Increment<br />
Fund<br />
2007 TABS,<br />
Series A Debt<br />
Service<br />
2007 TABS,<br />
Series B Debt<br />
Service Totals<br />
$ 10,072,317 $ - $ - $ 51,063,099<br />
Assets:<br />
Pooled cash and investments (note 3)<br />
Receivables:<br />
-<br />
-<br />
-<br />
48,685 Accounts<br />
-<br />
-<br />
- 20,519,937 Notes and loans (note 4)<br />
-<br />
-<br />
-<br />
471,543 Interest<br />
529<br />
-<br />
-<br />
529 Due from other governments<br />
-<br />
-<br />
- 3,916,126 Land held for redevelopment<br />
-<br />
-<br />
- 3,386,697 Advances to other funds (note 7)<br />
189,000<br />
-<br />
-<br />
189,000 Advances to the City of <strong>Moreno</strong> <strong>Valley</strong><br />
$ 10,261,846 $ - $ - $ 79,595,616 Total Assets<br />
$ - $ - $ - $ 1,777,712<br />
Liabilities and Fund Balances:<br />
Liabilities:<br />
Accounts payable<br />
-<br />
-<br />
-<br />
24,654 Accrued liabilities<br />
5,639,404<br />
-<br />
- 5,639,404 Due to other governments (note 9)<br />
9,378<br />
-<br />
-<br />
9,378 Due to the City of <strong>Moreno</strong> <strong>Valley</strong><br />
9,000<br />
-<br />
-<br />
480,543 Deferred revenue<br />
3,386,697<br />
-<br />
- 3,386,697 Advances from other funds (note 7)<br />
9,044,479<br />
-<br />
-<br />
189,000<br />
-<br />
1,028,367<br />
-<br />
1,217,367<br />
Debt Service<br />
Funds<br />
-<br />
-<br />
-<br />
-<br />
-<br />
-<br />
-<br />
-<br />
-<br />
-<br />
-<br />
-<br />
-<br />
-<br />
-<br />
-<br />
11,318,388<br />
20,519,937<br />
3,916,126<br />
3,575,697<br />
8,200,555<br />
1,028,367<br />
31,036,546<br />
68,277,228<br />
Total Liabilities<br />
Fund Balances:<br />
Nonspendable for:<br />
Long-term receivables<br />
Land held for redevelopment<br />
Advances<br />
Restricted for:<br />
Low and moderate housing<br />
Debt service<br />
Assigned to:<br />
Capital Projects<br />
Total Fund Balances<br />
$ 10,261,846 $ - $ - $ 79,595,616 Total Liabilities & Fund Balances<br />
25
Revenues:<br />
Taxes and assessments:<br />
Community Redevelopment Agency<br />
of the City of <strong>Moreno</strong> <strong>Valley</strong><br />
Governmental Funds<br />
Combining Statement of Revenues, Expenditures<br />
and Changes in Fund Balances<br />
Year ended June 30, 2011<br />
Administration<br />
Fund<br />
Capital<br />
Projects Fund<br />
2007 TABS,<br />
Series A<br />
Capital<br />
Projects<br />
Low and<br />
Moderate<br />
Housing<br />
Tax increment $ - $ - $ - $ 3,522,959<br />
Property taxes -<br />
-<br />
-<br />
-<br />
Sales taxes -<br />
-<br />
-<br />
-<br />
Use of money and property -<br />
1,959<br />
638,619<br />
197,807<br />
Miscellaneous -<br />
155,687<br />
1,548<br />
1,871<br />
Total Revenues $ - $ 157,646 $ 640,167 $ 3,722,637<br />
Expenditures:<br />
Current:<br />
General government $ 595,865 $ - $ - $ 648,225<br />
Community development<br />
Debt Service:<br />
-<br />
63,082 8,056,862<br />
-<br />
Principal retirement -<br />
-<br />
-<br />
-<br />
Interest and fiscal charges -<br />
-<br />
-<br />
-<br />
Pass-through agreement payments -<br />
-<br />
-<br />
-<br />
SERAF payment -<br />
-<br />
-<br />
-<br />
Total Expenditures 595,865<br />
Excess (Deficiency) of Revenues<br />
Over (Under) Expenditures (595,865)<br />
Other Financing Sources (Uses)<br />
Transfers in (note 7) 595,863<br />
Transfers out (note 7) -<br />
Long-term debt issued -<br />
Transfers to the City of <strong>Moreno</strong> <strong>Valley</strong> -<br />
Total Other Financing Sources (Uses) 595,863<br />
Net Change in Fund Balances (2)<br />
Fund Balances, Beginning of Year 44,783<br />
<strong>Moreno</strong> <strong>Valley</strong><br />
Redevelopment Project<br />
Capital Projects Funds<br />
63,082<br />
94,564<br />
-<br />
-<br />
-<br />
-<br />
-<br />
94,564<br />
3,705,125<br />
8,056,862<br />
(7,416,695)<br />
-<br />
-<br />
-<br />
-<br />
-<br />
(7,416,695)<br />
38,327,237<br />
648,225<br />
3,074,412<br />
-<br />
-<br />
-<br />
-<br />
-<br />
3,074,412<br />
29,230,437<br />
Fund Balances, End of Year $ 44,781 $ 3,799,689 $ 30,910,542 $ 32,304,849<br />
26
Tax<br />
2007 TABS, 2007 Tabs,<br />
Increment Series A Debt Series B Debt<br />
Fund<br />
Service<br />
Service Totals<br />
$ 14,091,836 $ - $ - $ 17,614,795<br />
Revenues:<br />
Taxes and assessments:<br />
Tax increment<br />
1,090,264<br />
-<br />
- 1,090,264 Property taxes in lieu<br />
994,015<br />
-<br />
-<br />
994,015 Sales taxes<br />
511,924<br />
2<br />
- 1,350,311 Use of money and property<br />
-<br />
-<br />
-<br />
159,106 Miscellaneous<br />
$ 16,688,039 $ 2 $ - $ 21,208,491 Total Revenues<br />
$ 198,129 $ - $ - $ 1,442,219<br />
Expenditures:<br />
Current:<br />
General government<br />
-<br />
-<br />
- 8,119,944 Community development<br />
Debt Service:<br />
1,130,636<br />
130,000 22,500,000 23,760,636 Principal retirement<br />
3,130,254 2,055,032<br />
348,672 5,533,958 Interest and fiscal charges<br />
9,474,228<br />
-<br />
- 9,474,228 Pass-through agreement payments<br />
1,082,578<br />
-<br />
- 1,082,578 SERAF payment<br />
15,015,825<br />
1,672,214<br />
-<br />
(3,129,565)<br />
2,397,749<br />
(1,740,815)<br />
(2,472,631)<br />
(800,417)<br />
2,017,784<br />
Debt Service<br />
Funds<br />
2,185,032<br />
(2,185,030)<br />
2,185,030<br />
-<br />
-<br />
-<br />
2,185,030<br />
-<br />
-<br />
22,848,672<br />
(22,848,672)<br />
348,672<br />
-<br />
-<br />
-<br />
348,672<br />
(22,500,000)<br />
22,500,000<br />
49,413,563<br />
(28,205,072)<br />
3,129,565<br />
(3,129,565)<br />
2,397,749<br />
(1,740,815)<br />
656,934<br />
(27,548,138)<br />
95,825,366<br />
Total Expenditures<br />
Excess (Deficiency) of Revenues<br />
Over (Under) Expenditures<br />
Other Financing Sources (Uses)<br />
Transfers in (note 7)<br />
Transfers out (note 7)<br />
Long-term debt issued<br />
Transfers to the City of <strong>Moreno</strong> <strong>Valley</strong><br />
Total Other Financing Sources (Uses)<br />
Net Change in Fund Balances<br />
Fund Balances, Beginning of Year<br />
$ 1,217,367 $ - $ - $ 68,277,228 Fund Balances, End of Year<br />
27
Community Redevelopment Agency<br />
of the City of <strong>Moreno</strong> <strong>Valley</strong><br />
Computation of Low and Moderate<br />
Income Housing Funds Excess/Surplus<br />
June 30, 2011<br />
Low and Moderate Low and Moderate<br />
Housing Funds - All Project Areas Housing Funds - All Project Areas<br />
July 1, 2010 July 1, 2011<br />
Opening Fund Balance $ 29,230,437<br />
$ 32,304,849<br />
Less Unavailable Amounts<br />
Land held for redevelopment $ (197,660)<br />
$ (197,660)<br />
Long Term Loans Receivable (3,564,945)<br />
(3,386,697)<br />
Encumbrances (Section 33334.12 (g)(2)) (4,004,250)<br />
(750,000)<br />
Rehabilitation loans (17,567,422) (20,519,937)<br />
(25,334,277) (24,854,294)<br />
Available Low and Moderate Income Housing Funds 3,896,160<br />
Limitation (greater of $1,000,000 or four years set-aside<br />
Set-Aside for last four years<br />
2010 - 2011 $ -<br />
$ 3,522,959<br />
2009 - 2010 3,782,660<br />
3,782,660<br />
2008 - 2009 4,546,638<br />
4,546,638<br />
2007 - 2008 4,583,576<br />
4,583,576<br />
2006 - 2007 3,506,618<br />
-<br />
Total $ 16,419,492<br />
$ 16,435,833<br />
Base Limitation $ 1,000,000<br />
$ 1,000,000<br />
Greater amount 16,419,492<br />
7,450,555<br />
16,435,833<br />
Computed Excess/Surplus None None<br />
28
Community<br />
Services District<br />
City of <strong>Moreno</strong> <strong>Valley</strong>, C alifornia<br />
<strong>Financial</strong> Statements<br />
Year Ended June 30, 2011<br />
(with independent Auditors’ <strong>Report</strong> Thereon)
CITY OF MORENO VALLEY, CALIFORNIA<br />
COMMUNITY SERVICES DISTRICT<br />
FINANCIAL STATEMENTS<br />
YEAR ENDED JUNE 30, 2011<br />
(WITH INDEPENDENT AUDITOR’S REPORT THEREON)
FINANCIAL SECTION<br />
City of <strong>Moreno</strong> <strong>Valley</strong>, California<br />
Community Services District<br />
<strong>Financial</strong> Statements<br />
Year Ended June 30, 2011<br />
TABLE OF CONTENTS<br />
Page<br />
Number<br />
Independent Auditor’s <strong>Report</strong> .................................................................................................................. 1<br />
BASIC FINANCIAL STATEMENTS<br />
Government-Wide <strong>Financial</strong> Statements:<br />
Statement of Net Assets ................................................................................................................... 3<br />
Statement of Activities ....................................................................................................................... 4<br />
Fund <strong>Financial</strong> Statements:<br />
Balance Sheet – Governmental Funds ............................................................................................. 5<br />
Reconciliation of the Balance Sheet of Governmental Funds<br />
to the Statement of Net Assets ......................................................................................................... 7<br />
Statement of Revenues, Expenditures and Changes in<br />
Fund Balances – Governmental Funds ............................................................................................ 8<br />
Reconciliation of the Statement of Revenues, Expenditures and<br />
Changes in Fund Balances of Governmental Funds to the Statement of Activities ........................ 10<br />
Budget Comparison Statements:<br />
1. Zone L Library Services Fund ............................................................................................ 11<br />
2. Zone A Parks and Community Services ............................................................................. 12<br />
3. Zone E Extensive Landscaping Administration .................................................................. 13<br />
4. CFD #1 Fund ....................................................................................................................... 14<br />
Notes to <strong>Financial</strong> Statements ................................................................................................................ 15<br />
SUPPLEMENTARY INFORMATION<br />
Combining Balance Sheet – Nonmajor Governmental Funds ............................................................... 22<br />
Combining Statement of Revenues, Expenditures and Changes in Fund Balances – Nonmajor<br />
Governmental Funds .............................................................................................................................. 24<br />
Budget Comparison Schedules:<br />
A. Zone B Residential Street Lights Administration ....................................................................... 26<br />
B. Zone C Arterial Street Lights Administration ............................................................................. 27<br />
C. Zone D Standard Landscaping Administration .......................................................................... 28<br />
D. Zone M Median Fund ................................................................................................................ 29<br />
E. Zone S Sunnymead Boulevard Maintenance ............................................................................ 30
Brandon W. Burrows, CPA<br />
David E. Hale, CPA, CFP<br />
A Professional Corporation<br />
Donald G. Slater, CPA<br />
Richard K. Kikuchi, CPA<br />
Susan F. Matz, CPA<br />
Shelly K. Jackley, CPA<br />
Bryan S. Gruber, CPA<br />
Deborah A. Harper, CPA<br />
Board of Directors<br />
City of <strong>Moreno</strong> <strong>Valley</strong>, California<br />
Community Services District<br />
INDEPENDENT AUDITOR'S REPORT<br />
We have audited the accompanying financial statements of the governmental activities, each major fund,<br />
and the aggregate remaining fund information of the City of <strong>Moreno</strong> <strong>Valley</strong>, California, Community<br />
Services District (the District), as of and for the year ended June 30, 2011, which collectively comprise the<br />
District's basic financial statements as listed in the table of contents. These financial statements are the<br />
responsibility of the District's management. Our responsibility is to express opinions on these financial<br />
statements based on our audit.<br />
We conducted our audit in accordance with auditing standards generally accepted in the United States of<br />
America and the standards applicable to financial audits contained in Government Auditing Standards,<br />
issued by the Comptroller General of the United States. Those standards require that we plan and<br />
perform the audit to obtain reasonable assurance about whether the financial statements are free of<br />
material misstatement. An audit includes examining, on a test basis, evidence supporting the amounts<br />
and disclosures in the financial statements. An audit also includes assessing the accounting principles<br />
used and the significant estimates made by management, as well as evaluating the overall financial<br />
statement presentation. We believe that our audit provides a reasonable basis for our opinion.<br />
In our opinion, the financial statements referred to above present fairly, in all material respects, the<br />
respective financial position of the governmental activities, each major fund, and the aggregate remaining<br />
fund information of the District, as of June 30, 2011, and the respective changes in financial position and<br />
the respective budgetary comparison for the Zone L Library Services Fund, Zone A Parks and<br />
Community Services Fund, Zone E Extensive Landscaping Administration Fund and CFD #1 Fund,<br />
thereof for the year then ended in conformity with accounting principles generally accepted in the United<br />
States of America.<br />
In accordance with Government Auditing Standards, we have also issued our report dated<br />
January 11, 2012, on our consideration of the District’s internal control over financial reporting and on our<br />
tests of its compliance with certain provisions of laws, regulations, contracts, and grant agreements and<br />
other matters. The purpose of that report is to describe the scope of our testing of internal control over<br />
financial reporting and compliance and the results of that testing, and not to provide an opinion on internal<br />
control over financial reporting or on compliance. That report is an integral part of an audit performed in<br />
accordance with Government Auditing Standards and should be considered in assessing the results of<br />
our audit.<br />
Our audit was conducted for the purpose of forming opinions on the financial statements that collectively<br />
comprise the District’s financial statements as a whole. The combining statements are presented for<br />
purposes of additional analysis and are not a required part of the financial statements. These are the<br />
responsibility of management and were derived from and relate directly to the underlying accounting and<br />
other records used to prepare the financial statements. The information has been subjected to the<br />
auditing procedures applied in the audit of the financial statements and certain additional procedures,<br />
including comparing and reconciling such information directly to the underlying accounting and other<br />
Lance, Soll & Lunghard, LLP 203 North Brea Boulevard • Suite 203 • Brea, CA 92821 • TEL: 714.672.0022 • Fax: 714.672.0331 www.lslcpas.com<br />
Orange County Temecula <strong>Valley</strong> Silicon <strong>Valley</strong>
Board of Directors<br />
City of <strong>Moreno</strong> <strong>Valley</strong>, California<br />
Community Services District<br />
�<br />
records used to prepare the financial statements or to the financial statements themselves, and other<br />
additional procedures in accordance with auditing standards generally accepted in the United States of<br />
America. In our opinion, the information is fairly stated in all material respects in relation to the financial<br />
statements as a whole.<br />
The District has not presented a management’s discussion and analysis that accounting principles<br />
generally accepted in the United States of America has determined is necessary to supplement, although<br />
not required to be part of, the basic financial statements.<br />
Brea, California<br />
January 11, 2012<br />
�<br />
2
City of <strong>Moreno</strong> <strong>Valley</strong>, California<br />
Community Services District<br />
Statement of Net Assets<br />
June 30, 2011<br />
Governmental<br />
Activities<br />
Assets:<br />
Pooled cash and investments (note 2)<br />
Receivables:<br />
$ 12,652,018<br />
Accounts 235,015<br />
Due from other governments 384,902<br />
Capital assets not being depreciated (note 3) 812,604<br />
Capital assets, net of depreciation (note 3) 20,178,752<br />
Total Assets 34,263,291<br />
Liabilities:<br />
Accounts payable 508,655<br />
Accrued liabilities 114,960<br />
Unearned revenue 203,555<br />
Deposits payable 105,762<br />
Due to the City of <strong>Moreno</strong> <strong>Valley</strong> 3,305,681<br />
Due to other governments 5<br />
Advances from the City of <strong>Moreno</strong> <strong>Valley</strong> (note 4) 51,700<br />
Total Liabilities 4,290,318<br />
Net Assets:<br />
Invested in capital assets,<br />
net of related debt 20 20,991,356 991 356<br />
Restricted for:<br />
Special zones 8,981,617<br />
Total Net Assets $ 29,972,973<br />
See Notes to <strong>Financial</strong> Statements 3
Functions/Programs<br />
Primary Government:<br />
Governmental Activities:<br />
Program Revenues<br />
Net<br />
(Expenses)<br />
Revenues<br />
and Changes<br />
in Net Assets<br />
Operating Capital<br />
Charges for Contributions Contributions<br />
Expenses Services and Grants and Grants Total<br />
Community and cultural<br />
Capital contributions to<br />
$ 18,224,880 $ 10,435,552 $ 74,097 $ - $ (7,715,231)<br />
the City of <strong>Moreno</strong> <strong>Valley</strong> 638,225<br />
-<br />
-<br />
- (638,225)<br />
Total Governmental Activities $ 18,863,105 $ 10,435,552 $ 74,097 $ - (8,353,456)<br />
See Notes to <strong>Financial</strong> Statements 4<br />
City of <strong>Moreno</strong> <strong>Valley</strong>, California<br />
Community Services District<br />
Statement of Activities<br />
Year Ended June 30, 2011<br />
General Revenues:<br />
Taxes:<br />
Property taxes 3,237,015<br />
Other taxes 1,013,881<br />
Use of money and property 614,940<br />
Miscellaneous 63,102<br />
Contributions from the City of <strong>Moreno</strong> <strong>Valley</strong> 763,798<br />
Transfers from the City of <strong>Moreno</strong> <strong>Valley</strong> 1,587,244<br />
Total General Revenues, Contributions and Transfers 7,279,980<br />
Change in Net Assets (1,073,476)<br />
Net Assets at Beginning of Year 31,046,449<br />
Net Assets at End of Year $ 29,972,973
City of <strong>Moreno</strong> <strong>Valley</strong>, California<br />
Community Services District<br />
Governmental Funds<br />
Balance Sheet<br />
June 30, 2011<br />
Special Revenue Funds<br />
Zone A Parks Zone E<br />
and<br />
Extensive<br />
Zone L Library Community Landscaping<br />
Services Fund Services Administration<br />
Assets:<br />
Pooled cash and investments (note 2)<br />
Receivables:<br />
$ 250,684 $ 5,487,202 $ 4,274,748<br />
Accounts 837 228,030<br />
2,672<br />
Due from other governments 48,661 150,761<br />
43,706<br />
Total Assets $ 300,182 $ 5,865,993 $ 4,321,126<br />
Liabilities and Fund Balances:<br />
Liabilities:<br />
Accounts payable $ 6,104 $ 164,778 $ 120,185<br />
Accrued liabilities 21,652<br />
69,292<br />
8,679<br />
Due to the City of <strong>Moreno</strong> <strong>Valley</strong> - 3,305,681<br />
-<br />
Due to other governments -<br />
5<br />
-<br />
Deferred revenues -<br />
5,109<br />
-<br />
Unearned revenues - 203,555<br />
-<br />
Deposits payable - 105,762<br />
-<br />
Advances from the City of <strong>Moreno</strong> <strong>Valley</strong> -<br />
-<br />
-<br />
Total Liabilities 27,756<br />
Fund Balances:<br />
Restricted for:<br />
Special zones 272,426<br />
Committed to:<br />
Scholarship Program -<br />
Total Fund Balances 272,426<br />
3,854,182<br />
1,998,490<br />
13,321<br />
2,011,811<br />
128,864<br />
4,192,262<br />
-<br />
4,192,262<br />
Total Liabilities and Fund Balances $ 300,182 $ 5,865,993 $ 4,321,126<br />
See Notes to <strong>Financial</strong> Statements 5
Special Revenue Funds<br />
Nonmajor Total<br />
Governmental Governmental<br />
CFD #1 Fund Funds Funds<br />
$ 1,376,018 $ 1,263,366 $ 12,652,018<br />
Assets:<br />
Pooled cash and investments (note 2)<br />
Receivables:<br />
-<br />
3,476<br />
235,015 Accounts<br />
81,737<br />
60,037<br />
384,902 Due from other governments<br />
$ 1,457,755 $ 1,326,879 $ 13,271,935 Total Assets<br />
$ 30,508 $ 187,080 $ 508,655<br />
Liabilities and Fund Balances:<br />
Liabilities:<br />
Accounts payable<br />
6,222<br />
9,115<br />
114,960 Accrued liabilities<br />
-<br />
- 3,305,681 Due to the City of <strong>Moreno</strong> <strong>Valley</strong><br />
-<br />
-<br />
5 Due to other governments<br />
-<br />
-<br />
5,109 Deferred revenues<br />
-<br />
-<br />
203,555 Unearned revenues<br />
-<br />
-<br />
105,762 Deposits payable<br />
-<br />
51,700<br />
51,700 Advances from the City of <strong>Moreno</strong> <strong>Valley</strong><br />
36,730<br />
1,421,025<br />
-<br />
1,421,025<br />
247,895<br />
1,078,984<br />
-<br />
1,078,984<br />
4,295,427<br />
8,963,187<br />
13,321<br />
8,976,508<br />
Total Liabilities<br />
Fund Balances:<br />
Restricted for:<br />
Special zones<br />
Committed to:<br />
Scholarship Program<br />
Total Fund Balances<br />
$ 1,457,755 $ 1,326,879 $ 13,271,935 Total Liabilities and Fund Balances<br />
See Notes to <strong>Financial</strong> Statements 6
City of <strong>Moreno</strong> <strong>Valley</strong>, California<br />
Community Services District<br />
Reconciliation of the Balance Sheet of Governmental Funds<br />
to the Statement of Net Assets<br />
June 30, 2011<br />
Fund balances of governmental funds $ 8,976,508<br />
Amounts reported for governmental activities in the statement of net assets are different because:<br />
Capital assets, net of depreciation, used in governmental activities are not financial resources<br />
and, therefore, are not reported in the funds.<br />
Capital assets not being depreciated 812,604<br />
Depreciable capital assets, net of accumulated depreciation 20,178,752<br />
Revenues in the statement of activities that do not provide current financial resources are not<br />
reported as revenues in the statement of revenues, expenditures and changes in fund balances.<br />
These revenues are reported as deferred revenue in the balance sheet of governmental funds. 5,109<br />
Net assets of governmental activities $ 29,972,973<br />
See Notes to <strong>Financial</strong> Statements 7
Revenues:<br />
Taxes:<br />
City of <strong>Moreno</strong> <strong>Valley</strong>, California<br />
Community Services District<br />
Governmental Funds<br />
Statement of Revenues, Expenditures<br />
and Changes in Fund Balances<br />
Year Ended June 30, 2011<br />
Zone L Library<br />
Services Fund<br />
Property taxes $ 1,344,931 $ 1,692,052 $<br />
-<br />
Other taxes -<br />
-<br />
-<br />
Intergovernmental 74,097<br />
-<br />
-<br />
Charges for services 40,201 5,977,119 2,399,033<br />
Use of money and property -<br />
505,995<br />
74,922<br />
Fines and forfeitures 42,302<br />
-<br />
-<br />
Miscellaneous 22,783<br />
29,714<br />
4,631<br />
Total Revenues 1,524,314<br />
Expenditures:<br />
Current:<br />
Community and cultural 1,852,639<br />
Capital outlay -<br />
Total Expenditures 1,852,639<br />
Excess (Deficiency) of Revenues<br />
Over (Under) Expenditures (328,325)<br />
Other Financing Sources (Uses):<br />
Transfers from the City of <strong>Moreno</strong> <strong>Valley</strong> 446,740<br />
Total Other Financing Sources<br />
(Uses) 446,740<br />
Net Change in Fund Balances 118,415<br />
Fund Balances, Beginning of Year 154,011<br />
Special Revenue Funds<br />
Zone A Parks<br />
and Community<br />
Services<br />
8,204,880<br />
7,606,897<br />
18,247<br />
7,625,144<br />
579,736<br />
323,513<br />
323,513<br />
903,249<br />
1,108,562<br />
Zone E<br />
Extensive<br />
Landscaping<br />
Administration<br />
2,478,586<br />
2,332,842<br />
-<br />
2,332,842<br />
145,744<br />
-<br />
-<br />
145,744<br />
4,046,518<br />
Fund Balances, End of Year $ 272,426 $ 2,011,811 $ 4,192,262<br />
See Notes to <strong>Financial</strong> Statements 8
Special Revenue Funds<br />
Nonmajor Total<br />
Governmental Governmental<br />
CFD #1 Fund Funds Funds<br />
$ - $ 200,032 $ 3,237,015<br />
Revenues:<br />
Taxes:<br />
Property taxes<br />
1,013,881<br />
- 1,013,881 Other taxes<br />
-<br />
-<br />
74,097 Intergovernmental<br />
25,305 2,730,287 11,171,945 Charges for services<br />
24,668<br />
9,355<br />
614,940 Use of money and property<br />
-<br />
-<br />
42,302 Fines and forfeitures<br />
-<br />
5,974<br />
63,102 Miscellaneous<br />
1,063,854<br />
843,795<br />
-<br />
843,795<br />
220,059<br />
-<br />
-<br />
220,059<br />
1,200,966<br />
2,945,648<br />
3,657,175<br />
-<br />
3,657,175<br />
(711,527)<br />
816,991<br />
816,991<br />
105,464<br />
973,520<br />
16,217,282<br />
16,293,348<br />
18,247<br />
16,311,595<br />
(94,313)<br />
1,587,244<br />
1,587,244<br />
1,492,931<br />
7,483,577<br />
Total Revenues<br />
Expenditures:<br />
Current:<br />
Community and cultural<br />
Capital outlay<br />
Total Expenditures<br />
Excess (Deficiency) of Revenues<br />
Over (Under) Expenditures<br />
Other Financing Sources (Uses):<br />
Transfers from the City of <strong>Moreno</strong> <strong>Valley</strong><br />
Total Other Financing Sources<br />
(Uses)<br />
Net Change in Fund Balances<br />
Fund Balances, Beginning of Year<br />
$ 1,421,025 $ 1,078,984 $ 8,976,508 Fund Balances, End of Year<br />
See Notes to <strong>Financial</strong> Statements 9
City of <strong>Moreno</strong> <strong>Valley</strong>, California<br />
Community Services District<br />
Reconciliation of the Statement of Revenues, Expenditures and<br />
Changes in Fund Balances of Governmental Funds to the<br />
Statement of Activities<br />
Year Ended June 30, 2011<br />
Net change in fund balances - total governmental funds $ 1,492,931<br />
Amounts reported for governmental activities in the statement of activities are<br />
different because:<br />
Governmental funds report capital outlays as expenditures. However, in the statement<br />
of activities, the costs of those assets is allocated over their estimated useful lives<br />
as depreciation expense. This is the amount by which capital outlays exceeded<br />
depreciation in the current period<br />
Capital outlay 18,247<br />
Depreciation expense (1,931,532)<br />
Contributions from the City of <strong>Moreno</strong> <strong>Valley</strong> 763,798<br />
Contributions to the City of <strong>Moreno</strong> <strong>Valley</strong> (638,225)<br />
Revenues in the statement of activities that do not provide current financial resources are not<br />
reported as revenues in the statement of revenues, expenditures and changes in fund balances.<br />
These revenues are reported as deferred revenue in the balance sheet of governmental funds. (778,695)<br />
Change in net assets of governmental activities $ (1,073,476)<br />
See Notes to <strong>Financial</strong> Statements 10
Revenues:<br />
Taxes:<br />
City of <strong>Moreno</strong> <strong>Valley</strong>, California<br />
Community Services District<br />
Zone L Library Services Fund<br />
Budgetary Comparison Statement<br />
Year Ended June 30, 2011<br />
Variance with<br />
Final Budget<br />
Budgeted Amounts Actual Positive<br />
Original Final Amounts (Negative)<br />
Property taxes $ 1,201,200 $ 1,261,200 $ 1,344,931 $ 83,731<br />
Intergovernmental 27,000 27,000 74,097 47,097<br />
Charges for services 33,000 33,000 40,201<br />
7,201<br />
Fines and forfeitures 56,500 56,500 42,302 (14,198)<br />
Miscellaneous 2,000 22,120 22,783<br />
663<br />
Total Revenues 1,319,700<br />
Expenditures:<br />
Current:<br />
Community and cultural 1,903,462<br />
Total Expenditures 1,903,462<br />
Excess (Deficiency) of Revenues<br />
Over (Under) Expenditures (583,762)<br />
Other Financing Sources (Uses)<br />
Transfers from the City of <strong>Moreno</strong> <strong>Valley</strong> 446,740<br />
Total Other Financing Sources (Uses) 446,740<br />
Net Change in Fund Balances (137,022)<br />
Fund Balance, Beginning of Year 154,011<br />
1,399,820<br />
1,955,559<br />
1,955,559<br />
(555,739)<br />
446,740<br />
446,740<br />
(108,999)<br />
154,011<br />
1,524,314<br />
1,852,639<br />
1,852,639<br />
(328,325)<br />
446,740<br />
446,740<br />
118,415<br />
154,011<br />
124,494<br />
102,920<br />
102,920<br />
21,574<br />
-<br />
-<br />
21,574<br />
Fund Balance, End of Year $ 16,989 $ 45,012 $ 272,426 $ 21,574<br />
See Notes to <strong>Financial</strong> Statements 11<br />
-
Revenues:<br />
Taxes:<br />
City of <strong>Moreno</strong> <strong>Valley</strong>, California<br />
Community Services District<br />
Zone A Parks and Community Services<br />
Budgetary Comparison Statement<br />
Year Ended June 30, 2011<br />
Variance with<br />
Final Budget<br />
Budgeted Amounts Actual Positive<br />
Original Final Amounts (Negative)<br />
Property taxes $ 1,586,789 $ 1,586,789 $ 1,692,052 $ 105,263<br />
Charges for services 5,637,700 5,637,700 5,977,119 339,419<br />
Use of money and property 457,800 458,800 505,995 47,195<br />
Miscellaneous 25,500 26,433 29,714<br />
3,281<br />
Total Revenues 7,707,789<br />
Expenditures:<br />
Current:<br />
Community and cultural 7,817,977<br />
Capital outlay 6,400<br />
Total Expenditures 7,824,377<br />
Excess (Deficiency) of Revenues<br />
Over (Under) Expenditures (116,588)<br />
Other Financing Sources (Uses)<br />
Transfers from the City of <strong>Moreno</strong> <strong>Valley</strong> 289,800<br />
Total Other Financing Sources (Uses) 289,800<br />
Net Change in Fund Balances 173,212<br />
Fund Balance, Beginning of Year 1,108,562<br />
7,709,722<br />
7,818,910<br />
69,850<br />
7,888,760<br />
(179,038)<br />
289,800<br />
289,800<br />
110,762<br />
1,108,562<br />
8,204,880<br />
7,606,897<br />
18,247<br />
7,625,144<br />
579,736<br />
323,513<br />
323,513<br />
903,249<br />
1,108,562<br />
495,158<br />
212,013<br />
51,603<br />
263,616<br />
231,542<br />
33,713<br />
33,713<br />
265,255<br />
Fund Balance, End of Year $ 1,281,774 $ 1,219,324 $ 2,011,811 $ 265,255<br />
See Notes to <strong>Financial</strong> Statements 12<br />
-
City of <strong>Moreno</strong> <strong>Valley</strong>, California<br />
Community Services District<br />
Zone E Extensive Landscaping Administration<br />
Budgetary Comparison Statement<br />
Year Ended June 30, 2011<br />
Budgeted Amounts Actual<br />
Variance with<br />
Final Budget<br />
Positive<br />
Original Final Amounts (Negative)<br />
Revenues:<br />
Charges for services $ 2,403,200 $ 2,351,400 $ 2,399,033 $ 47,633<br />
Use of money and property 69,600 69,600 74,922<br />
5,322<br />
Miscellaneous 2,800<br />
2,800 4,631<br />
1,831<br />
Total Revenues 2,475,600<br />
Expenditures:<br />
Current:<br />
Community and cultural 2,781,383<br />
Total Expenditures 2,781,383<br />
Net Change in Fund Balances (305,783)<br />
Fund Balance, Beginning of Year 4,046,518<br />
2,423,800<br />
2,781,383<br />
2,781,383<br />
(357,583)<br />
4,046,518<br />
2,478,586<br />
2,332,842<br />
2,332,842<br />
145,744<br />
4,046,518<br />
54,786<br />
448,541<br />
448,541<br />
(393,755)<br />
Fund Balance, End of Year $ 3,740,735 $ 3,688,935 $ 4,192,262 $ (393,755)<br />
See Notes to <strong>Financial</strong> Statements 13<br />
-
Revenues:<br />
Taxes:<br />
City of <strong>Moreno</strong> <strong>Valley</strong>, California<br />
Community Services District<br />
CFD #1 Fund<br />
Budgetary Comparison Statement<br />
Year Ended June 30, 2011<br />
Variance with<br />
Final Budget<br />
Budgeted Amounts Actual Positive<br />
Original Final Amounts (Negative)<br />
Other taxes $ 967,800 $ 967,800 $ 1,013,881 $ 46,081<br />
Charges for services - 25,305 25,305<br />
-<br />
Use of money and property 13,000 13,000 24,668 11,668<br />
Total Revenues 980,800<br />
Expenditures:<br />
Current:<br />
Community and cultural 939,525<br />
Capital outlay 117,000<br />
Total Expenditures 1,056,525<br />
Excess (Deficiency) of Revenues<br />
Over (Under) Expenditures (75,725)<br />
Other Financing Sources (Uses)<br />
Transfers from the City of <strong>Moreno</strong> <strong>Valley</strong> 25,305<br />
Total Other Financing Sources (Uses) 25,305<br />
Net Change in Fund Balances (50,420)<br />
Fund Balance, Beginning of Year 1,200,966<br />
1,006,105<br />
939,525<br />
120,000<br />
1,059,525<br />
(53,420)<br />
-<br />
-<br />
(53,420)<br />
1,200,966<br />
1,063,854<br />
843,795<br />
-<br />
843,795<br />
220,059<br />
-<br />
-<br />
220,059<br />
1,200,966<br />
57,749<br />
95,730<br />
120,000<br />
215,730<br />
(157,981)<br />
-<br />
-<br />
(157,981)<br />
Fund Balance, End of Year $ 1,150,546 $ 1,147,546 $ 1,421,025 $ (157,981)<br />
See Notes to <strong>Financial</strong> Statements 14<br />
-
City of <strong>Moreno</strong> <strong>Valley</strong>, California<br />
Community Services District<br />
Notes to <strong>Financial</strong> Statements<br />
June 30, 2011<br />
Note 1: Summary of Significant Accounting Policies<br />
a. Description of the <strong>Report</strong>ing Entity<br />
The City of <strong>Moreno</strong> <strong>Valley</strong>, California Community Services District (the District), was<br />
created by a City Council ordinance adopted on December 3, 1984. Its purpose is to act<br />
as a legal entity, separate and distinct from the City of <strong>Moreno</strong> <strong>Valley</strong> (the City), even<br />
though the City Council is currently serving as the District’s Governing Board. The<br />
District is broadly empowered to engage in the general maintenance and administration<br />
of the City’s community programs.<br />
Governmental Accounting Standards define the reporting entity as the primary<br />
government and those component units for which the primary government is financially<br />
accountable. <strong>Financial</strong> accountability is defined as appointment of a voting majority of<br />
the component unit’s board, and either: a) the primary government has the ability to<br />
impose its will, or b) the possibility that the component unit will provide a financial benefit<br />
to, or impose a financial burden on the primary government. Since the City Council of the<br />
City of <strong>Moreno</strong> <strong>Valley</strong> also serves as the Governing Board of the District, the City, in<br />
effect, has the ability to influence and control operations. Therefore, the City has<br />
oversight responsibility for the District. Accordingly, in applying the criteria of<br />
Governmental Accounting Standards, the financial statements of the District are included<br />
in the City’s Comprehensive Annual <strong>Financial</strong> <strong>Report</strong>. The District has the same fiscal<br />
year end as the City and its financial statements can be obtained from the City Clerk.<br />
b. Government-Wide and Fund <strong>Financial</strong> Statements<br />
The government-wide financial statements (i.e., the statement of net assets and the<br />
statement of activities) report information on the component unit. For the most part, the<br />
effect of interfund activity has been removed from these statements.<br />
The statement of activities demonstrates the degree to which the direct expenses of a<br />
given function or segment are offset by program revenues. Direct expenses are those<br />
that are clearly identifiable with a specific function or segment. Program revenues<br />
include: 1) charges to customers or applicants who purchase, use or directly benefit from<br />
goods, services or privileges provided by a given function or segment, and 2) grants and<br />
contributions that are restricted to meeting the operational or capital requirements of a<br />
particular function or segment. Taxes and other items not properly included among<br />
program revenues are reported instead as general revenues.<br />
Major individual governmental funds are reported as separate columns in the fund<br />
financial statements.<br />
c. Measurement Focus, Basis of Accounting and <strong>Financial</strong> Statement Presentation<br />
The government-wide financial statements are reported using the economic resources<br />
measurement focus and the accrual basis of accounting. Revenues are recorded when<br />
earned and expenses are recorded when a liability is incurred, regardless of the timing of<br />
related cash flows. Property taxes are recognized as revenues in the year for which they<br />
have been levied. Grants and similar items are recognized as revenue as soon as all<br />
eligibility requirements imposed by the provider have been met.<br />
15
City of <strong>Moreno</strong> <strong>Valley</strong>, California<br />
Community Services District<br />
Notes to <strong>Financial</strong> Statements (Continued)<br />
June 30, 2011<br />
Note 1: Summary of Significant Accounting Policies (Continued)<br />
Government fund financial statements are reported using the current financial resources<br />
measurement focus and the modified accrual basis of accounting. Revenues are<br />
recognized as soon as they are both measurable and available. Revenues are<br />
considered to be available when they are collectible within the current period or soon<br />
enough thereafter to pay liabilities of the current period. For this purpose, the<br />
government considers operating revenues to be available if they are collected within<br />
60 days of the end of the current fiscal period, while grant revenues have an availability<br />
period of 120 days. Expenditures generally are recorded when a liability is incurred, as<br />
under accrual accounting. However, debt service expenditures are recorded only when<br />
payment is due.<br />
Property taxes, franchise taxes, licenses and interest associated with the current fiscal<br />
period are all considered to be susceptible to accrual and so have been recognized as<br />
revenues of the current fiscal period. Only the portion of special assessments receivable<br />
due within the current fiscal period is considered to be susceptible to accrual as revenue<br />
of the current period. All other revenue items are considered to be measurable and<br />
available only when cash is received by the government.<br />
The District reports the following major governmental funds:<br />
Zone L Library Services Fund accounts for the operations necessary to process<br />
and administer the library services program.<br />
Zone A Parks and Community Services accounts for the administration and<br />
maintenance of the parks and community services facilities and programs.<br />
Zone E Extensive Landscaping Administration accounts for the operations<br />
necessary to provide high-service level landscape maintenance in and around<br />
specific major residential developments.<br />
CFD #1 Fund provides funding for maintenance of new neighborhood parks, trails,<br />
and Class I bikeways.<br />
d. Budgetary <strong>Report</strong>ing<br />
Budgets are legally adopted and formal budgetary integration is employed as a<br />
management control device during the year for the governmental activities. Budgets<br />
presented in this report for comparison to actual amounts are presented in accordance<br />
with generally accepted accounting principles (GAAP). From the effective date of the<br />
budget, the amounts stated therein as proposed expenditures become appropriations to<br />
the various District departments.<br />
<strong>Report</strong>ed budget amounts represent the original legally adopted budget as amended.<br />
The City Council may amend the budget only by a duly adopted minute resolution during<br />
a regular meeting, providing that sufficient monies are available and that expenditures of<br />
proceeds of taxes will not be increased beyond the constitutional appropriation limit as<br />
imposed by Article XIIIB of the State Constitution.<br />
16
City of <strong>Moreno</strong> <strong>Valley</strong>, California<br />
Community Services District<br />
Notes to <strong>Financial</strong> Statements (Continued)<br />
June 30, 2011<br />
Note 1: Summary of Significant Accounting Policies (Continued)<br />
Individual fund budgets are, in all cases where appropriations are required, the same as<br />
the appropriation amounts. In the case of the Governmental Fund type, unexpended<br />
budgeted amounts, except for amounts relating to capital projects, lapse at the end of the<br />
budget year. Spending control for most funds is established by the amount of<br />
expenditures budgeted for each department within the fund, but management control is<br />
exercised at budgetary line item levels within the departments. Management can transfer<br />
budgeted amounts between line items within each department provided that they do not<br />
increase or decrease total department appropriations. Expenditures may not legally<br />
exceed budgeted appropriations at the department and fund levels.<br />
e. Use of Restricted/Unrestricted Net Assets<br />
When an expense is incurred for purposes for which both restricted and unrestricted net<br />
assets are available, the District’s policy is to apply restricted net assets first.<br />
f. Deferred Revenue<br />
In the government-wide financial statements, deferred revenue is recognized for<br />
transactions for which revenue has not yet been earned. Typical transactions recorded as<br />
deferred revenues in the government-wide financial statements are prepaid charges for<br />
services.<br />
In the fund financial statements, deferred revenue is recorded when transactions have<br />
not yet met the revenue recognition criteria based on the modified accrual basis of<br />
accounting. The District records deferred revenue for transactions for which revenues<br />
have not been earned, or for which funds are not available to meet current financial<br />
obligations. Typical transactions for which deferred revenue is recorded are grants<br />
received but not yet earned or available, long-term loans receivables, and prepaid<br />
charges for services.<br />
g. Fund Balance<br />
In the fund financial statements, government funds report the following fund balance<br />
classifications:<br />
Nonspendable include amounts that cannot be spent because they are either (a) not<br />
in spendable form or (b) legally or contractually required to be maintained intact.<br />
Restricted include amounts that are constrained on the use of resources by either<br />
(a) external creditors, grantors, contributors, or laws of regulations of other<br />
governments or (b) by law through constitutional provisions or enabling legislation.<br />
Committed include amounts that can only be used for specific purposes pursuant to<br />
constraints imposed by formal action of the government’s highest authority, the<br />
Governing Board. The formal action that is required to be taken to establish, modify,<br />
or rescind a fund balance commitment is a minute action or a resolution.<br />
Assigned include amounts that are constrained by the government’s intent to be used<br />
for specific purposes, but are neither restricted nor committed. The <strong>Financial</strong> and<br />
Administrative Services Director is authorized to assign amounts to a specific<br />
purpose, which was established by the governing body in a resolution.<br />
17
City of <strong>Moreno</strong> <strong>Valley</strong>, California<br />
Community Services District<br />
Notes to <strong>Financial</strong> Statements (Continued)<br />
June 30, 2011<br />
Note 1: Summary of Significant Accounting Policies (Continued)<br />
Unassigned include the residual amounts that have not been restricted, committed,<br />
or assigned to specific purposes.<br />
When an expenditure is incurred for purposes for which both restricted and<br />
unrestricted fund balance is available, the District considers restricted amounts to be<br />
used first, then unrestricted. When an expenditure is incurred for purposes for which<br />
amounts in any of the unrestricted fund balance classifications could be used, they<br />
are considered to be spent in the order as follows: committed, assigned and then<br />
unassigned.<br />
h. Net Assets<br />
In the government-wide financial statements, net assets are classified in the following<br />
categories:<br />
Investment in Capital Assets – This amount consists of capital assets net of accumulated<br />
depreciation and reduced by outstanding debt that is attributed to the acquisition,<br />
construction, or improvement of the assets. Currently, the District does not have any debt<br />
attributed to capital assets.<br />
Restricted Net Assets – This amount is restricted by external creditors, grantors,<br />
contributors, or laws or regulations of other governments.<br />
i. Encumbrances<br />
Encumbrance accounting, under which purchase orders, contracts and other<br />
commitments for the expenditure of monies are recorded in order to restrict that portion of<br />
the applicable appropriation, is employed as an extension of formal budgetary integration<br />
in the Governmental Fund type. Unexpended and unencumbered appropriations of the<br />
Governmental Fund automatically lapse at the end of the fiscal year. Encumbrances at<br />
year-end are a portion of the restricted fund balance and are reappropriated the following<br />
year.<br />
j. Capital Assets<br />
Capital assets, which include property, plant, equipment and infrastructure assets<br />
(e.g., roads, bridges, sidewalks and similar items), are reported in the government-wide<br />
financial statements. Capital assets are defined by the District as assets with an initial,<br />
individual cost of more than $5,000 (amount not rounded) and an estimated useful life in<br />
excess of two years. Such assets are recorded at historical cost or estimated historical<br />
cost if purchased or constructed. Donated capital assets are recorded at estimated fair<br />
market value at the date of donation.<br />
The costs of normal maintenance and repairs that do not add to the value of the asset or<br />
materially extend assets lives are not capitalized.<br />
Major outlays for capital assets and improvements are capitalized as projects are<br />
constructed.<br />
18
City of <strong>Moreno</strong> <strong>Valley</strong>, California<br />
Community Services District<br />
Notes to <strong>Financial</strong> Statements (Continued)<br />
June 30, 2011<br />
Note 1: Summary of Significant Accounting Policies (Continued)<br />
Property, plant and equipment are depreciated using the straight-line method over the<br />
following estimated useful lives:<br />
k. Investments<br />
Assets Years<br />
Buildings and Improvements 5 – 50<br />
Furniture and Equipment 3 – 15<br />
Vehicles 3 – 10<br />
Infrastructure 25 – 50<br />
The District records all investments at fair value. The current year’s changes in fair value<br />
are recognized in the statement of revenues, expenditures and changes in fund balances<br />
as use of money and property. Use of money and property includes interest earnings,<br />
changes in fair value, rental income and any gains or losses.<br />
l. Salary Expenditures<br />
The District does not employ any personnel and relies on the City for administrative<br />
services. The financial statements include expenditures for salary and other benefits,<br />
which were allocated to the District by the City.<br />
m. Property Taxes<br />
Property taxes attach as an enforceable lien on property as of January 1. Secured<br />
property taxes are levied on August 10 and are payable in two installments on<br />
November 1 and February 1. Unsecured personal property taxes are due in a single<br />
installment on July 1. The County of Riverside bills and collects the property taxes and<br />
remits them to the District in installments during the year. Property taxes received within<br />
60 days after the District’s fiscal year-end are considered “measurable” and “available”<br />
and are accrued in the District’s financial statements.<br />
n. Use of Estimates<br />
The preparation of financial statements in conformity with accounting principles generally<br />
accepted in the United States requires management to make estimates and assumptions<br />
that affect the reported amounts of assets and liabilities and disclosure of contingent<br />
assets and liabilities at the date of the financial statements and the related reported<br />
amounts of revenues and expenditures during the reporting period. Actual results could<br />
differ from estimates.<br />
Note 2: Cash and Investments<br />
Cash and investments reported in the accompanying financial statements consisted of the<br />
following:<br />
Cash and investments pooled with the City $12,652,018<br />
The District has no separate bank accounts or investments other than the District’s equity in<br />
the cash and investment pool managed by the City. The District is a voluntary participant in<br />
the City’s investment pool. This pool is governed by and under the regulatory oversight of the<br />
19
Note 2: Cash and Investments (Continued)<br />
City of <strong>Moreno</strong> <strong>Valley</strong>, California<br />
Community Services District<br />
Notes to <strong>Financial</strong> Statements (Continued)<br />
June 30, 2011<br />
Investment Policy adopted by the City Council of the City. The District has not adopted an<br />
investment policy separate from that of the City. The fair value of the District’s investment in<br />
this pool is reported in the accompanying financial statements at amounts based upon the<br />
District’s pro-rata share of the fair value calculated by the City for the entire City portfolio.<br />
The balance available for withdrawal is based on the accounting records maintained by the<br />
City, which are recorded on an original cost basis.<br />
Note 3: Capital Assets<br />
The following is a summary of capital assets for governmental activities:<br />
Balances Balances<br />
7/1/2010 Additions Deletions 6/30/2011<br />
Non-depreciable Assets:<br />
Land $ 450,000 $ - $ - $ 450,000<br />
Construction in progress - 362,604<br />
- 362,604<br />
Total Non-depreciable Assets 450,000<br />
Depreciable Assets:<br />
Buildings and Improvements 49,973,475<br />
Furniture and Equipment 1,250,323<br />
Vehicles 529,503<br />
Infrastructure 101,457<br />
Total Depreciable Assets 51,854,758<br />
Accumulated Depreciation:<br />
Buildings and Improvements (28,013,338)<br />
Furniture and Equipment (1,082,089)<br />
Vehicles (428,485)<br />
Infrastructure (1,778)<br />
362,604<br />
-<br />
419,441<br />
-<br />
-<br />
419,441<br />
(1,781,812)<br />
(74,946)<br />
(71,218)<br />
(3,556)<br />
-<br />
(1,013,056)<br />
-<br />
-<br />
-<br />
(1,013,056)<br />
374,831<br />
-<br />
-<br />
-<br />
812,604<br />
48,960,419<br />
1,669,764<br />
529,503<br />
101,457<br />
51,261,143<br />
(29,420,319)<br />
(1,157,035)<br />
(499,703)<br />
(5,334)<br />
Total Accumulated<br />
Depreciation<br />
Total Depreciable Assets,<br />
(29,525,690) (1,931,532) 374,831 (31,082,391)<br />
Net of Depreciation<br />
Total Capital Assets,<br />
22,329,068 (1,512,091) (638,225) 20,178,752<br />
Net of Depreciation $ 22,779,068 $ (1,149,487) $ (638,225) $ 20,991,356<br />
Depreciation expense was charged to functions/programs of the District as follows:<br />
Governmental Activities:<br />
Community and cultural $ 1,931,532<br />
Note 4: Advances from the City of <strong>Moreno</strong> <strong>Valley</strong><br />
During the year, the City of <strong>Moreno</strong> <strong>Valley</strong> loaned $51,700 to the Community Services District<br />
Zone B Residential Street Lights Administration Fund to subsidize the cost of residential<br />
streetlight services to be repaid by February 7, 2016.<br />
20
Note 5: Commitments and Contingencies<br />
City of <strong>Moreno</strong> <strong>Valley</strong>, California<br />
Community Services District<br />
Notes to <strong>Financial</strong> Statements (Continued)<br />
June 30, 2011<br />
The District is exposed to various risks of loss related to torts; theft of, damage to and<br />
destruction of assets; errors and omissions; and injuries to employees. The City of<br />
<strong>Moreno</strong> <strong>Valley</strong> established two Self-Insurance Funds (internal service funds) to account for<br />
and finance its uninsured risks of loss. Under this program, the self-insurance funds provide<br />
coverage for up to a maximum of $300,000 for each worker’s compensation claim and<br />
$250,000 for each general liability claim. The City purchases commercial insurance for<br />
claims in excess of coverage provided by the funds and for all other risks of loss. Settled<br />
claims have not exceeded this commercial coverage in any of the past three years. All funds<br />
of the District participate in the program and make payments to the Self-Insurance Funds<br />
based on actuarial estimates of the amounts needed to pay prior and current year claims.<br />
21
City of <strong>Moreno</strong> <strong>Valley</strong>, California<br />
Community Services District<br />
Nonmajor Governmental Funds<br />
Combining Balance Sheet<br />
June 30, 2011<br />
Special Revenue Funds<br />
Zone B<br />
Zone D<br />
Residential Zone C Arterial Standard<br />
Street Lights Street Lights Landscaping<br />
Administration Administration Administration<br />
Assets:<br />
Pooled cash and investments<br />
Receivables:<br />
$ 129,243 $ 303,131 $ 463,333<br />
Accounts -<br />
-<br />
3,476<br />
Due from other governments 21,452<br />
12,801<br />
23,259<br />
Total Assets $ 150,695 $ 315,932 $ 490,068<br />
Liabilities and Fund Balances:<br />
Liabilities:<br />
Accounts payable $ 94,566 $ 39,253 $ 39,870<br />
Accrued liabilities 2,054<br />
668<br />
5,071<br />
Advances from the City of <strong>Moreno</strong> <strong>Valley</strong> 51,700<br />
-<br />
-<br />
Total Liabilities 148,320<br />
39,921<br />
44,941<br />
Fund Balances:<br />
Restricted for:<br />
Special zones 2,375 276,011 445,127<br />
Total Fund Balances 2,375<br />
276,011<br />
445,127<br />
Total Liabilities and Fund Balances $ 150,695 $ 315,932 $ 490,068<br />
22
Special Revenue Funds<br />
Zone S<br />
Sunnymead<br />
Total<br />
Zone M Boulevard Nonmajor<br />
Median Fund Maintenance Funds<br />
$ 289,180 $ 78,479 $ 1,263,366<br />
Assets:<br />
Pooled cash and investments<br />
Receivables:<br />
-<br />
-<br />
3,476 Accounts<br />
1,409<br />
1,116<br />
60,037 Due from other governments<br />
$ 290,589 $ 79,595 $ 1,326,879<br />
Total Assets<br />
$ 10,107 $ 3,284 $ 187,080<br />
Liabilities and Fund Balances:<br />
Liabilities:<br />
Accounts payable<br />
1,085<br />
237<br />
9,115 Accrued liabilities<br />
-<br />
-<br />
51,700 Advances from the City of <strong>Moreno</strong> <strong>Valley</strong><br />
11,192<br />
3,521<br />
247,895<br />
Total Liabilities<br />
279,397 76,074 1,078,984<br />
Fund Balances:<br />
Restricted for:<br />
Special zones<br />
279,397<br />
76,074<br />
1,078,984<br />
Total Fund Balances<br />
$ 290,589 $ 79,595 $ 1,326,879<br />
Total Liabilities and Fund Balances<br />
23
Revenues:<br />
Taxes:<br />
City of <strong>Moreno</strong> <strong>Valley</strong>, California<br />
Community Services District<br />
Nonmajor Governmental Funds<br />
Combining Statement of Revenues,<br />
Expenditures and Changes in Fund Balances<br />
Year Ended June 30, 2011<br />
Zone B<br />
Residential<br />
Street Lights<br />
Administration<br />
Property taxes $ 85,934 $ 114,098 $<br />
-<br />
Charges for services 947,662<br />
451,751 1,120,675<br />
Use of money and property (5,210)<br />
5,742<br />
7,210<br />
Miscellaneous -<br />
-<br />
5,624<br />
Total Revenues 1,028,386<br />
Expenditures:<br />
Current:<br />
Community and cultural 1,605,916<br />
Total Expenditures 1,605,916<br />
Excess (Deficiency) of Revenues<br />
Over (Under) Expenditures (577,530)<br />
Other Financing g Sources (Uses): ( )<br />
Transfers from the City of <strong>Moreno</strong> <strong>Valley</strong> 713,591<br />
Total Other Financing Sources<br />
(Uses) 713,591<br />
Net Change in Fund Balances 136,061<br />
Fund Balances, Beginning of Year (133,686)<br />
Special Revenue Funds<br />
Zone C Arterial<br />
Street Lights<br />
Administration<br />
571,591<br />
751,807<br />
751,807<br />
(180,216)<br />
-<br />
-<br />
(180,216)<br />
456,227<br />
Zone D<br />
Standard<br />
Landscaping<br />
Administration<br />
1,133,509<br />
1,018,025<br />
1,018,025<br />
115,484<br />
-<br />
-<br />
115,484<br />
329,643<br />
Fund Balances, End of Year $ 2,375 $ 276,011 $ 445,127<br />
24
Special Revenue Funds<br />
Zone S<br />
Sunnymead Total<br />
Zone M Boulevard Nonmajor<br />
Median Fund Maintenance Funds<br />
$ - $ - $ 200,032<br />
Revenues:<br />
Taxes:<br />
Property taxes<br />
158,234<br />
51,965 2,730,287 Charges for services<br />
-<br />
1,613<br />
9,355 Use of money and property<br />
350<br />
-<br />
5,974 Miscellaneous<br />
158,584<br />
220,321<br />
220,321<br />
(61,737)<br />
103,400<br />
103,400<br />
41,663<br />
237,734<br />
53,578<br />
61,106<br />
61,106<br />
(7,528)<br />
-<br />
-<br />
(7,528)<br />
83,602<br />
2,945,648<br />
3,657,175<br />
3,657,175<br />
(711,527)<br />
816,991<br />
816,991<br />
105,464<br />
973,520<br />
Total Revenues<br />
Expenditures:<br />
Current:<br />
Community and cultural<br />
Total Expenditures<br />
Excess (Deficiency) of Revenues<br />
Over (Under) Expenditures<br />
Other Financing g Sources (Uses): ( )<br />
Transfers from the City of <strong>Moreno</strong> <strong>Valley</strong><br />
Total Other Financing Sources<br />
(Uses)<br />
Net Change in Fund Balances<br />
Fund Balances, Beginning of Year<br />
$ 279,397 $ 76,074 $ 1,078,984 Fund Balances, End of Year<br />
25
Revenues:<br />
Taxes:<br />
City of <strong>Moreno</strong> <strong>Valley</strong>, California<br />
Community Services District<br />
Zone B Residential Street Lights Administration<br />
Budgetary Comparison Schedule<br />
Year Ended June 30, 2011<br />
Variance with<br />
Final Budget<br />
Budgeted Amounts Actual Positive<br />
Original Final Amounts (Negative)<br />
Property taxes $ 116,100 $ 116,100 $ 85,934 $ (30,166)<br />
Charges for services 930,600 930,600 947,662 17,062<br />
Use of money and property -<br />
- (5,210) (5,210)<br />
Total Revenues 1,046,700<br />
Expenditures:<br />
Current:<br />
Community and cultural 1,615,394<br />
Total Expenditures 1,615,394<br />
Excess (Deficiency) of Revenues<br />
Over (Under) Expenditures (568,694)<br />
Other Financing Sources (Uses)<br />
Transfers from the City of <strong>Moreno</strong> <strong>Valley</strong> -<br />
Total Other Financing Sources (Uses) -<br />
Net Change in Fund Balances (568,694)<br />
Fund Balance, Beginning of Year (133,686)<br />
1,046,700<br />
1,615,394<br />
1,615,394<br />
(568,694)<br />
623,300<br />
623,300<br />
54,606<br />
(133,686)<br />
1,028,386<br />
1,605,916<br />
1,605,916<br />
(577,530)<br />
713,591<br />
713,591<br />
136,061<br />
(133,686)<br />
(18,314)<br />
9,478<br />
9,478<br />
(27,792)<br />
90,291<br />
90,291<br />
62,499<br />
Fund Balance, End of Year $ (702,380) $ (79,080) $ 2,375 $ 62,499<br />
26<br />
-
Revenues:<br />
Taxes:<br />
City of <strong>Moreno</strong> <strong>Valley</strong>, California<br />
Community Services District<br />
Zone C Arterial Street Lights Administration<br />
Budgetary Comparison Schedule<br />
Year Ended June 30, 2011<br />
Variance with<br />
Final Budget<br />
Budgeted Amounts Actual Positive<br />
Original Final Amounts (Negative)<br />
Property taxes $ 139,300 $ 139,300 $ 114,098 $ (25,202)<br />
Charges for services 431,700 431,700 451,751 20,051<br />
Use of money and property 9,000<br />
9,000 5,742<br />
(3,258)<br />
Total Revenues 580,000<br />
Expenditures:<br />
Current:<br />
Community and cultural 788,078<br />
Total Expenditures 788,078<br />
Net Change in Fund Balances (208,078)<br />
Fund Balance, Beginning of Year 456,227<br />
580,000<br />
788,078<br />
788,078<br />
(208,078)<br />
456,227<br />
571,591<br />
751,807<br />
751,807<br />
(180,216)<br />
456,227<br />
(8,409)<br />
36,271<br />
36,271<br />
(44,680)<br />
Fund Balance, End of Year $ 248,149 $ 248,149 $ 276,011 $ (44,680)<br />
27<br />
-
City of <strong>Moreno</strong> <strong>Valley</strong>, California<br />
Community Services District<br />
Zone D Standard Landscaping Administration<br />
Budgetary Comparison Schedule<br />
Year Ended June 30, 2011<br />
Budgeted Amounts Actual<br />
Variance with<br />
Final Budget<br />
Positive<br />
Original Final Amounts (Negative)<br />
Revenues:<br />
Charges for services $ 1,091,500 $ 1,091,500 $ 1,120,675 $ 29,175<br />
Use of money and property 1,300<br />
1,300 7,210<br />
5,910<br />
Miscellaneous 50,000 50,000 5,624 (44,376)<br />
Total Revenues 1,142,800<br />
Expenditures:<br />
Current:<br />
Community and cultural 1,415,813<br />
Total Expenditures 1,415,813<br />
Net Change in Fund Balances (273,013)<br />
Fund Balance, Beginning of Year 329,643<br />
1,142,800<br />
1,415,813<br />
1,415,813<br />
(273,013)<br />
329,643<br />
1,133,509<br />
1,018,025<br />
1,018,025<br />
115,484<br />
329,643<br />
(9,291)<br />
397,788<br />
397,788<br />
(407,079)<br />
Fund Balance, End of Year $ 56,630 $ 56,630 $ 445,127 $ (407,079)<br />
28<br />
-
City of <strong>Moreno</strong> <strong>Valley</strong>, California<br />
Community Services District<br />
Zone M Median Fund<br />
Budgetary Comparison Schedule<br />
Year Ended June 30, 2011<br />
Budgeted Amounts Actual<br />
Variance with<br />
Final Budget<br />
Positive<br />
Original Final Amounts (Negative)<br />
Revenues:<br />
Charges for services $ 204,200 $ 204,200 $ 158,234 $ (45,966)<br />
Use of money and property 1,500<br />
1,500<br />
-<br />
(1,500)<br />
Miscellaneous -<br />
-<br />
350<br />
350<br />
Total Revenues 205,700<br />
Expenditures:<br />
Current:<br />
Community and cultural 272,844<br />
Total Expenditures 272,844<br />
Excess (Deficiency) of Revenues<br />
Over (Under) Expenditures (67,144)<br />
Other Financing Sources (Uses)<br />
Transfers from the City of <strong>Moreno</strong> <strong>Valley</strong> 103,400<br />
Total Other Financing Sources (Uses) 103,400<br />
Net Change in Fund Balances 36,256<br />
Fund Balance, Beginning of Year 237,734<br />
205,700<br />
272,844<br />
272,844<br />
(67,144)<br />
103,400<br />
103,400<br />
36,256<br />
237,734<br />
158,584<br />
220,321<br />
220,321<br />
(61,737)<br />
103,400<br />
103,400<br />
41,663<br />
237,734<br />
(47,116)<br />
52,523<br />
52,523<br />
(99,639)<br />
-<br />
-<br />
(99,639)<br />
Fund Balance, End of Year $ 273,990 $ 273,990 $ 279,397 $ (99,639)<br />
29<br />
-
City of <strong>Moreno</strong> <strong>Valley</strong>, California<br />
Community Services District<br />
Zone S Sunnymead Boulevard Maintenance<br />
Budgetary Comparison Schedule<br />
Year Ended June 30, 2011<br />
Budgeted Amounts Actual<br />
Variance with<br />
Final Budget<br />
Positive<br />
Original Final Amounts (Negative)<br />
Revenues:<br />
Charges for services $ 52,400 $ 57,400 $ 51,965 $ (5,435)<br />
Use of money and property -<br />
- 1,613<br />
1,613<br />
Total Revenues 52,400<br />
Expenditures:<br />
Current:<br />
Community and cultural 117,600<br />
Total Expenditures 117,600<br />
Net Change in Fund Balances (65,200)<br />
Fund Balance, Beginning of Year 83,602<br />
57,400<br />
117,600<br />
117,600<br />
(60,200)<br />
83,602<br />
53,578<br />
61,106<br />
61,106<br />
(7,528)<br />
83,602<br />
(3,822)<br />
56,494<br />
56,494<br />
(60,316)<br />
Fund Balance, End of Year $ 18,402 $ 23,402 $ 76,074 $ (60,316)<br />
30<br />
-