Microstructural Evolution in a 17-4 PH Stainless Steel after Aging at ...
Microstructural Evolution in a 17-4 PH Stainless Steel after Aging at ...
Microstructural Evolution in a 17-4 PH Stainless Steel after Aging at ...

You also want an ePaper? Increase the reach of your titles
YUMPU automatically turns print PDFs into web optimized ePapers that Google loves.
(a)<br />
(b)<br />
110<br />
110<br />
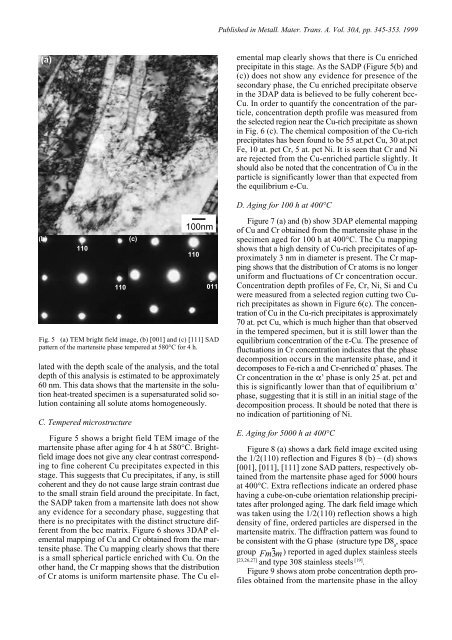
l<strong>at</strong>ed with the depth scale of the analysis, and the total<br />
depth of this analysis is estim<strong>at</strong>ed to be approxim<strong>at</strong>ely<br />
60 nm. This d<strong>at</strong>a shows th<strong>at</strong> the martensite <strong>in</strong> the solution<br />
he<strong>at</strong>-tre<strong>at</strong>ed specimen is a supers<strong>at</strong>ur<strong>at</strong>ed solid solution<br />
conta<strong>in</strong><strong>in</strong>g all solute <strong>at</strong>oms homogeneously.<br />
C. Tempered microstructure<br />
(c)<br />
100nm<br />
110<br />
011<br />
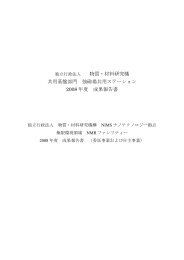
Fig. 5 (a) TEM bright field image, (b) [001] and (c) [111] SAD<br />
p<strong>at</strong>tern of the martensite phase tempered <strong>at</strong> 580°C for 4 h.<br />
Figure 5 shows a bright field TEM image of the<br />
martensite phase <strong>after</strong> ag<strong>in</strong>g for 4 h <strong>at</strong> 580°C. Brightfield<br />
image does not give any clear contrast correspond<strong>in</strong>g<br />
to f<strong>in</strong>e coherent Cu precipit<strong>at</strong>es expected <strong>in</strong> this<br />
stage. This suggests th<strong>at</strong> Cu precipit<strong>at</strong>es, if any, is still<br />
coherent and they do not cause large stra<strong>in</strong> contrast due<br />
to the small stra<strong>in</strong> field around the precipit<strong>at</strong>e. In fact,<br />
the SADP taken from a martensite l<strong>at</strong>h does not show<br />
any evidence for a secondary phase, suggest<strong>in</strong>g th<strong>at</strong><br />
there is no precipit<strong>at</strong>es with the dist<strong>in</strong>ct structure different<br />
from the bcc m<strong>at</strong>rix. Figure 6 shows 3DAP elemental<br />
mapp<strong>in</strong>g of Cu and Cr obta<strong>in</strong>ed from the martensite<br />
phase. The Cu mapp<strong>in</strong>g clearly shows th<strong>at</strong> there<br />
is a small spherical particle enriched with Cu. On the<br />
other hand, the Cr mapp<strong>in</strong>g shows th<strong>at</strong> the distribution<br />
of Cr <strong>at</strong>oms is uniform martensite phase. The Cu el-<br />
Published <strong>in</strong> Metall. M<strong>at</strong>er. Trans. A. Vol. 30A, pp. 345-353. 1999<br />
emental map clearly shows th<strong>at</strong> there is Cu enriched<br />
precipit<strong>at</strong>e <strong>in</strong> this stage. As the SADP (Figure 5(b) and<br />
(c)) does not show any evidence for presence of the<br />
secondary phase, the Cu enriched precipit<strong>at</strong>e observe<br />
<strong>in</strong> the 3DAP d<strong>at</strong>a is believed to be fully coherent bcc-<br />
Cu. In order to quantify the concentr<strong>at</strong>ion of the particle,<br />
concentr<strong>at</strong>ion depth profile was measured from<br />
the selected region near the Cu-rich precipit<strong>at</strong>e as shown<br />
<strong>in</strong> Fig. 6 (c). The chemical composition of the Cu-rich<br />
precipit<strong>at</strong>es has been found to be 55 <strong>at</strong>.pct Cu, 30 <strong>at</strong>.pct<br />
Fe, 10 <strong>at</strong>. pct Cr, 5 <strong>at</strong>. pct Ni. It is seen th<strong>at</strong> Cr and Ni<br />
are rejected from the Cu-enriched particle slightly. It<br />
should also be noted th<strong>at</strong> the concentr<strong>at</strong>ion of Cu <strong>in</strong> the<br />
particle is significantly lower than th<strong>at</strong> expected from<br />
the equilibrium e-Cu.<br />
D. Ag<strong>in</strong>g for 100 h <strong>at</strong> 400°C<br />
Figure 7 (a) and (b) show 3DAP elemental mapp<strong>in</strong>g<br />
of Cu and Cr obta<strong>in</strong>ed from the martensite phase <strong>in</strong> the<br />
specimen aged for 100 h <strong>at</strong> 400°C. The Cu mapp<strong>in</strong>g<br />
shows th<strong>at</strong> a high density of Cu-rich precipit<strong>at</strong>es of approxim<strong>at</strong>ely<br />
3 nm <strong>in</strong> diameter is present. The Cr mapp<strong>in</strong>g<br />
shows th<strong>at</strong> the distribution of Cr <strong>at</strong>oms is no longer<br />
uniform and fluctu<strong>at</strong>ions of Cr concentr<strong>at</strong>ion occur.<br />
Concentr<strong>at</strong>ion depth profiles of Fe, Cr, Ni, Si and Cu<br />
were measured from a selected region cutt<strong>in</strong>g two Curich<br />
precipit<strong>at</strong>es as shown <strong>in</strong> Figure 6(c). The concentr<strong>at</strong>ion<br />
of Cu <strong>in</strong> the Cu-rich precipit<strong>at</strong>es is approxim<strong>at</strong>ely<br />
70 <strong>at</strong>. pct Cu, which is much higher than th<strong>at</strong> observed<br />
<strong>in</strong> the tempered specimen, but it is still lower than the<br />
equilibrium concentr<strong>at</strong>ion of the ε-Cu. The presence of<br />
fluctu<strong>at</strong>ions <strong>in</strong> Cr concentr<strong>at</strong>ion <strong>in</strong>dic<strong>at</strong>es th<strong>at</strong> the phase<br />
decomposition occurs <strong>in</strong> the martensite phase, and it<br />
decomposes to Fe-rich a and Cr-enriched α’ phases. The<br />
Cr concentr<strong>at</strong>ion <strong>in</strong> the α’ phase is only 25 <strong>at</strong>. pct and<br />
this is significantly lower than th<strong>at</strong> of equilibrium α’<br />
phase, suggest<strong>in</strong>g th<strong>at</strong> it is still <strong>in</strong> an <strong>in</strong>itial stage of the<br />
decomposition process. It should be noted th<strong>at</strong> there is<br />
no <strong>in</strong>dic<strong>at</strong>ion of partition<strong>in</strong>g of Ni.<br />
E. Ag<strong>in</strong>g for 5000 h <strong>at</strong> 400°C<br />
Figure 8 (a) shows a dark field image excited us<strong>in</strong>g<br />
the 1/2(110) reflection and Figures 8 (b) – (d) shows<br />
[001], [011], [111] zone SAD p<strong>at</strong>ters, respectively obta<strong>in</strong>ed<br />
from the martensite phase aged for 5000 hours<br />
<strong>at</strong> 400°C. Extra reflections <strong>in</strong>dic<strong>at</strong>e an ordered phase<br />
hav<strong>in</strong>g a cube-on-cube orient<strong>at</strong>ion rel<strong>at</strong>ionship precipit<strong>at</strong>es<br />
<strong>after</strong> prolonged ag<strong>in</strong>g. The dark field image which<br />
was taken us<strong>in</strong>g the 1/2(110) reflection shows a high<br />
density of f<strong>in</strong>e, ordered particles are dispersed <strong>in</strong> the<br />
martensite m<strong>at</strong>rix. The diffraction p<strong>at</strong>tern was found to<br />
be consistent with the G phase (structure type D8 , space a<br />
group Fm3m ) reported <strong>in</strong> aged duplex sta<strong>in</strong>less steels<br />
[23,26,27] [19] and type 308 sta<strong>in</strong>less steels .<br />
Figure 9 shows <strong>at</strong>om probe concentr<strong>at</strong>ion depth profiles<br />
obta<strong>in</strong>ed from the martensite phase <strong>in</strong> the alloy