Microstructural Evolution in a 17-4 PH Stainless Steel after Aging at ...
Microstructural Evolution in a 17-4 PH Stainless Steel after Aging at ...
Microstructural Evolution in a 17-4 PH Stainless Steel after Aging at ...

You also want an ePaper? Increase the reach of your titles
YUMPU automatically turns print PDFs into web optimized ePapers that Google loves.
Fe & Cr / <strong>at</strong>. %<br />
(a)<br />
(b)<br />
Ni<br />
Si<br />
Cu<br />
Cr<br />
Cu<br />
100<br />
80<br />
60<br />
40<br />
20<br />
0<br />
30<br />
15<br />
0<br />
30<br />
15<br />
0<br />
70<br />
50<br />
30<br />
10<br />
0<br />
~30nm<br />
0 5 10 15 20 25<br />
Depth / ~nm<br />
~9nm<br />
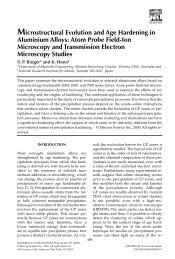
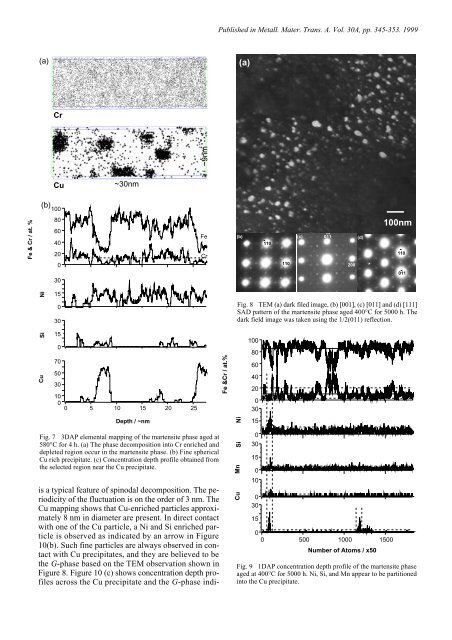
Fig. 7 3DAP elemental mapp<strong>in</strong>g of the martensite phase aged <strong>at</strong><br />
580°C for 4 h. (a) The phase decomposition <strong>in</strong>to Cr enriched and<br />
depleted region occur <strong>in</strong> the martensite phase. (b) F<strong>in</strong>e spherical<br />
Cu rich precipit<strong>at</strong>e. (c) Concentr<strong>at</strong>ion depth profile obta<strong>in</strong>ed from<br />
the selected region near the Cu precipit<strong>at</strong>e.<br />
is a typical fe<strong>at</strong>ure of sp<strong>in</strong>odal decomposition. The periodicity<br />
of the fluctu<strong>at</strong>ion is on the order of 3 nm. The<br />
Cu mapp<strong>in</strong>g shows th<strong>at</strong> Cu-enriched particles approxim<strong>at</strong>ely<br />
8 nm <strong>in</strong> diameter are present. In direct contact<br />
with one of the Cu particle, a Ni and Si enriched particle<br />
is observed as <strong>in</strong>dic<strong>at</strong>ed by an arrow <strong>in</strong> Figure<br />
10(b). Such f<strong>in</strong>e particles are always observed <strong>in</strong> contact<br />
with Cu precipit<strong>at</strong>es, and they are believed to be<br />
the G-phase based on the TEM observ<strong>at</strong>ion shown <strong>in</strong><br />
Figure 8. Figure 10 (c) shows concentr<strong>at</strong>ion depth profiles<br />
across the Cu precipit<strong>at</strong>e and the G-phase <strong>in</strong>di-<br />
Fe<br />
Cr<br />
Published <strong>in</strong> Metall. M<strong>at</strong>er. Trans. A. Vol. 30A, pp. 345-353. 1999<br />
Fe &Cr / <strong>at</strong>.%<br />
(a)<br />
(b)<br />
110<br />
110<br />
(c) 011<br />
200<br />
(d)<br />
100nm<br />
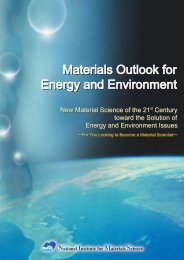
Fig. 8 TEM (a) dark filed image, (b) [001], (c) [011] and (d) [111]<br />
SAD p<strong>at</strong>tern of the martensite phase aged 400°C for 5000 h. The<br />
dark field image was taken us<strong>in</strong>g the 1/2(011) reflection.<br />
Ni<br />
Si<br />
Mn<br />
Cu<br />
100<br />
80<br />
60<br />
40<br />
20<br />
0<br />
30<br />
15<br />
0<br />
30<br />
15<br />
0<br />
10<br />
0<br />
30<br />
15<br />
0<br />
0 500 1000 1500<br />
Number of Atoms / x50<br />
Fig. 9 1DAP concentr<strong>at</strong>ion depth profile of the martensite phase<br />
aged <strong>at</strong> 400°C for 5000 h. Ni, Si, and Mn appear to be partitioned<br />
<strong>in</strong>to the Cu precipit<strong>at</strong>e.<br />
110<br />
011