Marine Ecosystem and Environment in the Tokyo Bay
Marine Ecosystem and Environment in the Tokyo Bay
Marine Ecosystem and Environment in the Tokyo Bay

You also want an ePaper? Increase the reach of your titles
YUMPU automatically turns print PDFs into web optimized ePapers that Google loves.
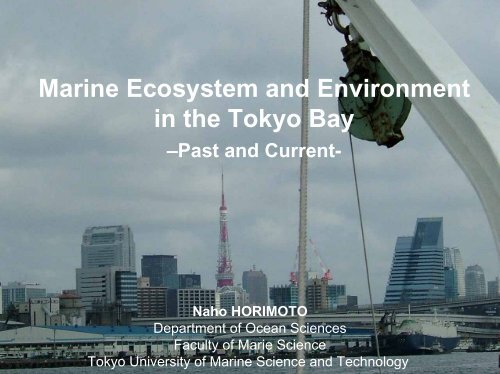
<strong>Mar<strong>in</strong>e</strong> <strong>Ecosystem</strong> <strong>and</strong> <strong>Environment</strong><br />
<strong>in</strong> <strong>the</strong> <strong>Tokyo</strong> <strong>Bay</strong><br />
–Past <strong>and</strong> Current-<br />
Naho HORIMOTO<br />
Department of Ocean Sciences<br />
Faculty of Marie Science<br />
<strong>Tokyo</strong> University of <strong>Mar<strong>in</strong>e</strong> Science <strong>and</strong> Technology
Moor<strong>in</strong>g operation <strong>and</strong> recovery<br />
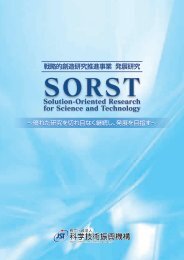
Real time measurement of Primary Productivity <strong>in</strong> Sagami <strong>Bay</strong><br />
(SORST - JST)<br />
Depth, Temperature, Sal<strong>in</strong>ity, In situ PAR,<br />
Chlorophyll fluorescence,<br />
Primary Productivity by Fast Reputation Rate of Fluorescence<br />
Underwater w<strong>in</strong>ch is designed<br />
that Buoy moves up <strong>and</strong><br />
down with Kevlar rope <strong>in</strong><br />
accordance with a time-table<br />
user programmed.<br />
Profil<strong>in</strong>g Data is send to <strong>the</strong><br />
Lab by email
CTD SYSTEM<br />
(Conductivity=sal<strong>in</strong>ity, Temperature <strong>and</strong> Depth)<br />
CTD Cast W<strong>in</strong>ch Control<br />
Steel Wire Armored Cable<br />
Water Sampl<strong>in</strong>g<br />
Slip r<strong>in</strong>g<br />
Deck Unit<br />
PC Operation
CTD Sensors<br />
Pressure<br />
(Depth)<br />
Conductivity<br />
(Sal<strong>in</strong>ity)<br />
Cradle for<br />
Nisk<strong>in</strong> Bottle<br />
Sampler<br />
Chlorophyll Fluorometer<br />
Temperature<br />
Dissolved Oxygen<br />
light quantum<br />
(Irradiance)<br />
Ma<strong>in</strong> Body<br />
Light Attenuation Coefficient<br />
(Turbidimeter)
Pressure (Depth, m)<br />
CTD Vertical Profile <strong>in</strong> 20th December 2005 at Sagami <strong>Bay</strong><br />
Temperature(oC)<br />
Sal<strong>in</strong>ity<br />
Temperature<br />
Dissolved Oxygen<br />
Sal<strong>in</strong>ity (Practical Sal<strong>in</strong>ity Unit)<br />
Dissolved Oxygen (ml/l)<br />
Turbidimeter (%)<br />
In vivo Chlorophyll (ug/l)<br />
light quantum<br />
Chlorophyll<br />
light quantum (uE/m3/s)<br />
Turbidimeter
DIN (µM)<br />
Si(OH) 4 -Si (µM) PO 4 -P (µM)<br />
75<br />
70<br />
65<br />
60<br />
55<br />
50<br />
45<br />
40<br />
35<br />
30<br />
25<br />
1.6<br />
1.4<br />
1.2<br />
1.0<br />
0.8<br />
0.6<br />
0.4<br />
50<br />
40<br />
30<br />
20<br />
10<br />
1989<br />
Result from Mastumura et al. (2001)<br />
F3<br />
F6<br />
1990 1991 1992 1993 1994 1995 1996 1997 1998<br />
Cocks-Start Test<br />
Trends of decrease<br />
(a=0.05)<br />
Changes <strong>in</strong> surface nutrient concentrations at Sta.F3 <strong>and</strong> F6
After Kawabe <strong>and</strong> Kawabe (1997)<br />
(Chemical Oxygen Dem<strong>and</strong>)<br />
Variation of surface COD <strong>and</strong> DIN, <strong>and</strong> solar radiation
Chl a (µg/l)<br />
Solar radiation (MJ/m 2 )<br />
DIN (µM)<br />
40<br />
30<br />
20<br />
10<br />
14<br />
13<br />
13<br />
12<br />
12<br />
11<br />
11<br />
75<br />
70<br />
65<br />
60<br />
55<br />
50<br />
45<br />
40<br />
35<br />
30<br />
25<br />
Result from Mastumura et al. (2001)<br />
F3<br />
F6<br />
1989 1990 1991 1992 1993 1994 1995 1996 1997 1998<br />
Variation of Chl a, solar radiation, <strong>and</strong> DIN at Sta. F3 <strong>and</strong> F6<br />
F3<br />
F6
Before 1950s<br />
Ceratium<br />
Occurrence Times<br />
Gonyaulax<br />
Red Tide (a decade AV)<br />
Red Tide<br />
Skeletonema<br />
Prorocentrum<br />
Chaetoceros<br />
Heterosigma<br />
1950-1970s 1980-1990s<br />
Blue Tide<br />
(a decade AV)<br />
Occurrences of red tide <strong>and</strong> blue tide<br />
Blue Tide
greatly <strong>in</strong>creased amounts of phosphorus or nitrogen<br />
enter<strong>in</strong>g an aquatic ecosystem from ei<strong>the</strong>r sewage<br />
systems or agricultural fertilizers<br />
Sulfur was educed due to<br />
oxidation of hydrogen<br />
sulfide, that color is light<br />
blue <strong>and</strong> t<strong>in</strong>t smells of<br />
sulfur<br />
P N<br />
Bottom anoxia <strong>and</strong> ext<strong>in</strong>ction of benthos<br />
Red Tide <strong>and</strong> Blue Tide<br />
Red tide <strong>and</strong><br />
End of bloom, phytoplankton accumulate on <strong>the</strong> sea<br />
bottom <strong>and</strong> microbes consume large amount of<br />
oxygen to decompose <strong>the</strong>m.<br />
Phytoplankton are microscopic, s<strong>in</strong>gle-celled plants.<br />
Phytoplankton is a primary producer <strong>in</strong> <strong>the</strong> ocean.<br />
Sou<strong>the</strong>rn w<strong>in</strong>d cause upwell<strong>in</strong>g
size<br />
0.2µm<br />
PICO<br />
2µm<br />
NANO<br />
20µm<br />
MICRO<br />
200µm<br />
Dissolved<br />
organic carbon<br />
Microbial loop<br />
Trophic transfer of carbon<br />
Diagram of a mar<strong>in</strong>e food cha<strong>in</strong><br />
Classic food cha<strong>in</strong><br />
MACRO
30<br />
Annual mean nitrate at <strong>the</strong> surface<br />
(source World Ocean Atlas @ NODC)<br />
L<br />
Open Ocean<br />
Small<br />
(µM)<br />
nutrient<br />
s<br />
Chl a<br />
0.1<br />
0.5 1 10<br />
Composite image of chlorophyll<br />
concentration <strong>in</strong> <strong>the</strong> ocean<br />
(source SEAWIFS project)<br />
Coastal +<br />
Upwell<strong>in</strong>g area<br />
Large<br />
How does phytoplankton biomass <strong>and</strong> species composition vary ?<br />
What size dom<strong>in</strong>ates with<strong>in</strong> each area?<br />
H<br />
Chl a<br />
(µg L -1 )