Observed climate changes in Croatia Climate change scenario
Observed climate changes in Croatia Climate change scenario
Observed climate changes in Croatia Climate change scenario

Create successful ePaper yourself
Turn your PDF publications into a flip-book with our unique Google optimized e-Paper software.
METEOROLOGICAL AND HYDROLOGICAL SERVICE OF CROATIA<br />
RESERCH AND DEVELOPMENT DIVISION<br />
CLIMATOLOGICAL RESEARCH AND APPLIED CLIMATOLOGY DEPARTMENT<br />
AGROMETEOROLOGICAL DEPARTMENT<br />
Fifth National Communication of the Republic of <strong>Croatia</strong> under the<br />
United Nation Framework Convention on the <strong>Climate</strong> Change<br />
(UNFCCC)<br />
Selected chapters:<br />
<strong>Observed</strong> <strong>climate</strong> <strong><strong>change</strong>s</strong> <strong>in</strong> <strong>Croatia</strong><br />
<strong>Climate</strong> <strong>change</strong> <strong>scenario</strong><br />
Impact of <strong>climate</strong> variations and <strong><strong>change</strong>s</strong> on plants and<br />
wildfire danger<br />
Zagreb, November 2009.
Content<br />
Page<br />
1. <strong>Observed</strong>. <strong>climate</strong> <strong><strong>change</strong>s</strong> <strong>in</strong> <strong>Croatia</strong> 2<br />
1.1. Air temperature 2<br />
1.2. Precipitation 9<br />
1.3. Dry spells 14<br />
2. <strong>Climate</strong> <strong>change</strong> <strong>scenario</strong> 18<br />
2.1. Introduction 18<br />
2.2. Upper level fields 21<br />
2.3. Surface fields 22<br />
2.4. Conclusions 27<br />
3. Impact of <strong>climate</strong> variations and <strong><strong>change</strong>s</strong> on plants and wildfire danger 37<br />
3.1. Impact of <strong>climate</strong> variations and <strong><strong>change</strong>s</strong> on plants 37<br />
3.2. Impact of <strong>climate</strong> <strong><strong>change</strong>s</strong> on wildfire danger 43<br />
Authors: Čedo Branković (chapter 2)<br />
Ksenija C<strong>in</strong>drić (chapter 1)<br />
Marjana Gajić-Čapka (chapter 1)<br />
Ivan Güttler (chapter 2)<br />
Mirta Patarčić (chapter 2)<br />
Lidija Srnec (chapter 2)<br />
Višnja Vučetić (chapter 3)<br />
Ksenija Zan<strong>in</strong>ović (chapter 1)<br />
1
1. <strong>Observed</strong> <strong>Climate</strong> Changes<br />
Detection of <strong>climate</strong> variations and <strong><strong>change</strong>s</strong> <strong>in</strong> air temperature and precipitation over the<br />
area of <strong>Croatia</strong> s<strong>in</strong>ce the beg<strong>in</strong>n<strong>in</strong>g of the 20 th century has been performed accord<strong>in</strong>g to the<br />
long-term meteorological measurements that started dur<strong>in</strong>g the 19 th century at meteorological<br />
stations <strong>in</strong> different <strong>climate</strong> regions: Osijek (cont<strong>in</strong>ental <strong>climate</strong>), Zagreb-Grič (cont<strong>in</strong>ental <strong>climate</strong><br />
under a mild maritime <strong>in</strong>fluence), Gospić (cont<strong>in</strong>ental <strong>climate</strong> of highland <strong>Croatia</strong> under a strong<br />
maritime <strong>in</strong>fluence), Crikvenica (maritime <strong>climate</strong> of eastern coast of the northern Adriatic) and<br />
Hvar (maritime <strong>climate</strong> of the Dalmatian area).<br />
Decadal trends dur<strong>in</strong>g the 20 th century as well as those till 2008 were compared <strong>in</strong> order<br />
to determ<strong>in</strong>e the differences that appeared due to the <strong><strong>change</strong>s</strong> <strong>in</strong> temperature and precipitation<br />
regimes at the beg<strong>in</strong>n<strong>in</strong>g of the 21 st century.<br />
1.1. Air temperature<br />
Increase of mean annual air temperature, which <strong>in</strong> the 20 th century was between +0.02°C<br />
per 10 years <strong>in</strong> Gospić up to +0.07°C per 10 years <strong>in</strong> Zagreb, cont<strong>in</strong>ued and amplified by the<br />
beg<strong>in</strong>n<strong>in</strong>g of the 21 st century (Table 1-1 and 1-2). In such way, decadal trends were proceed<strong>in</strong>g<br />
until 2004 with<strong>in</strong> the range from 0.04°C up to 0.08°C, and by 2008 between 0.05°C and 0.10°C.<br />
Prevail<strong>in</strong>g positive trend has become particularly expressed with<strong>in</strong> the last 50 years, even more<br />
with<strong>in</strong> the last 25 years (Figure 1-1, Table 1-1). Trends of mean annual air temperature with<strong>in</strong><br />
the 108-year period are statistically significant at all stations except for Osijek, while with<strong>in</strong> the<br />
last 50, i.e. 25 years at all observed stations. The positive temperature trends <strong>in</strong> the cont<strong>in</strong>ental<br />
part of <strong>Croatia</strong> is mostly due to w<strong>in</strong>ter trends (+0.06 °C/10 years <strong>in</strong> Osijek, +0.13 °C/10 years <strong>in</strong><br />
Zagreb and Gospić), while on the Adriatic to summer trends (+0.13 °C/10 years <strong>in</strong> Crikvenica<br />
and +0.07 °C/10 years <strong>in</strong> Hvar). The greatest trends were recorded <strong>in</strong> Zagreb; however, it<br />
should take <strong>in</strong>to account that such <strong>in</strong>crease is partially a result of the urban heat island.<br />
Consequence of the faster atmosphere warm<strong>in</strong>g up dur<strong>in</strong>g the last period of time is a result that<br />
out of ten warmest years s<strong>in</strong>ce the beg<strong>in</strong>n<strong>in</strong>g of the 20 th century 7 of them were recorded <strong>in</strong><br />
Zagreb, 6 <strong>in</strong> Gospić and Crikvenica, 5 <strong>in</strong> Hvar and 4 <strong>in</strong> Osijek (Table 1-3).<br />
2
Anomalies (°C)<br />
Anomalies (°C)<br />
Anomalies (°C)<br />
2.5<br />
2.0<br />
1.5<br />
1.0<br />
0.5<br />
0.0<br />
-0.5<br />
-1.0<br />
-1.5<br />
-2.0<br />
OSIJEK<br />
-2.5<br />
1900 1910 1920 1930 1940 1950 1960 1970 1980 1990 2000 2010<br />
Years<br />
2.5<br />
2.0<br />
1.5<br />
1.0<br />
0.5<br />
0.0<br />
-0.5<br />
-1.0<br />
-1.5<br />
-2.0<br />
ZAGREB-GRIČ<br />
-2.5<br />
1900 1910 1920 1930 1940 1950 1960 1970 1980 1990 2000 2010<br />
Years<br />
2.5<br />
2.0<br />
1.5<br />
1.0<br />
0.5<br />
0.0<br />
-0.5<br />
-1.0<br />
-1.5<br />
-2.0<br />
GOSPIĆ<br />
-2.5<br />
1900 1910 1920 1930 1940 1950 1960 1970 1980 1990 2000 2010<br />
Years<br />
Anomalies (°C)<br />
Anomalies (°C)<br />
2.5<br />
2.0<br />
1.5<br />
1.0<br />
0.5<br />
0.0<br />
-0.5<br />
-1.0<br />
-1.5<br />
-2.0<br />
CRIKVENICA<br />
-2.5<br />
1900 1910 1920 1930 1940 1950 1960 1970 1980 1990 2000 2010<br />
Years<br />
2.5<br />
2.0<br />
1.5<br />
1.0<br />
0.5<br />
0.0<br />
-0.5<br />
-1.0<br />
-1.5<br />
-2.0<br />
HVAR<br />
-2.5<br />
1900 1910 1920 1930 1940 1950 1960 1970 1980 1990 2000 2010<br />
Years<br />
19 19 19 19 19 19 19 20 20<br />
0010<br />
203040<br />
5060<br />
708090<br />
0010<br />
1901-2008<br />
1909-2008<br />
1934-2008<br />
1959-2008<br />
1984-2008<br />
Figure 1-1. Time series for the mean annual air temperature related 11-year b<strong>in</strong>omial<br />
mov<strong>in</strong>g averages, and trends for 108-, 100-, 75-, 50- and 25-year period. Unit is anomalies<br />
(°C) with respect to 1961-1990 average.<br />
Table 1-1. Trends <strong>in</strong> mean annual air temperature (°C/10 years) for 108-, 100-, 75-, 50and<br />
25-year period. Trends significant at the 5% level are bolded.<br />
Osijek<br />
Zagreb-<br />
Grič<br />
Gospić Crikvenica Hvar<br />
1901-2008 (108y) +0.05 +0.10 +0.06 +0.09 +0.06<br />
1909-2008 (100y) +0.04 +0.09 +0.07 +0.08 +0.05<br />
1934-2008 (75y) +0.05 +0.13 +0.09 +0.05 +0.06<br />
1959-2008 (50y) +0.23 +0.34 +0.32 +0.28 +0.12<br />
1984-2008 (25y) +0.52 +0.75 +0.69 +0.75 +0.35<br />
3
Table 1-2. Trends <strong>in</strong> mean annual and seasonal air temperature .(°C/10 years) Trends<br />
significant at the 5% level are bolded.<br />
Osijek Zagreb-<br />
Grič<br />
Gospić Crikvenica Hvar<br />
Mean air temperature trend 1901-2000<br />
(°C / 10 god<strong>in</strong>a)<br />
W<strong>in</strong>ter +0.04 +0.09 +0.10 +0.06 +0.04<br />
Spr<strong>in</strong>g +0.02 +0.07 +0.00 -0.01 +0.02<br />
Summer +0.03 +0.05 -0.03 +0.07 +0.03<br />
Autumn +0.03 +0.05 +0.00 +0.07 +0.05<br />
Year +0.03 +0.07 +0.02 +0.05 +0.04<br />
Mean air temperature trend 1901-2004<br />
(°C / 10 god<strong>in</strong>a)<br />
W<strong>in</strong>ter +0.04 +0.10 +0.11 +0.07 +0.04<br />
Spr<strong>in</strong>g +0.04 +0.09 +0.03 +0.02 +0.04<br />
Summer +0.05 +0.08 +0.02 +0.11 +0.06<br />
Autumn +0.03 +0.06 +0.02 +0.08 +0.06<br />
Year +0.04 +0.08 +0.04 +0.07 +0.05<br />
Mean air temperature trend 1901-2008<br />
(°C / 10 god<strong>in</strong>a)<br />
W<strong>in</strong>ter +0.06 +0.13 +0.13 +0.08 +0.04<br />
Spr<strong>in</strong>g +0.05 +0.11 +0.05 +0.04 +0.05<br />
Summer +0.06 +0.09 +0.04 +0.13 +0.07<br />
Autumn +0.03 +0.07 +0.03 +0.09 +0.05<br />
Year +0.05 +0.10 +0.06 +0.09 +0.06<br />
Table 1-3. The ten warmest years. Years from the period 1991-2008 are bolded<br />
Osijek Zagreb-Grič Gospić Crikvenica Hvar<br />
year °C year °C year °C year °C year °C<br />
2000 12.9 2000 13.8 2000 10.5 1950 16.0 1945 19.2<br />
2008 12.5 2007 13.6 2008 10.4 2000 15.9 1994 17.5<br />
2007 12.4 2008 13.4 2007 10.3 2007 15.9 2003 17.4<br />
1992 12.3 1994 13.3 1994 9.9 2008 15.8 2000 17.4<br />
1994 12.2 2002 13.2 2002 9.9 2003 15.8 1930 17.3<br />
1934 12.2 1992 13.0 1951 9.9 1951 15.7 2008 17.3<br />
1916 12.1 2003 12.9 1947 9.9 1949 15.7 2007 17.3<br />
1951 12.1 2006 12.7 1928 9.8 2002 15.7 1950 17.3<br />
2002 12.1 2001 12.7 2003 9.8 1943 15.6 2002 17.3<br />
1927 11.9 1950 12.7 2001 9.7 2001 15.6 1947 17.1<br />
4
Assum<strong>in</strong>g that the warm<strong>in</strong>g observed <strong>in</strong> mean air temperatures is a result of <strong><strong>change</strong>s</strong><br />
<strong>in</strong> frequencies of temperature extremes. Analysis of <strong><strong>change</strong>s</strong> <strong>in</strong> number of days, <strong>in</strong> which the<br />
air temperature exceeds some specific values, does not provide any comparison of observed<br />
characteristics <strong>in</strong> different <strong>climate</strong> conditions. Namely, frequency of cold (tm<strong>in</strong>
Table 1-4. Trends <strong>in</strong> <strong>in</strong>dices of temperature extremes (FD, Tn10%, Tx10%, SU, Tn90% and<br />
Tx90%) (number of days) accord<strong>in</strong>g to the reference period 1961-1990, and mean values of<br />
number of frost (FD) and summer (SU) days. Trends significant at the 5% level are bolded.<br />
Osijek<br />
Zagreb<br />
Grič<br />
Gospić Crikvenica Hvar<br />
Trend 1901-2000 (days / 10 years)<br />
FD +1.1 -0.9 +0.1 -0.7 0.0<br />
Tn10% -0.3 -0.3 -0.3 -0.3 +0.9<br />
Tx10% -1.1 -1.4 -0.5 -1.9 -5.4<br />
SU -0.2 0.0 -1.2 +1.0 +2.6<br />
Tn90% -0.5 +2.7 +0.6 +0.7 -0.8<br />
Tx90% -0.3 +0.5 -0.1 +1.4 +3.3<br />
Trend 1901-2004 (days / 10 years)<br />
FD +1.0 -0.9 +0.1 -0.8 -0.1<br />
Tn10% -0.4 -2.7 -0.6 -2.9 +0.5<br />
Tx10% -1.2 -1.7 -0.4 -2.0 -5.2<br />
SU 0.0 +0.1 -0.6 +0.1 +2.6<br />
Tn90% +0.1 +3.2 +1.3 +1.7 +0.4<br />
Tx90% 0.0 +1.2 +1.1 +1.6 +3.8<br />
Trend 1901-2008 (days / 10 years)<br />
FD +0.9 -0.1 -0.1 -0.8 -0.1<br />
Tn10% -0.6 -2.7 -0.8 -2.9 +0.2<br />
Tx10% -1.2 -1.7 -0.8 -1.9 -5.1<br />
SU 0.0 +0.3 -0.4 +1.1 +2.6<br />
Tn90% +0.6 +3.5 +1.9 +2.2 +1.0<br />
Tx90% +0.4 +1.8 +1.5 +1.8 +4.1<br />
Mean number of days <strong>in</strong> period 1961-1990.<br />
FD 88 60 120 18 5<br />
SU 90 61 47 84 110<br />
6
Tn10% (days)<br />
Tn10% (days)<br />
Tn10% (days)<br />
Tn10% (days)<br />
Tn10% (days)<br />
120<br />
100<br />
80<br />
60<br />
40<br />
20<br />
OSIJEK<br />
Trend = -0.6 days/10years<br />
0<br />
1900 1910 1920 1930 1940 1950 1960 1970 1980 1990 2000 2010<br />
Years<br />
120<br />
100<br />
80<br />
60<br />
40<br />
20<br />
ZAGREB - GRIČ<br />
Trend = -2.7 days/10years *<br />
0<br />
1900 1910 1920 1930 1940 1950 1960 1970 1980 1990 2000 2010<br />
Years<br />
120<br />
100<br />
80<br />
60<br />
40<br />
20<br />
GOSPIĆ<br />
Trend = -0.8 days/10years *<br />
0<br />
1900 1910 1920 1930 1940 1950 1960 1970 1980 1990 2000 2010<br />
Years<br />
120<br />
100<br />
80<br />
60<br />
40<br />
20<br />
CRIKVENICA<br />
Trend = -2.9 days/10years *<br />
0<br />
1900 1910 1920 1930 1940 1950 1960 1970 1980 1990 2000 2010<br />
Years<br />
120<br />
100<br />
80<br />
60<br />
40<br />
20<br />
HVAR<br />
Trend = 0.2 days/10years<br />
0<br />
1900 1910 1920 1930 1940 1950 1960 1970 1980 1990 2000 2010<br />
Years<br />
Tx10% (days)<br />
Tx10% (days)<br />
Tx10% (days)<br />
Tx10% (days)<br />
Tx10% (days)<br />
120<br />
100<br />
80<br />
60<br />
40<br />
20<br />
OSIJEK<br />
Trend = -1.2 days/10god *<br />
0<br />
1900 1910 1920 1930 1940 1950 1960 1970 1980 1990 2000 2010<br />
Years<br />
120<br />
100<br />
80<br />
60<br />
40<br />
20<br />
ZAGREB - GRIČ<br />
Trend = -1.7 days/10years<br />
0<br />
1900 1910 1920 1930 1940 1950 1960 1970 1980 1990 2000 2010<br />
Years<br />
120<br />
100<br />
80<br />
60<br />
40<br />
20<br />
GOSPIĆ<br />
Trend = -0.8 days/10years<br />
0<br />
1900 1910 1920 1930 1940 1950 1960 1970 1980 1990 2000 2010<br />
Years<br />
120<br />
100<br />
80<br />
60<br />
40<br />
20<br />
CRIKVENICA<br />
Trend = -1.9 days/10years *<br />
0<br />
1900 1910 1920 1930 1940 1950 1960 1970 1980 1990 2000 2010<br />
Years<br />
120<br />
100<br />
80<br />
60<br />
40<br />
20<br />
HVAR<br />
Trend = -5.1 days/10years *<br />
0<br />
1900 1910 1920 1930 1940 1950 1960 1970 1980 1990 2000 2010<br />
Years<br />
Figure 1-2. Time series for the number of days with m<strong>in</strong>imum (Tn10% - left) and maximum<br />
(Tx10% - right) air temperatures below the 10 th percentile, related b<strong>in</strong>omial mov<strong>in</strong>g averages<br />
and trends (* - trends significant at the 5% level). Period: 1901-2008<br />
7
Tn90% (days)<br />
Tn90% (days)<br />
Tn90% (days)<br />
Tn90% (days)<br />
Tn90% (days)<br />
120<br />
100<br />
80<br />
60<br />
40<br />
20<br />
OSIJEK<br />
Trend = +0.6 days/10years *<br />
0<br />
1900 1910 1920 1930 1940 1950 1960 1970 1980 1990 2000 2010<br />
Years<br />
120<br />
100<br />
80<br />
60<br />
40<br />
20<br />
ZAGREB - GRIČ<br />
Trend = +3.5 days/10years *<br />
0<br />
1900 1910 1920 1930 1940 1950 1960 1970 1980 1990 2000 2010<br />
Years<br />
120<br />
100<br />
80<br />
60<br />
40<br />
20<br />
GOSPIĆ<br />
Trend = +1.9 days/10years *<br />
0<br />
1900 1910 1920 1930 1940 1950 1960 1970 1980 1990 2000 2010<br />
Years<br />
120<br />
100<br />
80<br />
60<br />
40<br />
20<br />
CRIKVENICA<br />
Trend = +2.2 days/10years *<br />
0<br />
1900 1910 1920 1930 1940 1950 1960 1970 1980 1990 2000 2010<br />
Years<br />
120<br />
100<br />
80<br />
60<br />
40<br />
20<br />
HVAR<br />
Trend = +1.0 days/10years<br />
0<br />
1900 1910 1920 1930 1940 1950 1960 1970 1980 1990 2000 2010<br />
Years<br />
Tx90% (days)<br />
Tx90% (days)<br />
Tx90% (days)<br />
Tx90% (days)<br />
Tx90% (days)<br />
120<br />
100<br />
80<br />
60<br />
40<br />
20<br />
OSIJEK<br />
Trend = +0.4 days/10years<br />
0<br />
1900 1910 1920 1930 1940 1950 1960 1970 1980 1990 2000 2010<br />
Years<br />
120<br />
100<br />
80<br />
60<br />
40<br />
20<br />
ZAGREB - GRIČ<br />
Trend = +1.8 days/10years<br />
0<br />
1900 1910 1920 1930 1940 1950 1960 1970 1980 1990 2000 2010<br />
Years<br />
120<br />
100<br />
80<br />
60<br />
40<br />
20<br />
GOSPIĆ<br />
Trend = +1.5 days/10years<br />
0<br />
1900 1910 1920 1930 1940 1950 1960 1970 1980 1990 2000 2010<br />
Years<br />
120<br />
100<br />
80<br />
60<br />
40<br />
20<br />
CRIKVENICA<br />
Trend = +1.8 days/10years *<br />
0<br />
1900 1910 1920 1930 1940 1950 1960 1970 1980 1990 2000 2010<br />
Years<br />
120<br />
100<br />
80<br />
60<br />
40<br />
20<br />
HVAR<br />
Trend = +4.1 days/10years *<br />
0<br />
1900 1910 1920 1930 1940 1950 1960 1970 1980 1990 2000 2010<br />
Years<br />
Figure 1-3. Time series for the number of days with m<strong>in</strong>imum (Tn90% - left) and maximum<br />
(Tx90% - right) air temperatures above the 90th percentile, and related b<strong>in</strong>omial mov<strong>in</strong>g<br />
averages and trends (* - trends significant at the 5% level). Period: 1901-2008.<br />
8
1.2. Precipitation<br />
Dur<strong>in</strong>g the 20 th century annual amounts of precipitation showed a downward trend <strong>in</strong> all<br />
parts of <strong>Croatia</strong>, thus jo<strong>in</strong><strong>in</strong>g the trend of dry<strong>in</strong>g across the Mediterranean (Figure 1-4 and Table<br />
1-5). It is more expressed over the Adriatic (Crikvenica: -1.8% <strong>in</strong> 10 years, statistically significant<br />
and Hvar: -1.2% <strong>in</strong> 10 years), than <strong>in</strong> the <strong>in</strong>land (mounta<strong>in</strong>ous h<strong>in</strong>terlan– Gospić: -0.8% <strong>in</strong> 10<br />
years, eastern Slavonija, Osijek: -1.3% <strong>in</strong> 10 years, north-western <strong>Croatia</strong>, Zagreb-Grič: -0.3% <strong>in</strong><br />
10 years). These are the results of the seasonal precipitation trends which differ among regions.<br />
In the area of northern Adriatic (Crikvenica) decrease <strong>in</strong> all seasonal precipitation amounts has<br />
been observed, mostly expressed dur<strong>in</strong>g summer (-2.7% <strong>in</strong> 10 years), then <strong>in</strong> spr<strong>in</strong>g (-2.2% <strong>in</strong><br />
10 years) and w<strong>in</strong>ter (-1.8% <strong>in</strong> 10 years). On Dalmatian islands (Hvar) decrease <strong>in</strong> annual<br />
precipitation amounts is a result of decl<strong>in</strong>e <strong>in</strong> w<strong>in</strong>ter (-2.9% <strong>in</strong> 10 years) and spr<strong>in</strong>g (-2.0% <strong>in</strong> 10<br />
years) precipitation amounts. In the mounta<strong>in</strong>ous h<strong>in</strong>terland (Gospić on the Lika plateau) a<br />
decrease <strong>in</strong> w<strong>in</strong>ter (-2.7% <strong>in</strong> 10 years) and spr<strong>in</strong>g (-2.0% <strong>in</strong> 10 years) precipitation amounts is<br />
mostly expressed. The decl<strong>in</strong>e <strong>in</strong> annual amounts of precipitation over the area north of the<br />
Sava River results from decrease <strong>in</strong> spr<strong>in</strong>g (Osijek: -4.1% <strong>in</strong> 10 years and Zagreb-Grič: -1.1% <strong>in</strong><br />
10 years) and autumn (Osijek: -3.0% <strong>in</strong> 10 years and Zagreb-Grič: -1.4% <strong>in</strong> 10 years)<br />
precipitation amounts.<br />
Decadal trends <strong>in</strong> annual and seasonal precipitation amounts have not been significantly<br />
<strong>change</strong>d accord<strong>in</strong>g to data series prolonged by 2008 (Table 1-5). Less <strong><strong>change</strong>s</strong> are present with<br />
Osijek, where attenuation of negative spr<strong>in</strong>g precipitation trend was observed, but still rema<strong>in</strong><strong>in</strong>g<br />
statistically significant, as well as weaken<strong>in</strong>g of negative autumn precipitation trend and<br />
strengthen<strong>in</strong>g of positive summer trend. Negative spr<strong>in</strong>g precipitation trend weakened <strong>in</strong> the<br />
area of Hvar.<br />
Precipitation amounts have large <strong>in</strong>terannual variability, both on annual and seasonal<br />
scales. Therefore, <strong>in</strong> order to f<strong>in</strong>d out position of 10 driest years <strong>in</strong> the observed 108-year period,<br />
it can be seen that they do not occur grouped <strong>in</strong> some period. Dur<strong>in</strong>g the last 18 years, i.e. s<strong>in</strong>ce<br />
the beg<strong>in</strong>n<strong>in</strong>g of 1990’s, there was only one out of three driest years. 2003 is one of 10 driest<br />
years at all locations. Beside this year, there was 2000 <strong>in</strong> Osijek, 2007 and 1994 <strong>in</strong> Gospić and<br />
1992 <strong>in</strong> Hvar. (Table 1-6).<br />
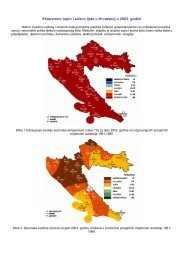
Variability of annual precipitation amounts <strong>in</strong> the period 1901-2008, expressed by time<br />
series of coefficients of variability, calculated for 30-year periods with one year shift, <strong>in</strong>dicates a<br />
decrease <strong>in</strong> Zagreb, Gospić and Crikvenica (Figure 1-4 right). Such a decrease was present <strong>in</strong><br />
Osijek by the end of the 20 th century as well, but the <strong><strong>change</strong>s</strong> s<strong>in</strong>ce the beg<strong>in</strong>n<strong>in</strong>g of the 21 st<br />
century contribute to an <strong>in</strong>crease of variability. In Hvar there was an <strong>in</strong>crease of variability <strong>in</strong> a<br />
period from the middle of the 20 th century.<br />
Change <strong>in</strong> precipitation regime patterns, which can result <strong>in</strong> precipitation decrease <strong>in</strong><br />
<strong>Croatia</strong>, can be also <strong>in</strong>dicated by tendency <strong>in</strong> frequency and <strong>in</strong>tensity of precipitation extremes<br />
def<strong>in</strong>ed by number of days <strong>in</strong> which the precipitation amount Rd exceeds def<strong>in</strong>ed thresholds (dry<br />
9
days, wet days and very wet days), i.e. part of annual precipitation amount occurr<strong>in</strong>g dur<strong>in</strong>g very<br />
ra<strong>in</strong>y days, annual maximum 5-day and 1-day precipitation amounts. Dry days are def<strong>in</strong>ed as<br />
days <strong>in</strong> which Rd
Table 1-6. Ten driest years. Years from the period 1991-2008 are bolded.<br />
Osijek Zagreb-Grič Gospić # Crikvenica Hvar<br />
year mm year mm year mm year mm year mm<br />
2000 316 1949 581 1983 910 1949 704 1983 384<br />
1921 422 1973 607 1953 973 1945 726 2003 431<br />
1983 467 1971 616 1949 1085 2003 752 1989 444<br />
1947 494 1927 624 1971 1091 1953 786 1913 461<br />
1953 500 2003 624 2003 1099 1971 835 1903 479<br />
1949 505 1921 651 2007 1109 1973 842 1977 496<br />
2003 517 1946 665 1989 1119 1956 850 1938 505<br />
1971 519 1942 671 1994 1121 1921 861 1946 542<br />
1928 522 1938 688 1975 1135 1983 877 1950 557<br />
1924 523 1911 691 1946 1136 1920 882 1992 563<br />
# s<strong>in</strong>ce 1924.<br />
Table 1-7. Trends <strong>in</strong> <strong>in</strong>dices of precipitation extremes (DD – dry days, R75% - wet days, R95% -<br />
very wet days, R95%T – annual precipitation fraction due to very wet days, Rx1d – annual 1-day<br />
precipitation maxima, Rx5d – annual 5-day precipitation maxima). Trends significant at the 5%<br />
level are bolded .<br />
Osijek<br />
Zagreb-<br />
Grič<br />
Gospić # Crikvenica Hvar<br />
Trend 1901-2000 (<strong>in</strong> 10 years)<br />
DD (dani) +0.9 +1.5 +1.6 +2.1 +1.1<br />
R75% (dani) -0.3 +0.0 -0.2 -0.5 -0.3<br />
R95% (dani) -0.1 +0.1 +0.1 -0.1 -0.0<br />
R95%T (%) -0.3 +0.4 +0.5 +0.1 +0.3<br />
Rx1d (mm) -0.4 +0.0 -1.3 +1.4 +0.5<br />
Rx5d (mm) -2.2 -0.4 -0.3 -2.7 -0.7<br />
Trend 1901-2008 (<strong>in</strong> 10 years)<br />
DD (dani) +1.0 +1.4 +1.4 +2.3 +1.1<br />
R75% (dani) -0.2 +0.1 -0.2 -0.5 -0.2<br />
R95% (dani) -0.1 +0.1 +0.0 -0.1 -0.0<br />
R95%T (%) -0.2 +0.3 +0.1 -0.0 +0.3<br />
Rx1d (mm) +0.2 -0.2 -1.4 +0.8 +0.9<br />
Rx5d (mm)<br />
# od 1924.<br />
-1.0 -0.6 +0.3 -2.4 +0.6<br />
11
Precipitation anomalies (mm)<br />
Precipitation anomalies (mm)<br />
Precipitation anomalies (mm)<br />
Precipitation anomalies (mm)<br />
Precipitation anomalies (mm)<br />
800<br />
700<br />
600<br />
500<br />
400<br />
300<br />
200<br />
100<br />
0<br />
-100<br />
-200<br />
-300<br />
-400<br />
-500<br />
OSIJEK<br />
P1961-1990= 651 mm<br />
Trend=-5.5mm/10years<br />
-600<br />
1900 1910 1920 1930 1940 1950<br />
Years<br />
1960 1970 1980 1990 2000 2010<br />
800<br />
700<br />
600<br />
500<br />
400<br />
300<br />
200<br />
100<br />
0<br />
ZAGREB - GRIČ<br />
P 1961-1990= 883 mm<br />
-100<br />
-200<br />
-300<br />
-400<br />
-500<br />
-600<br />
Trend=-2.7mm/10years<br />
1900 1910 1920 1930 1940 1950<br />
Years<br />
1960 1970 1980 1990 2000 2010<br />
800<br />
700 GOSPIĆ<br />
600<br />
500<br />
400<br />
300<br />
200<br />
100<br />
0<br />
-100<br />
-200<br />
-300<br />
P1961-1990= 1369 mm<br />
-400<br />
-500<br />
-600<br />
Trend=-14.3mm/10years<br />
1900 1910 1920 1930 1940 1950<br />
Years<br />
1960 1970 1980 1990 2000 2010<br />
800<br />
700<br />
600<br />
500<br />
400<br />
300<br />
200<br />
100<br />
0<br />
-100<br />
-200<br />
-300<br />
-400<br />
CRIKVENICA P1961-1990= 1243 mm<br />
-500<br />
-600<br />
Trend=-21.7mm/10years *<br />
1900 1910 1920 1930 1940 1950<br />
Years<br />
1960 1970 1980 1990 2000 2010<br />
800<br />
700<br />
600<br />
500<br />
400<br />
300<br />
200<br />
HVAR<br />
P 1961-1990= 730 mm<br />
100<br />
0<br />
-100<br />
-200<br />
-300<br />
-400<br />
-500<br />
-600<br />
Trend=-7.5mm/10years<br />
1900 1910 1920 1930 1940 1950<br />
Years<br />
1960 1970 1980 1990 2000 2010<br />
Coeficient of variation (c v)<br />
Coefficient of variation (c v)<br />
Coefficient of variation (c v)<br />
Coefficient of variation (c v)<br />
Coefficient of variation (c v)<br />
0.30<br />
0.25<br />
0.20<br />
0.15<br />
0.10<br />
0.30<br />
0.25<br />
0.20<br />
0.15<br />
0.10<br />
0.30<br />
0.25<br />
0.20<br />
0.15<br />
0.10<br />
0.30<br />
0.25<br />
0.20<br />
0.15<br />
0.10<br />
0.30<br />
0.25<br />
0.20<br />
0.15<br />
0.10<br />
1900<br />
1900<br />
1900<br />
1900<br />
1900<br />
OSIJEK<br />
CV1961-1990 = 0,16<br />
Trend = -0,003/10yrs *<br />
1910<br />
1910<br />
1920<br />
1920<br />
1930<br />
ZAGREB-GRIČ<br />
cv 1961-1990 = 0,15<br />
1930<br />
1940<br />
Trend = -0,010/10yrs *<br />
1910<br />
1920<br />
1930<br />
1940<br />
GOSPIĆ<br />
cv1961-1990 = 0,15<br />
Trend = -0,005/10yrs *<br />
CRIKVENICA<br />
cv 1961-1990 = 0.19<br />
1940<br />
Trend = -0.004/10yrs *<br />
1910<br />
1920<br />
1930<br />
HVAR<br />
cv1961-1990 = 0,21<br />
1940<br />
Trend = 0,029/10yrs *<br />
Figure 1-4. Time series for the annual precipitation amounts, related 11-year b<strong>in</strong>omial mov<strong>in</strong>g<br />
averages and trends (left), unit is anomalies (mm) with respect to 1961-1990 average). Time series for the<br />
coefficients of variation for 30-year periods with one year shift and trends (right). (* - trends significant at<br />
the 5% level). Period: 1901-2008 (Gospić: 1924-2008).<br />
1910<br />
1920<br />
1930<br />
1940<br />
1950<br />
1950<br />
1950<br />
1950<br />
1950<br />
1960<br />
Years<br />
1960<br />
Years<br />
1960<br />
Years<br />
1960<br />
Years<br />
1960<br />
Years<br />
1970<br />
1970<br />
1970<br />
1970<br />
1970<br />
1980<br />
1980<br />
1980<br />
1980<br />
1980<br />
1990<br />
1990<br />
1990<br />
1990<br />
1990<br />
2000<br />
2000<br />
2000<br />
2000<br />
2000<br />
2010<br />
2010<br />
2010<br />
2010<br />
2010<br />
12
Anomalies (days)<br />
Anomalies (days)<br />
Anomalies (days)<br />
Anomalies (days)<br />
Anomalies (days)<br />
40<br />
30<br />
20<br />
10<br />
0<br />
-10<br />
-20<br />
-30<br />
OSIJEK<br />
DD1961-1990=271days<br />
-40<br />
Trend=+1.0day/10yrs *<br />
-50<br />
1900 1910 1920 1930 1940 1950 1960 1970 1980 1990 2000 2010<br />
God<strong>in</strong>e<br />
40<br />
30<br />
20<br />
10<br />
0<br />
-10<br />
-20<br />
-30<br />
ZAGREB-GRIČ<br />
DD1961-1990=266days<br />
-40<br />
Trend=+1.4days/10yrs *<br />
-50<br />
1900 1910 1920 1930 1940 1950 1960 1970 1980 1990 2000 2010<br />
God<strong>in</strong>e<br />
40<br />
30<br />
20<br />
10<br />
0<br />
-10<br />
-20<br />
-30<br />
GOSPIĆ<br />
DD1961-1990=254days<br />
-40<br />
Trend=+1.4days/10yrs<br />
-50<br />
1900 1910 1920 1930 1940 1950 1960 1970 1980 1990 2000 2010<br />
God<strong>in</strong>e<br />
40<br />
30<br />
20<br />
10<br />
0<br />
-10<br />
-20<br />
-30<br />
CRIKVENICA<br />
DD1961-1990=268days<br />
-40<br />
Trend=+2.3days/10yrs *<br />
-50<br />
1900 1910 1920 1930 1940 1950 1960 1970 1980 1990 2000 2010<br />
God<strong>in</strong>e<br />
40<br />
30<br />
20<br />
10<br />
0<br />
-10<br />
-20<br />
-30<br />
HVAR<br />
DD1961-1990=288days<br />
-40<br />
Trend=+1.1day/10yrs *<br />
-50<br />
1900 1910 1920 1930 1940 1950 1960 1970 1980 1990 2000 2010<br />
God<strong>in</strong>e<br />
n (days)<br />
n (days)<br />
n (days)<br />
n (days)<br />
n (days)<br />
60<br />
50<br />
40<br />
30<br />
20<br />
10<br />
OSIJEK TrendR75=-0.2days/10yrs<br />
TrendR95=-0.1days/10yrs<br />
0<br />
1900 1910 1920 1930 1940 1950 1960 1970 1980 1990 2000 2010<br />
Years<br />
60<br />
50<br />
40<br />
30<br />
20<br />
10<br />
ZAGREB-GRIČ<br />
TrendR75=+0.1days/10yrs<br />
TrendR95=+0.1days/10yrs<br />
0<br />
1900 1910 1920 1930 1940 1950 1960 1970 1980 1990 2000 2010<br />
Years<br />
60<br />
50<br />
40<br />
30<br />
20<br />
10<br />
GOSPIĆ TrendR75=-0.2days/10yrs<br />
TrendR95=+0.0days/10yrs<br />
0<br />
1900 1910 1920 1930 1940 1950 1960 1970 1980 1990 2000 2010<br />
Years<br />
60<br />
50<br />
40<br />
30<br />
20<br />
10<br />
CRIKVENICA<br />
TrendR75=-0.5days/10yrs *<br />
TrendR95=-0.1days/10yrs<br />
0<br />
1900 1910 1920 1930 1940 1950 1960 1970 1980 1990 2000 2010<br />
Years<br />
60<br />
50<br />
40<br />
30<br />
20<br />
10<br />
HVAR TrendR75=-0.2days/10yrs<br />
TrendR95=-0.0days/10yrs<br />
0<br />
1900 1910 1920 1930 1940 1950 1960 1970 1980 1990 2000 2010<br />
Years<br />
Figure 1-5. Time series for the number of dry days (left), unit is anomalies (days) with respect to 1961-<br />
1990 average. On the right time series for the number of moderate wet days (Rd>R75% - above) and very<br />
wet days (Rd>R95% - below), related 11-year b<strong>in</strong>omial mov<strong>in</strong>g averages and trends (* - trends significant<br />
at the 5% level). Period: 1901-2008. (Gospić: 1924-2008).<br />
13
1.3. Dry spells<br />
Detected significant positive trend <strong>in</strong> number of dry days <strong>in</strong> the area of <strong>Croatia</strong> raises the<br />
question on frequency of consecutive dry days. Variations of dry sequences are analysed<br />
imploy<strong>in</strong>g daily precipitaiton data from the period 1961-2000 at 25 meteorological stations, which<br />
uniformly comprise ma<strong>in</strong> <strong>climate</strong> zones <strong>in</strong> <strong>Croatia</strong> (cont<strong>in</strong>ental, mounta<strong>in</strong> and maritime). Dry spell<br />
is def<strong>in</strong>ed as a sequence of days with daily precipitation amount (Rd) less than def<strong>in</strong>ed<br />
threshold. Seasonal and annual mean and maximum durations of dry spells have been analyzed<br />
for precipitation threshold of 1 mm and 10 mm. Trend is expressed as depature per decade <strong>in</strong><br />
relation to the respective long-term mean value.<br />
Results of trend analysis <strong>in</strong>dicate prevail<strong>in</strong>g <strong>in</strong>crease of mean annual duration of dry<br />
spells with Rd < 1 mm . It is statistically significant <strong>in</strong> Istria (5 to 6%/10years) and on southern<br />
islands (Hvar and Lastovo 5%/10years) (Figure 1-6). Increase of dry spells on annual basis is a<br />
result of prevail<strong>in</strong>g <strong>in</strong>crease <strong>in</strong> all seasons, except <strong>in</strong> autumn, when negative trend has been<br />
observed. The most significant <strong><strong>change</strong>s</strong> have been detected <strong>in</strong> spr<strong>in</strong>g, especially <strong>in</strong> northern<br />
Adriatic (8 to 11%/10years). Analysis of annual maximum dry spells with Rd < 1 mm does not<br />
reveal any significant positive or negative trend <strong>in</strong> <strong>Croatia</strong> (Figure 1-6). Positive trend prevails <strong>in</strong><br />
spr<strong>in</strong>g and it is statistically significant <strong>in</strong> northern Adriatic (9 to 11%/10years), while negative<br />
trend prevails <strong>in</strong> autumn, which is significant only <strong>in</strong> Rijeka, Šibenik and Osijek (9 to<br />
12%/10years).<br />
Analysis of annual mean durations of dry spells for daily precipitation threshold of 10 mm<br />
<strong>in</strong>dicates prevail<strong>in</strong>g positive trend <strong>in</strong> <strong>Croatia</strong>, significant <strong>in</strong> Istria and Dubrovnik (6 to 8%/10years)<br />
(Figure 1-6). Negative, but statistically <strong>in</strong>significant trend has been observed only <strong>in</strong> lowlands of<br />
<strong>Croatia</strong>. Statistical significance of trend at annual scale is mostly forced by w<strong>in</strong>ter and summer<br />
significant <strong>in</strong>crease of mean dry spells. Still, positive trend, statistically the most significant one,<br />
has been observed <strong>in</strong> spr<strong>in</strong>g; while <strong>in</strong> autumn, durations of mean dry spells with Rd < 10 mm<br />
decl<strong>in</strong>e, especially <strong>in</strong> the area of Slavonija (10 to 11%/10years). Maximum dry spells have be<strong>in</strong>g<br />
<strong>in</strong>creased along the coast (10 to 11 %/10years), while reduced <strong>in</strong> the <strong>in</strong>land (8 %/10years)<br />
(Figure 1-7). Such annual trend of maximum dry spells is mostly contributed by summer<br />
variations. Prevail<strong>in</strong>g <strong>in</strong>crease of dry spells at the Adriatic, as well as poorly expressed trend <strong>in</strong><br />
the cont<strong>in</strong>ental area contribute to the fact that <strong>Croatia</strong> rema<strong>in</strong>s with<strong>in</strong> the transitional area<br />
between the northern Europe with general tendency of precipitation <strong>in</strong>crease, and the dry<strong>in</strong>g<br />
Mediterranean.<br />
14
Figure 1-6. Trend results of mean dry spells for the precipitation threshold of 1 mm (left column) and 10<br />
mm (right column), for seasons (upper four rows) and a year (lower row). Circles <strong>in</strong>dicate positive trend,<br />
triangles negative trend, while symbols <strong>in</strong> bold type <strong>in</strong>dicate statistically significant trend. Size of symbols<br />
is proportional to the absolute value of <strong>change</strong> per decade relative to the respective average: 1-<br />
5%/10years, 5-10%/10 years and larger than 10%. Squares <strong>in</strong>dicate trend between +/- 1%/10years.<br />
15
Figure 1-7. Trend results for maximum durations of dry spells for precipitation threshold of 1 mm (left<br />
column) and 10 mm (right column), for seasons (upper four rows) and a year (lower row). Circles <strong>in</strong>dicate<br />
positive trend, triangles negative trend, while symbols <strong>in</strong> bold type <strong>in</strong>dicate statistically significant trend.<br />
Size of symbols is proportional to the absolute value of <strong>change</strong> per decade relative to the respective<br />
average: 1-5%/10years, 5-10%/10 years and larger than 10%. Squares <strong>in</strong>dicate trend between +/-<br />
1%/10years.<br />
16
References:<br />
Anagnostopoulou C, Maheras P, Karacostas T, Vafiadis M (2003) Spatial and temporal analysis of dry<br />
spells <strong>in</strong> Greece. Theor Appl Climatol 74: 77-91<br />
C<strong>in</strong>drić, K. (2006): The statistical analysis of wet and dry spells <strong>in</strong> <strong>Croatia</strong> by b<strong>in</strong>ary DARMA (1,1) model.<br />
Hrv. meteor čas., 41, 43-51<br />
C<strong>in</strong>drić K. (2006) The statistical analysis of wet and dry days by b<strong>in</strong>ary DARMA (1,1) model <strong>in</strong> Split,<br />
<strong>Croatia</strong>. BALWOIS – Conference on Water observation and Information System for Decision<br />
Support, 23-26.5.2006., Ohrid, Macedonia, M<strong>in</strong>istry of Education and Science of Republic of<br />
Macedonia: A-239.<br />
C<strong>in</strong>drić, K., Pasarić, Z., Gajić-Čapka, M. (2009) Spatial and temporal analysis of dry spells <strong>in</strong> <strong>Croatia</strong>.<br />
Theor Appl Climatol (predano)<br />
Gajić-Čapka M (2006) Trends <strong>in</strong> <strong>in</strong>dices of precipitation extremes <strong>in</strong> <strong>Croatia</strong>, 1901-2004 Sixth European<br />
Conference on Applied Climatology (ECAC), Ljubljana, Slovenia, 4-8 September 2006, Abstracts,<br />
A-00471<br />
Gilbert RO (1987) Statistical methods for environmental pollution monitor<strong>in</strong>g. John Wiley & Sons, Inc.,<br />
New York<br />
Juras J, Jurčec V (1976) The statistical analysis of dry and wet spells by the application of Markov cha<strong>in</strong><br />
probability model (<strong>in</strong> <strong>Croatia</strong>n). Papers, RHMZ Hrvatske, 13: 59-98<br />
Kle<strong>in</strong> Tank, A.M.G., Können, G.P., 2003: Trends <strong>in</strong> Indices of Daily Temperature and Precipitation<br />
Extremes <strong>in</strong> Europe, 1946-99, J. <strong>Climate</strong>, 16, 3665-3680<br />
Lana X, Mart<strong>in</strong>ez M D, and Burgueno A, Serra C, Mart<strong>in</strong>-Vide and Gomez L (2008) Spatial and temporal<br />
patterns of dry spell lengths <strong>in</strong> the Iberian Pen<strong>in</strong>sula for the second half of the twentieth century.<br />
Theor Appl Climatol 91: 99-116<br />
Meehl, GA, Stocker TF, Coll<strong>in</strong>s WD, Friedl<strong>in</strong>gste<strong>in</strong> P, Gaye AT, Gregory JM, Kitoh A, Knutti R, Murphy<br />
JM, Noda A, Raper SCB, Watterson IG, Weaver AJ, Zhao Z-C (2007) Global <strong>Climate</strong> Projections.<br />
In: Solomon S, Q<strong>in</strong> D, Mann<strong>in</strong>g M, Chen Z, Marquis M, Averyt KB, Tignor M, Miller HL (eds)<br />
<strong>Climate</strong> Change 2007: The Physical Science Basis. Contribution of Work<strong>in</strong>g Group 1 to the Fourth<br />
Assessment Report of the Intergovernmental Panel on <strong>Climate</strong> Change, Cambridge University<br />
Press, Cambridge, United K<strong>in</strong>gdom and New York, NY, USA.<br />
Peterson, T. et al, 2001: Report on the activities of the work<strong>in</strong>g group on <strong>climate</strong> <strong>change</strong> detection and<br />
related rapporteurs, WCDMP - No. 47<br />
Sen PK (1968) Esitmates of the regression coefficient based on Kedall’s tau. J Am Stat Assoc 63: 1379-<br />
1389<br />
Serra C, Burgueno A, Mart<strong>in</strong>ez MD and Lana X (2006) Trends <strong>in</strong> dry spells across Catalonia (NE Spa<strong>in</strong>)<br />
dur<strong>in</strong>g the second half of the 20th century. Theor Appl Climatol, 85: 165-183<br />
Schmidli J, Frei C (2005) Trends of heavy precipitation and wet and dry spells <strong>in</strong> Switzerland dur<strong>in</strong>g the 20<br />
th century. Int J Climatol 25: 753-771<br />
WMO, 2004: Report of the CCI/CLIVAR expert team on <strong>climate</strong> <strong>change</strong> detection, monitor<strong>in</strong>g and <strong>in</strong>dices<br />
(ETCCDMI), WCDMP - No. 54.<br />
Zan<strong>in</strong>ović, K., 2006: Trends <strong>in</strong> <strong>in</strong>dices of temperature extremes <strong>in</strong> <strong>Croatia</strong>, 1901-2004, Sixth European<br />
Conference on Applied Climatology (ECAC), Ljubljana, Slovenia, 4-8 September 2006, CD,<br />
Abstracts, A-00470<br />
Zan<strong>in</strong>ović, K., Gajić-Čapka, M., Perčec Tadić, M. et al, 2008: Klimatski atlas Hrvatske / <strong>Climate</strong> atlas of<br />
<strong>Croatia</strong> 1961-1990., 1971-2000. Državni hidrometeorološki zavod, Zagreb, 200 str.<br />
17
2. <strong>Climate</strong> Change Scenario<br />
2.1. Introduction<br />
2.1.1 General remarks<br />
Information on global <strong>climate</strong> <strong>change</strong> of the mean value of some climatological<br />
parameter, temperature for example, is not sufficient to estimate <strong>climate</strong> <strong>change</strong> at regional or<br />
local level. The <strong>in</strong>tensity of local <strong>climate</strong> <strong>change</strong> can differ from the <strong>change</strong> of global mean value<br />
because of specific latitude, topographic features, distribution of land and sea, etc. However,<br />
local <strong>climate</strong> <strong>change</strong> should be viewed with<strong>in</strong> the context of global <strong>change</strong> modulated by local<br />
impacts. In this report the results of dynamical downscal<strong>in</strong>g by a regional <strong>climate</strong> model for the<br />
two 30-year periods are described and discussed – for the <strong>climate</strong> of the 20 th century and the<br />
future <strong>climate</strong> from the 21 st century, accord<strong>in</strong>g to the A2 <strong>scenario</strong> of Intergovernmental Panel on<br />
<strong>Climate</strong> Change (IPCC).<br />
Dynamical downscal<strong>in</strong>g is the method that adjusts the output of a global <strong>climate</strong> model to<br />
a smaller area by the help of a regional <strong>climate</strong> model. Thus, the results of <strong>climate</strong> <strong>change</strong> at a<br />
relatively coarse resolution (200-300 km) are be<strong>in</strong>g adjusted to much f<strong>in</strong>er space resolution (20-<br />
50 km). In this process a regional model def<strong>in</strong>es its “own” hydro- and thermo-dynamical<br />
processes at smaller scales, adjust<strong>in</strong>g to the boundary forc<strong>in</strong>g from a global model. In such a<br />
way, dynamical consistency <strong>in</strong> the modelled atmosphere is be<strong>in</strong>g achieved. Space variations of<br />
<strong>climate</strong> parameters are better represented at smaller scales by dynamical downscal<strong>in</strong>g,<br />
especially extreme events, whose <strong>in</strong>tensity <strong>in</strong> global models is usually weakened as the smallest<br />
grid box of few hundred kilometres can cover the whole region of <strong>in</strong>terest. The alternatives to<br />
dynamical downscal<strong>in</strong>g are statistical downscal<strong>in</strong>g methods, but they do not take <strong>in</strong>to account<br />
the dynamical connection between global and regional scales.<br />
Although def<strong>in</strong>ed for smaller areas and f<strong>in</strong>er resolution, regional <strong>climate</strong> models cannot<br />
improve possible poor results of global models. Of course, vice versa is valid as well –<br />
dynamical downscal<strong>in</strong>g by a poor regional <strong>climate</strong> model cannot improve the global model<br />
simulation regardless of the resolution improvement. In other words, the quality of dynamical<br />
downscal<strong>in</strong>g results depends on the quality of regional model used for dynamical downscal<strong>in</strong>g<br />
as well as on the quality of global model results.<br />
It should be po<strong>in</strong>ted out that the results of a regional <strong>climate</strong> model cannot accurately<br />
describe observational data at regional (local) scale. Of course, it is important that the difference<br />
between model results and observations would be as small as possible, but, as model offers<br />
only approximation of the actual situation, it <strong>in</strong>evitably conta<strong>in</strong>s errors. Accord<strong>in</strong>gly, a good<br />
model is the one with relatively small (systematic) errors. After compar<strong>in</strong>g the model results with<br />
18
observations, by which the modelled <strong>climate</strong> “state” of the atmosphere for the 20 th century is<br />
determ<strong>in</strong>ed, differences between the future model <strong>climate</strong> and 20 th century <strong>climate</strong> have been<br />
analysed. Such differences primarily po<strong>in</strong>t out to qualitative assessment of <strong>climate</strong> <strong>change</strong>. Due<br />
to a number of uncerta<strong>in</strong>ties, quantitative <strong>climate</strong> <strong>change</strong> assessments should be taken with<br />
caution. However, they are necessary <strong>in</strong> order to execute concrete adaptation and mitigation<br />
measures to <strong>climate</strong> <strong>change</strong> effects. For example, one of key uncerta<strong>in</strong>ties <strong>in</strong> <strong>climate</strong> <strong>change</strong> is<br />
the def<strong>in</strong>ition of future <strong>scenario</strong>s given by IPCC (see chapter 2.1.4). This uncerta<strong>in</strong>ty is not a<br />
result of our lack of understand<strong>in</strong>g of <strong>climate</strong> system, but a fact that human activities and their<br />
possible impact on a future <strong>climate</strong> should be observed through complex and unpredictable<br />
<strong>in</strong>teractions.<br />
2.1.2 Global model, regional model and dynamical downscal<strong>in</strong>g<br />
Dynamical downscal<strong>in</strong>g has been applied to the results of the EH5OM global model,<br />
<strong>in</strong>cluded <strong>in</strong> the IPCC Fourth Assessment Report (AR4). EH5OM is a coupled atmospheric and<br />
oceanic model developed at Max Planck Institute for Meteorology, Hamburg, Germany. Details<br />
of EH5OM are given <strong>in</strong> Roeckner et al. (2003). The EH5OM simulation of the 20 th century<br />
<strong>climate</strong> was performed for three different realisations, which differ <strong>in</strong> a def<strong>in</strong>ition of <strong>in</strong>itial<br />
conditions. In such a way, sensitivity of <strong>climate</strong> model to <strong>in</strong>itial conditions is accounted for. For<br />
the A2 <strong>scenario</strong> there are also three model realisations available, each of them be<strong>in</strong>g the<br />
cont<strong>in</strong>uation of the current <strong>climate</strong>.<br />
The IPCC <strong>scenario</strong>s for some future period (see Nakićenović et al. 2000) def<strong>in</strong>e general<br />
assumptions, which <strong>climate</strong> models should take <strong>in</strong>to consideration after they have been adapted<br />
to a model. The A2 <strong>scenario</strong> assumes the growth of global population to 15 billion by 2100, a<br />
moderate economic growth, very high energy consumption and variable hydrocarbons (gas, oil,<br />
coal) consumption, as well as moderate to significant arable land usage. These projections are<br />
then adapted to a model as the concentrations of greenhouse gases and ozone. The A2<br />
<strong>scenario</strong> is also called the strong forc<strong>in</strong>g <strong>scenario</strong> because it predicts the most unfavourable<br />
conditions that could occur to the environment – it represents the upper limit of anthropogenic<br />
impact to the atmosphere and <strong>climate</strong> <strong>in</strong> this century.<br />
For this report, the results of dynamical downscal<strong>in</strong>g by so-called Regional <strong>Climate</strong><br />
Model of the third generation (RegCM3), have been used. RegCM was developed by Dick<strong>in</strong>son<br />
et al. (1989) and Giorgi (1990). The detailed description of the model version used here is given<br />
<strong>in</strong> Pal et al. (2007). In our experiments the Grell convection scheme (Grell 1993) has been<br />
applied along with the Fritsch-Chappel closure (Fritsch and Chappel, 1980). The model<br />
horizontal resolution is 35 km <strong>in</strong> the area with 126 X 88 po<strong>in</strong>ts centred at 46ºN, 7.5ºE and cover<br />
central and eastern Europe and a large part of the Mediterranean. In the vertical, there are 23<br />
19
levels with the highest level at 100 hPa. Boundary conditions, taken from the EH5OM model,<br />
were updated every 6 hours. Dynamical downscal<strong>in</strong>g is performed for all three realisations of the<br />
EH5OM global model for 20 th century <strong>climate</strong> and for future <strong>climate</strong> accord<strong>in</strong>g to the IPCC A2<br />
<strong>scenario</strong>.<br />
2.1.3 Selection of periods and seasons<br />
Seasonal mean values for all climatological seasons have been used <strong>in</strong> the analysis of<br />
<strong>climate</strong> <strong>change</strong>, while for upper-air fields only the results for w<strong>in</strong>ter and summer have been<br />
shown. For w<strong>in</strong>ter, seasonal mean values were calculated for December-January-February<br />
(DJF) period, for spr<strong>in</strong>g for March-April-May (MAM) period, etc. Mean values of the 30-year<br />
period of future <strong>climate</strong> (2041-2070) have been compared with mean values of the 30-year<br />
period of the 20 th century <strong>climate</strong> (1961-1990). For each parameter and season, statistical<br />
significance of the <strong>change</strong> <strong>in</strong> the mean value between future and 20 th century <strong>climate</strong> has been<br />
calculated. It is based on the test<strong>in</strong>g of the null-hypothesis where the mean values of future and<br />
current <strong>climate</strong> “populations” do not differ. The null-hypothesis is accepted or rejected at the<br />
95% confidence level. In addition to mean values, <strong>in</strong>terannual variability with<strong>in</strong> each 30-year<br />
period has been calculated as well. The <strong>change</strong> <strong>in</strong> variability is expressed as a difference <strong>in</strong><br />
standard deviation between future and 20 th century <strong>climate</strong>, calculated from all three model<br />
realisations. From the <strong>change</strong> <strong>in</strong> mean value and variability, the <strong>change</strong> of extreme values for<br />
the given parameter can be <strong>in</strong>directly assessed.<br />
2.1.4 Uncerta<strong>in</strong>ties <strong>in</strong> <strong>climate</strong> modell<strong>in</strong>g<br />
An estimate of uncerta<strong>in</strong>ty <strong>in</strong> the assessment of future <strong>climate</strong> <strong>change</strong>, <strong>in</strong> particular at<br />
regional scale, is an important aspect of the <strong>climate</strong> <strong>change</strong> analysis. Uncerta<strong>in</strong>ty can be<br />
attributed to the follow<strong>in</strong>g factors: firstly, uncerta<strong>in</strong>ty due to <strong>in</strong>herent (<strong>in</strong>ternal) variability of<br />
<strong>climate</strong> system; secondly, uncerta<strong>in</strong>ty <strong>in</strong> def<strong>in</strong><strong>in</strong>g the future <strong>climate</strong> <strong>scenario</strong>s; and thirdly,<br />
modell<strong>in</strong>g uncerta<strong>in</strong>ty because of approximations <strong>in</strong> represent<strong>in</strong>g processes <strong>in</strong> the atmosphere<br />
and oceans. Relative significance of each of the above factors varies on how far we reach <strong>in</strong>to<br />
the future, as well as on spatial and time averag<strong>in</strong>g scales (Hawk<strong>in</strong>s and Sutton 2009). For<br />
example, at the regional level, for multi-decade time scales, dom<strong>in</strong>ant source of uncerta<strong>in</strong>ty is<br />
uncerta<strong>in</strong>ty <strong>in</strong> modell<strong>in</strong>g and uncerta<strong>in</strong>ty of the given <strong>scenario</strong>. For smaller time scales, model<br />
and <strong>in</strong>herent variability of <strong>climate</strong> system represent the ma<strong>in</strong> cause of uncerta<strong>in</strong>ty. This report<br />
does not <strong>in</strong>clude explicit assessment of uncerta<strong>in</strong>ties of <strong>climate</strong> <strong>in</strong>tegrations by regional model.<br />
However, some results of regional model were compared with the results of global model, thus<br />
enabl<strong>in</strong>g to evaluate, at least partly, to what extent the uncerta<strong>in</strong>ty of <strong>climate</strong> <strong>change</strong> could be<br />
attributed to different modell<strong>in</strong>g approaches.<br />
20
2.2. Upper-level fields<br />
<strong>Climate</strong> <strong>change</strong> of the large-scale circulation, analyzed from the EH5OM global <strong>climate</strong><br />
model, is discussed <strong>in</strong>, for example, Branković et al. (2010). We briefly summarize some of<br />
general features of global <strong>change</strong>, as <strong>climate</strong> <strong>change</strong> for a wider region of <strong>Croatia</strong> should not be<br />
analysed separately from global <strong>change</strong>. Here, the comparison with the results of EH5OM<br />
<strong>climate</strong> model is appropriate, as these results are used to def<strong>in</strong>e <strong>in</strong>itial and boundary conditions<br />
<strong>in</strong> dynamical downscal<strong>in</strong>g by RegCM.<br />
Global warm<strong>in</strong>g <strong>in</strong> EH5OM model is relatively uniform <strong>in</strong> the upper troposphere and it is<br />
associated with the strengthen<strong>in</strong>g of the upper-air westerlies with<strong>in</strong> the jet stream core. The<br />
largest <strong>in</strong>crease of surface temperature <strong>in</strong> Europe is <strong>in</strong> w<strong>in</strong>ter <strong>in</strong> the north-eastern part (over 3<br />
°C), while <strong>in</strong> summer is larger than 3.5 °C <strong>in</strong> the southern Europe and the Mediterranean. The<br />
amplitude of warm<strong>in</strong>g is larger than model systematic error, whereas the spread with<strong>in</strong> the three<br />
model realisations is smaller than the amplitude of <strong>climate</strong> <strong>change</strong>. For precipitation, however,<br />
such a conclusion is not valid, <strong>in</strong>dicat<strong>in</strong>g a large uncerta<strong>in</strong>ty <strong>in</strong> the assessment of future<br />
hydrological balance.<br />
Similar to global warm<strong>in</strong>g, an <strong>in</strong>crease <strong>in</strong> temperature <strong>in</strong> future <strong>climate</strong> by the middle of<br />
the 21 st century, i.e. the warm<strong>in</strong>g throughout the entire troposphere is evident <strong>in</strong> RegCM (Fig. 2-<br />
1). In south Europe and the Mediterranean warm<strong>in</strong>g is larger <strong>in</strong> summer than <strong>in</strong> w<strong>in</strong>ter, while the<br />
largest <strong>in</strong>ter-seasonal difference is <strong>in</strong> the south-western Europe. In summer, at the 850-hPa level<br />
(T850, at approx. 1.5 km altitude) the Mediterranean and south Europe (particularly the Iberian<br />
Pen<strong>in</strong>sula) are clearly identified with warm<strong>in</strong>g larger than <strong>in</strong> the other areas of the <strong>in</strong>tegration<br />
doma<strong>in</strong> (Fig. 2-1d). In w<strong>in</strong>ter, a uniform warm<strong>in</strong>g is seen through the entire troposphere, while <strong>in</strong><br />
summer the warm<strong>in</strong>g is slightly larger at the lower than at higher layers. The differences<br />
between the future and the 20 th -century <strong>climate</strong> <strong>in</strong> Fig. 2-1 are statistically significant even at the<br />
99% confidence level with<strong>in</strong> entire <strong>in</strong>tegration doma<strong>in</strong>.<br />
In accordance with temperature <strong>in</strong>crease, an <strong>in</strong>crease <strong>in</strong> geopotential is found throughout<br />
the troposphere. The meridional gradients <strong>in</strong> temperature differences at 200 hPa (Fig. 2-1 a,b)<br />
<strong>in</strong>dicate that high-altitude w<strong>in</strong>d above Europe will be <strong>in</strong>tensified <strong>in</strong> future <strong>climate</strong> <strong>in</strong> both seasons.<br />
This strengthen<strong>in</strong>g of the high-altitude w<strong>in</strong>d <strong>in</strong> w<strong>in</strong>ter will occur practically over the entire Europe,<br />
but it will be strongest <strong>in</strong> the western part along with the Atlantic. These <strong><strong>change</strong>s</strong> are statistically<br />
significant <strong>in</strong> the entire <strong>in</strong>tegration doma<strong>in</strong>. Similar situation, but with a reduced <strong>in</strong>crease <strong>in</strong> the<br />
w<strong>in</strong>d amplitude, can be found <strong>in</strong> the lower troposphere. P<strong>in</strong>to et al. (2007) associated such an<br />
<strong>in</strong>tensified w<strong>in</strong>d <strong>in</strong> the Atlantic storm path dur<strong>in</strong>g w<strong>in</strong>ter with an <strong>in</strong>creased cyclonic activity <strong>in</strong><br />
future <strong>climate</strong>. In summer, the <strong>in</strong>tensification of the upper-level w<strong>in</strong>ds is more pronounced <strong>in</strong> the<br />
21
northern part of the doma<strong>in</strong>, whereas above our areas the northern w<strong>in</strong>d component will be<br />
strengthened, although the westerly w<strong>in</strong>d will still prevail.<br />
2.3. Surface fields<br />
2.3.1 Temperature at 2 m (T2m)<br />
In all seasons temperature at 2 m will be <strong>in</strong>creased <strong>in</strong> future <strong>climate</strong> (Fig. 2-2); this is<br />
statistically significant even at the 99% confidence level. However, warm<strong>in</strong>g of the European<br />
cont<strong>in</strong>ent is not the same across the seasons. For example, <strong>in</strong> w<strong>in</strong>ter and spr<strong>in</strong>g, the warm<strong>in</strong>g is<br />
larger <strong>in</strong> the north-eastern part of Europe than <strong>in</strong> the Mediterranean (Fig. 2-2 a,b). Such a<br />
differential field <strong>in</strong> T2m is reflected on the <strong>Croatia</strong>n region as well, where a temperature <strong>in</strong>crease<br />
<strong>in</strong> w<strong>in</strong>ter is slightly higher <strong>in</strong> the northern part (for approximately 1.8 °C), and less pronounced <strong>in</strong><br />
the southern parts of the country (about 1.5 °C; Fig. 2-2a). The warm<strong>in</strong>g <strong>in</strong> future <strong>climate</strong>,<br />
<strong>in</strong>dicated <strong>in</strong> Fig. 2-2a, is smaller, on average, for about 0.5-1.0 degree than the warm<strong>in</strong>g<br />
obta<strong>in</strong>ed by EH5OM global model (Branković et al. 2010). In spr<strong>in</strong>g, an <strong>in</strong>crease <strong>in</strong> temperature<br />
is relatively uniform throughout <strong>Croatia</strong> (Fig. 2-2b), and, with the amplitude of warm<strong>in</strong>g of about<br />
1.5 °C, it is quite similar to w<strong>in</strong>ter warm<strong>in</strong>g.<br />
In summer and autumn, warm<strong>in</strong>g is more pronounced <strong>in</strong> south Europe and along the<br />
coastal part of the Mediterranean (Fig. 2-2 c,d), and significantly exceeds the warm<strong>in</strong>g from<br />
colder part of the year. For example, above the Iberian Pen<strong>in</strong>sula, amplitude exceeds 4 °C <strong>in</strong><br />
summer, while <strong>in</strong> <strong>Croatia</strong> the warm<strong>in</strong>g is between 2 °C <strong>in</strong> the northern and almost 3 °C <strong>in</strong> the<br />
southern part of the country. In autumn, the T2m <strong>in</strong>crease will be between 1.5 °C <strong>in</strong> a larger<br />
portion of the cont<strong>in</strong>ental <strong>Croatia</strong> and slightly above 2 °C <strong>in</strong> the coastal zone, as well as <strong>in</strong> Istria<br />
and the Dalmatian h<strong>in</strong>terland. In summer, the warm<strong>in</strong>g is similar to that from the w<strong>in</strong>ter period<br />
(Fig. 2-2c), and for approximately 1 °C smaller than <strong>in</strong> EH5OM global model. The differences <strong>in</strong><br />
the future T2m warm<strong>in</strong>g between global and regional model can be the consequence of various<br />
factors or of their comb<strong>in</strong>ation. Probably the ma<strong>in</strong> source of largest differences between the<br />
models is differently def<strong>in</strong>ed parameterization of unresolved physical processes. However, the<br />
differences could be also attributed to a more detailed (better) orography resolution <strong>in</strong> the<br />
regional model.<br />
The above warm<strong>in</strong>g is calculated as the mean value of the three-member ensemble.<br />
Unlike the ensemble mean, <strong>change</strong> <strong>in</strong> temperature <strong>in</strong>terannual variability, expressed by<br />
standard deviation, <strong>in</strong>dicates only a slight <strong>in</strong>crease of temperature variability <strong>in</strong> future <strong>climate</strong><br />
(not shown). The T2m standard deviation has a maximum a little higher than 0.3 °C <strong>in</strong> summer<br />
<strong>in</strong> the eastern and southern <strong>Croatia</strong> – that is much lower than mean values from Fig. 2-2. In<br />
autumn and w<strong>in</strong>ter, the <strong>change</strong> <strong>in</strong> variability is even smaller, with no <strong>change</strong> at all <strong>in</strong> spr<strong>in</strong>g.<br />
22
Such a result <strong>in</strong>dicates that <strong>in</strong> future <strong>climate</strong> <strong>in</strong>terannual variation of extreme temperature<br />
(usually quantified as the sum of mean value and <strong>in</strong>terannual variation) will mostly depend on<br />
<strong>change</strong>/<strong>in</strong>crease of mean temperature, while it will depend significantly less on the year-to-year<br />
temperature variation. Räisänen (2002) came to a similar conclusion analyz<strong>in</strong>g results for the<br />
globe from 19 global models.<br />
Increased greenhouse gases concentration accord<strong>in</strong>g to the A2 <strong>scenario</strong> will cause<br />
relatively larger warm<strong>in</strong>g of near-surface atmosphere <strong>in</strong> summer, which may have a negative<br />
impact on human activities and health (see e.g. Srnec i Zan<strong>in</strong>ović 2008). However, global<br />
warm<strong>in</strong>g should not have damag<strong>in</strong>g consequences if adequate adaptation measures are taken.<br />
A higher average temperature <strong>in</strong> spr<strong>in</strong>g can cause an earlier beg<strong>in</strong>n<strong>in</strong>g of the vegetation period,<br />
while higher temperature <strong>in</strong> autumn could br<strong>in</strong>g, for example, a prolonged tourist season at the<br />
Adriatic coast. However, positive consequences <strong>in</strong> one season can be “counterbalanced” by<br />
negative consequences <strong>in</strong> another season (for example, a possible reduction of energy<br />
consumption for heat<strong>in</strong>g <strong>in</strong> w<strong>in</strong>ter is be<strong>in</strong>g compensated by <strong>in</strong>creased energy consumption for<br />
cool<strong>in</strong>g <strong>in</strong> summer).<br />
2.3.2 Surface pressure and w<strong>in</strong>d<br />
The <strong>in</strong>crease of geopotential above south Europe <strong>in</strong> w<strong>in</strong>ter is reflects as an <strong>in</strong>crease <strong>in</strong><br />
mean surface pressure <strong>in</strong> future <strong>climate</strong> (not shown). This <strong>in</strong>crease <strong>in</strong> surface pressure is<br />
statistically significant for southern <strong>Croatia</strong>, but not for other areas. A tendency towards<br />
<strong>in</strong>creased pressure can result <strong>in</strong> an <strong>in</strong>creased frequency of anticyclonic weather types. In<br />
summer our regions will be affected by relatively <strong>in</strong>significant <strong>change</strong> of mean pressure – the<br />
pressure will be slightly higher <strong>in</strong> northern areas and slightly lower <strong>in</strong> south <strong>Croatia</strong>. However,<br />
regardless of the small <strong>change</strong> <strong>in</strong> amplitude, the pressure decrease <strong>in</strong> south <strong>Croatia</strong> is<br />
statistically significant. Therefore, the middle and southern Adriatic will be exposed to an<br />
<strong>in</strong>creased cyclonic activity <strong>in</strong> summer, which will cause more frequent unstable weather types.<br />
In chapter 2.2, it has been ascerta<strong>in</strong>ed that <strong>in</strong> future <strong>climate</strong>, associated with an<br />
<strong>in</strong>tensification of the Atlantic storm path, westerly upper-level w<strong>in</strong>ds will become stronger, <strong>in</strong><br />
particular <strong>in</strong> w<strong>in</strong>ter with<strong>in</strong> free atmosphere above the north-western Europe. Similar is true for<br />
w<strong>in</strong>d at 10 m (surface w<strong>in</strong>d), which will be <strong>in</strong>tensified <strong>in</strong> w<strong>in</strong>ter to the north of the Alps and<br />
weakened at its southern slopes (Fig. 2-3a). Above our areas differential w<strong>in</strong>d (the difference<br />
between mean w<strong>in</strong>d <strong>in</strong> future <strong>climate</strong> and mean w<strong>in</strong>d <strong>in</strong> the 20 th century <strong>climate</strong>) will reta<strong>in</strong><br />
similar <strong>in</strong>tensity as <strong>in</strong> the 20 th century, but it will slightly turn to the north-east direction, i.e. it will<br />
get a somewhat stronger south-western component. Such a differential surface w<strong>in</strong>d will br<strong>in</strong>g to<br />
our areas a slightly <strong>in</strong>creased humidity from the western Mediterranean and the Adriatic (not<br />
23
shown), caus<strong>in</strong>g a slight <strong>in</strong>crease <strong>in</strong> w<strong>in</strong>ter precipitation <strong>in</strong> the littoral and mounta<strong>in</strong> areas (see<br />
Fig. 2-4a).<br />
In spr<strong>in</strong>g and autumn surface w<strong>in</strong>d will rema<strong>in</strong> un<strong>change</strong>d <strong>in</strong> future <strong>climate</strong>, while <strong>in</strong><br />
summer north-eastern component will be <strong>in</strong>tensified (Fig. 2-3b). Related to this <strong>in</strong>tensified w<strong>in</strong>d<br />
from the <strong>in</strong>land of the Balkan Pen<strong>in</strong>sula (where <strong>in</strong> summer humidity <strong>in</strong> the near-surface layer is<br />
smaller than humidity above the Adriatic Sea) is the associated precipitation decrease, at the<br />
coastal part of <strong>Croatia</strong> (cf. Fig. 2-4c).<br />
2.3.3 Precipitation<br />
At regional and local scale the precipitation may have large spatial variability even <strong>in</strong><br />
climatological mean. It primarily depends on physical features of the surface – altitude and relief<br />
<strong>in</strong>dentation. These features are better represented <strong>in</strong> regional than <strong>in</strong> global models, so it can be<br />
expected that precipitation will be better represented as well. In addition to the representation of<br />
precipitation, a better resolved orography has a more appropriate impact on physical processes -<br />
for example, <strong>in</strong> trigger<strong>in</strong>g summer convection.<br />
(i) Total precipitation<br />
Change <strong>in</strong> total precipitation <strong>in</strong> future <strong>climate</strong> relative to the 20 th century <strong>climate</strong>, is shown<br />
<strong>in</strong> Fig. 2-4 for all four seasons. The structure of <strong>change</strong> – an <strong>in</strong>crease of future total precipitation<br />
<strong>in</strong> north Europe and a decrease <strong>in</strong> the south – is similar <strong>in</strong> all seasons and it is associated with<br />
the path of storm disturbances from the Atlantic <strong>in</strong>to the European cont<strong>in</strong>ent. The region of the<br />
precipitation <strong>in</strong>crease is moved to the north <strong>in</strong> summer as storm paths are located further north.<br />
Giorgi and Coppola (2007) noticed such a “transition” of <strong>climate</strong> <strong>change</strong> <strong>in</strong> precipitation through<br />
year analys<strong>in</strong>g the results from 22 global <strong>climate</strong> models. Clearly, our results for regional<br />
adaptation bear semblance to global models.<br />
From Fig. 2-4 it can be seen that total precipitation is decreased <strong>in</strong> three seasons (spr<strong>in</strong>g,<br />
summer and autumn), primarily <strong>in</strong> the coastal, southern and mounta<strong>in</strong>ous <strong>Croatia</strong>. The decrease<br />
is less than 0.5 mm day -1 (or 45 mm <strong>in</strong> a season), except <strong>in</strong> autumn <strong>in</strong> southern areas, when it is<br />
slightly higher than 0.5 mm day -1 . Only <strong>in</strong> w<strong>in</strong>ter (Fig. 2-4a) there will be a slight precipitation<br />
<strong>in</strong>crease, ma<strong>in</strong>ly <strong>in</strong> the littoral and mounta<strong>in</strong>ous part of <strong>Croatia</strong>, as well as <strong>in</strong> the northern and<br />
eastern parts.<br />
Total precipitation <strong>change</strong>, especially <strong>in</strong> w<strong>in</strong>ter and spr<strong>in</strong>g (Fig. 2-4 a,b), is concentrated<br />
<strong>in</strong> relatively narrow zone along the Adriatic, whereas for a major part of the Adriatic Sea there is<br />
small or no <strong>change</strong> <strong>in</strong> total precipitation. Consider<strong>in</strong>g quite a complex orography of our Adriatic<br />
coast (steep rise of high mounta<strong>in</strong>s), such a structure of <strong>climate</strong> <strong>change</strong> <strong>in</strong> precipitation (narrow<br />
24
and elongated) <strong>in</strong>dicates the need of dynamical downscal<strong>in</strong>g with even f<strong>in</strong>er horizontal resolution<br />
than the current 35 km.<br />
In summer, a relative decrease of total precipitation along the eastern Adriatic coast and<br />
its <strong>in</strong>land is larger than <strong>in</strong> spr<strong>in</strong>g and autumn, as total precipitation is smallest <strong>in</strong> summer. For a<br />
major part of our Adriatic coast and its <strong>in</strong>land a relative decrease of total precipitation <strong>in</strong> summer<br />
is over 20%, while <strong>in</strong> autumn and spr<strong>in</strong>g deficit is lower than 15%. This is <strong>in</strong>directly confirmed <strong>in</strong><br />
Fig. 2-5, where shaded areas of t-test <strong>in</strong>dicate statistical significance <strong>in</strong> total precipitation <strong>change</strong><br />
at the 95% confidence level. In summer, a decrease of total precipitation along the eastern<br />
Adriatic coast and <strong>in</strong>land is statistically significant (Fig. 2-5c), while <strong>in</strong> spr<strong>in</strong>g (Fig. 2-5b) and<br />
autumn (Fig. 2-5d) precipitation decrease <strong>in</strong> future <strong>climate</strong> is significant only <strong>in</strong> the southern part<br />
of the eastern Adriatic coast. It is <strong>in</strong>terest<strong>in</strong>g to notice that precipitation <strong>in</strong>crease <strong>in</strong> w<strong>in</strong>ter is not<br />
significant. It could be concluded therefore that <strong>in</strong> future <strong>climate</strong> <strong>in</strong> most of the year there will be<br />
a deficit <strong>in</strong> precipitation <strong>in</strong> western and southern <strong>Croatia</strong>, while the <strong>in</strong>crease <strong>in</strong> w<strong>in</strong>ter is not<br />
reliable. In northern parts of the country there will be no significant <strong>change</strong> <strong>in</strong> total precipitation <strong>in</strong><br />
future <strong>climate</strong>. Change <strong>in</strong> <strong>in</strong>terannual variation of precipitation described by the variation<br />
coefficient, <strong>in</strong>dicates an <strong>in</strong>crease <strong>in</strong> variability <strong>in</strong> future <strong>climate</strong>. It is pronounced ma<strong>in</strong>ly <strong>in</strong> the<br />
Mediterranean (mostly <strong>in</strong> summer, least <strong>in</strong> w<strong>in</strong>ter) and it is very weak north of 45 °N (not shown).<br />
The comparison of <strong>climate</strong> <strong>change</strong> <strong>in</strong> total precipitation <strong>in</strong> Fig. 2-4 with the results of<br />
global model <strong>in</strong>dicates the follow<strong>in</strong>g: the structure of anomaly fields <strong>in</strong> Fig. 2-4 generally<br />
co<strong>in</strong>cides with those from global model (compare with Giorgi and Coppola, 2007, and Branković<br />
et al. 2010); however, <strong>in</strong> Fig. 2-4 there are clearly details at a f<strong>in</strong>er scale, which cannot be seen<br />
<strong>in</strong> global model. In w<strong>in</strong>ter, the amplitude of positive anomaly (<strong>in</strong>crease of total precipitation) <strong>in</strong><br />
the littoral <strong>Croatia</strong> is slightly higher <strong>in</strong> RegCM (Fig. 2-4a), than <strong>in</strong> global model, where the result<br />
is mostly neutral. In summer, a decrease of total precipitation is slightly more evident <strong>in</strong> the<br />
littoral <strong>Croatia</strong> and its h<strong>in</strong>terland <strong>in</strong> RegCM model, while <strong>in</strong> global model it is more pronounced <strong>in</strong><br />
the northern <strong>Croatia</strong>. Therefore, model results should be <strong>in</strong>terpreted cautiously, as they could<br />
<strong>in</strong>dicate the opposite effects, particularly <strong>in</strong> the analysis at smaller scales (see comment <strong>in</strong><br />
2.1.4).<br />
(ii) Snow<br />
It is expected that the <strong>change</strong> <strong>in</strong> the coverage (spatial distribution) and height of snow<br />
cover <strong>in</strong> Europe will occur <strong>in</strong> association with global warm<strong>in</strong>g <strong>in</strong> w<strong>in</strong>ter (Fig. 2-2a). A large<br />
decrease of snow cover <strong>in</strong> future <strong>climate</strong>, more than 30 mm (but less than 50 mm) of equivalent<br />
water, can be found <strong>in</strong> the Alps (Fig. 2-6a). In other mounta<strong>in</strong>ous areas of middle and southern<br />
Europe (the Carpathians, the Balkan mounta<strong>in</strong>s, the Pyrenees) there will be a reduction of snow<br />
cover as well, and also <strong>in</strong> the lowlands of Germany, Poland and Russia. In our areas, the<br />
25
eduction is 1 mm <strong>in</strong> northern <strong>Croatia</strong>, up to slightly more than 2 mm <strong>in</strong> mounta<strong>in</strong>ous areas.<br />
Although such a reduction of snow cover <strong>in</strong> <strong>Croatia</strong> may seem irrelevant, compared, for<br />
example, with the Alps, <strong>in</strong> relative terms it is quite significant. Except <strong>in</strong> the north-western<br />
<strong>Croatia</strong> and Istria, the reduction of snow cover by the middle of this century is statistically<br />
significant (Fig. 2-6b). The reduction of snow cover will generally br<strong>in</strong>g a decrease <strong>in</strong> <strong>in</strong>terannual<br />
variability (not shown); only <strong>in</strong> the areas with relatively small snow reduction, for example <strong>in</strong> the<br />
Pannonian lowland, variability will be slightly <strong>in</strong>creased.<br />
From the RegCM model results, the number of days with snow cover for the 20 th century<br />
has been calculated and compared with the data from the <strong>Croatia</strong>n meteorological and<br />
climatological stations (Fig. 2-6c). Model results underestimate observational data, because the<br />
model is not capable to dist<strong>in</strong>guish horizontal and vertical scales of climatological stations. For<br />
example, the isol<strong>in</strong>e <strong>in</strong>dicat<strong>in</strong>g 15 days with snow borders with Gorski Kotar <strong>in</strong> the north, while<br />
data from Sisak and Slavonski Brod <strong>in</strong>dicate 21 and 20 days with snow. In the south, the same<br />
isol<strong>in</strong>e is moved too far <strong>in</strong>land due to an <strong>in</strong>adequate resolution of a quite sharp gradient <strong>in</strong><br />
number of days with snow between the littoral and mounta<strong>in</strong>ous <strong>Croatia</strong>, e.g. the Zavižan station<br />
<strong>in</strong> the northern Velebit sticks out with 39 snowy days. However, more relevant is the relative<br />
<strong>change</strong> of number of days with snow <strong>in</strong> future <strong>climate</strong> relative to the 20 th century <strong>climate</strong> (Fig. 2-<br />
6d). The number of days with snow <strong>in</strong> future <strong>climate</strong> is significantly reduced, <strong>in</strong> many parts, and<br />
even halved relative to the 20 th century. Regardless to the errors <strong>in</strong> the representation of present<br />
<strong>climate</strong>, such a decrease is a significant <strong>in</strong>dicator of what to be expected by the middle of this<br />
century.<br />
2.3.4 Some significant or extreme occurrences<br />
As for days with snow (Fig. 2-6 c,d), similar statistics is considered for some<br />
climatological parameters describ<strong>in</strong>g significant or extreme values of surface atmosphere<br />
(temperature and precipitation). For climatological stations many extreme events are processed<br />
and shown <strong>in</strong> Zan<strong>in</strong>ović et al. (2008). Fig. 2-7a shows a comparison of stations data and<br />
regional model for hot summer days, i.e. when maximum temperature is higher or equal to 30<br />
°C. Although model generally underestimates a number of hot days, still the model results are<br />
acceptable for many areas. The number of hot days <strong>in</strong> model is <strong>in</strong>creased from mounta<strong>in</strong>ous<br />
areas of the western Balkan, northwards to the Pannonian lowland and towards the Adriatic<br />
coast. The largest discrepancy is found at the Kn<strong>in</strong> station, where the number of observed hot<br />
days (37) is the largest <strong>in</strong> <strong>Croatia</strong> and significantly exceeds the model value (4). Model<br />
orography, which is much higher at the location of the Kn<strong>in</strong> station than <strong>in</strong> reality, effects a<br />
general decrease of temperature, as well as frequency of hot days. Also, vegetation cover has<br />
an impact on temperature. Namely, <strong>in</strong> the model <strong>in</strong> each grid box only one vegetation type is<br />
26
epresented (usually the prevail<strong>in</strong>g one), while <strong>in</strong> reality <strong>in</strong> the area of 35 X 35 km various types<br />
of vegetation could be found. Generally, deficiencies and approximations <strong>in</strong> model contribute to<br />
differences between measured (observed) values and simulated <strong>climate</strong>.<br />
Difference between future <strong>climate</strong> and the 20 th century <strong>climate</strong> <strong>in</strong>dicates to an <strong>in</strong>crease of<br />
hot days; <strong>in</strong> many areas the number of hot days will be doubled by the middle of this century.<br />
For example, the <strong>in</strong>crease will be from 6 days <strong>in</strong> mounta<strong>in</strong>ous areas up to almost severe 20 days<br />
at the Adriatic (Fig. 2-7b). Such an <strong>in</strong>crease of the number of hot days could greatly <strong>in</strong>fluence<br />
social-economical circumstances <strong>in</strong> south Europe and the Mediterranean.<br />
Average number of w<strong>in</strong>ter days with precipitation larger than 10 mm is shown <strong>in</strong> Fig. 2-<br />
7c. For a major part of <strong>Croatia</strong>, particularly <strong>in</strong> the north, model relatively successfully simulates<br />
this type of statistics, even some details such as precipitation decrease <strong>in</strong> Zadar and Split<br />
relative to adjacent areas. In mounta<strong>in</strong>ous <strong>Croatia</strong> (Parg, Ogul<strong>in</strong>) precipitation is underestimated<br />
<strong>in</strong> the model, while <strong>in</strong> <strong>in</strong>land Dalmatia (Kn<strong>in</strong>) and southern <strong>Croatia</strong> (Dubrovnik) it is<br />
overestimated. This is probably the result of the southern <strong>Croatia</strong> orography be<strong>in</strong>g higher <strong>in</strong><br />
model than <strong>in</strong> reality. It can be concluded that <strong>in</strong> extremely orographically complex areas of the<br />
littoral <strong>Croatia</strong> it is very hard to reproduce detailed spatial variation of observed number of days<br />
by a model.<br />
In future <strong>climate</strong>, <strong>in</strong> a major part of the coastal <strong>Croatia</strong> and its h<strong>in</strong>terland average number<br />
of days with precipitation larger than 10 mm will be <strong>in</strong>creased from 0.5 up to 1 day (Fig. 2-7d).<br />
Such a <strong>change</strong> is consistent with results <strong>in</strong> Fig. 2-4a, <strong>in</strong>dicat<strong>in</strong>g an <strong>in</strong>crease of total precipitation<br />
<strong>in</strong> w<strong>in</strong>ter <strong>in</strong> the coastal <strong>Croatia</strong>. Accord<strong>in</strong>g to Fig. 2-7d only on the southern Dalmatian islands<br />
the number of days with precipitation larger than 10 mm will rema<strong>in</strong> un<strong>change</strong>d or slightly<br />
decreased relative to the 20 th century <strong>climate</strong>.<br />
In summer model generally underestimates a number of days with precipitation larger<br />
than 10 mm (not shown), probably due to showery nature of summer precipitation, which is<br />
relatively difficult to reproduce. However, consistent with Fig. 2-4c, <strong>in</strong> future <strong>climate</strong> the number<br />
of days with such significant precipitation <strong>in</strong> coastal area and h<strong>in</strong>terland is decreased (for more<br />
than 1.2 days), while <strong>in</strong> cont<strong>in</strong>ental <strong>Croatia</strong> it will be slightly <strong>in</strong>creased.<br />
2.4. Conclusions<br />
The results of the RegCM regional <strong>climate</strong> model <strong>in</strong>tegrations have been analysed for all<br />
seasons from the two 30-year periods: 1961-1990, represent<strong>in</strong>g the present <strong>climate</strong>, and 2041-<br />
2070, represent<strong>in</strong>g the projection of future <strong>climate</strong> accord<strong>in</strong>g to the IPCC A2 <strong>scenario</strong>. By<br />
compar<strong>in</strong>g climatological mean values from both periods, it is possible to conclude on possible<br />
<strong>climate</strong> <strong>change</strong> <strong>in</strong> the <strong>in</strong>tegration doma<strong>in</strong>. Changes of climatological means have been tested by<br />
27
objective statistical method. Interannual variations of some meteorological parameters with<strong>in</strong><br />
selected periods have been compared from which it can be concluded on the <strong>change</strong> of<br />
variability <strong>in</strong> future <strong>climate</strong> <strong>in</strong> relation to the present one.<br />
In all seasons, RegCM predicts temperature <strong>in</strong>crease with<strong>in</strong> the entire <strong>in</strong>tegration<br />
doma<strong>in</strong>, as well as throughout the depth of the model atmosphere. In the cold part of the year,<br />
the warm<strong>in</strong>g will be slightly <strong>in</strong>creased <strong>in</strong> the northern (cont<strong>in</strong>ental) <strong>Croatia</strong>, while <strong>in</strong> warm periods<br />
the warm<strong>in</strong>g will be <strong>in</strong>creased <strong>in</strong> the littoral <strong>Croatia</strong>. Warm<strong>in</strong>g <strong>in</strong> RegCM <strong>in</strong>tegrations is <strong>in</strong><br />
agreement with warm<strong>in</strong>g <strong>in</strong> EH5OM global model, whose data were used to force RegCM via<br />
<strong>in</strong>itial and boundary conditions; however, the amplitude of the warm<strong>in</strong>g is generally a little lower<br />
<strong>in</strong> RegCM, than <strong>in</strong> EH5OM model.<br />
The decrease of total precipitation <strong>in</strong> future <strong>climate</strong> is expected <strong>in</strong> a large part of the year,<br />
primarily <strong>in</strong> the littoral <strong>Croatia</strong> and its h<strong>in</strong>terland. Such a decrease is, <strong>in</strong> relative terms, highest <strong>in</strong><br />
summer because of pronounced climatological m<strong>in</strong>imum <strong>in</strong> the annual cycle for total<br />
precipitation <strong>in</strong> this part of <strong>Croatia</strong>. In w<strong>in</strong>ter there will be a slight <strong>in</strong>crease of precipitation, aga<strong>in</strong><br />
<strong>in</strong> a narrow littoral zone, but such an <strong>in</strong>crease is not statistically significant. In the northern<br />
<strong>Croatia</strong> no significant precipitation <strong>change</strong> <strong>in</strong> future <strong>climate</strong> is expected.<br />
Analysis of the modelled number of days for some significant and extreme events<br />
(number of days with snow, hot days and days with precipitation larger than 10 mm) for the 20 th<br />
century <strong>climate</strong> broadly matches observational data, although not <strong>in</strong> all details. The largest<br />
differences between the model and the observations could be attributed to <strong>in</strong>adequate<br />
orography representation regardless of the fact that regional model has relatively f<strong>in</strong>e horizontal<br />
resolution. Future <strong><strong>change</strong>s</strong> <strong>in</strong>dicate a decrease <strong>in</strong> the average number of days with snow, an<br />
<strong>in</strong>crease <strong>in</strong> the number of hot days, as well as slight <strong>in</strong>crease <strong>in</strong> the number of days with<br />
significant precipitation <strong>in</strong> w<strong>in</strong>ter. This statistics agrees well with <strong>climate</strong> <strong>change</strong> of the mean<br />
values for near-surface temperature and total precipitation.<br />
References:<br />
Branković Č., Srnec L., Patarčić M. (2009): An assessment of global and regional <strong>climate</strong> <strong>change</strong> based<br />
on the EH5OM <strong>climate</strong> model ensemble. Climatic Change (u tisku, DOI 10.1007/s10584-009-<br />
9731-y).<br />
Dick<strong>in</strong>son, R.E., Errico R.M., Giorgi F. i Bates G.T. (1989): A regional <strong>climate</strong> model for the western<br />
United States. Climatic Change, 15, 383-422.<br />
Fritsch, J.M. i Chappel C.F. (1980): Numerical prediction of convectively driven mesoscale pressure<br />
systems. Part I: Convective parameterization. Journal of the Atmospheric Sciences, 37, 1722-<br />
1733.<br />
Giorgi, F. (1990): Simulation of regional <strong>climate</strong> us<strong>in</strong>g a limited area model nested <strong>in</strong> a general circulation<br />
model. Journal of <strong>Climate</strong>, 3, 941-963.<br />
28
Giorgi F., Coppola E. (2007): European <strong>climate</strong>-<strong>change</strong> oscillation. Geophysical Research Letters, 34:<br />
L21703, doi: 10.1029/2007GL031223.<br />
Grell, G.A. (1993): Prognostic evaluation of assumptions used by cumulus parameterizations. Monthly<br />
Weather Review, 121, 764-787.<br />
Hawk<strong>in</strong>s, E., Sutton R. (2009): The potential to narrow uncerta<strong>in</strong>ty <strong>in</strong> regional <strong>climate</strong> predictions. Bullet<strong>in</strong><br />
of the American Meteorological Society, 90, 1095-1107.<br />
Nakićenović N. i 27 suradnika (2000): Special report on emission <strong>scenario</strong>s. A special report of Work<strong>in</strong>g<br />
Group III of the IPCC. Cambridge University Press, Cambridge, pp 599.<br />
Pal, J. i 19 suradnika (2007): Regional <strong>climate</strong> model<strong>in</strong>g for the develop<strong>in</strong>g world. The ICTP RegCM3 and<br />
RegCNET. Bullet<strong>in</strong> of the American Meteorological Society, 88, 1395-1409.<br />
P<strong>in</strong>to J.G., Ulbrich U., Leckebusch G.C., Spangehl T., Reyers M., Zacharias S. (2007): Changes <strong>in</strong> storm<br />
track and cyclone activity <strong>in</strong> three SRES ensemble experiments with the ECHAM5/MPI-OM1<br />
GCM. <strong>Climate</strong> Dynamics 29: 195-210<br />
Roeckner E. i 13 suradnika (2003): The atmospheric general circulation model ECHAM5. Part I: Model<br />
description. Max-Planck Institute for Meteorology Rep. 349, Hamburg, 127 pp.<br />
Räisänen J. (2002): CO2-<strong>in</strong>duced <strong><strong>change</strong>s</strong> <strong>in</strong> <strong>in</strong>terannual temperature and precipitation variability <strong>in</strong> 19<br />
CMIP2 experiments. Journal of <strong>Climate</strong>, 15: 2395-2411<br />
Srnec L., Zan<strong>in</strong>ović K. (2008): The summer bioclimatic conditions at the Adriatic coast <strong>in</strong> 21st century.<br />
18th International Congress on Biometeorology. 22-26 September, 2008. Tokyo, Japan.<br />
Zan<strong>in</strong>ović, K., Gajić-Čapka, M., Perčec Tadić, M. et al, 2008: Klimatski atlas Hrvatske / <strong>Climate</strong> atlas of<br />
<strong>Croatia</strong> 1961-1990., 1971-2000. Državni hidrometeorološki zavod, Zagreb, 200 str.<br />
29
Figure 2-1. Altitud<strong>in</strong>al temperature, future <strong>climate</strong> m<strong>in</strong>us the <strong>climate</strong> of the 20 th century: a) w<strong>in</strong>ter<br />
200 hPa, b) summer 200 hPa, c) w<strong>in</strong>ter 850 hPa, d) summer 850 hPa. Isol<strong>in</strong>es 0,5 degree.<br />
30
Figure 2-2. Temperature at 2 m, future <strong>climate</strong> m<strong>in</strong>us the <strong>climate</strong> of the 20 th century: a) w<strong>in</strong>ter,<br />
b) spr<strong>in</strong>g, c) summer, d) autumn. Isol<strong>in</strong>es every 0.3 degrees <strong>in</strong> a), b) and d), and every 0.5<br />
degrees <strong>in</strong> c).<br />
31
Figure 2-3. W<strong>in</strong>d at 10 m, future <strong>climate</strong> m<strong>in</strong>us the <strong>climate</strong> of the 20 th century: a) w<strong>in</strong>ter, b)<br />
summer. Isol<strong>in</strong>es every 0.2 m/s.<br />
32
Figure 2-4. Total precipitation, future <strong>climate</strong> m<strong>in</strong>us <strong>climate</strong> of the 20 th century: a) w<strong>in</strong>ter, b)<br />
spr<strong>in</strong>g, c) summer, d) autumn. Isol<strong>in</strong>es 0.1, 0.2, 0.3, 0.5, 1, 2 mm/day; bold l<strong>in</strong>es positive values,<br />
dashed l<strong>in</strong>es negative values.<br />
33
Figure 2-5. t-test significancy of the differences <strong>in</strong> total precipitation, future <strong>climate</strong> m<strong>in</strong>us the<br />
<strong>climate</strong> of 20 th century with a 95% level of confidence: a) w<strong>in</strong>ter, b) spr<strong>in</strong>g, c) summer, d)<br />
autumn.<br />
34
Figure 2-6. Snow <strong>in</strong> w<strong>in</strong>ter, future <strong>climate</strong> m<strong>in</strong>us the <strong>climate</strong> of the20th century: a) difference <strong>in</strong><br />
mean values, b) t-test significancy of the difference of mean values with a 95% level of<br />
confidence. Mean number of days with snow <strong>in</strong> w<strong>in</strong>ter c) model and <strong>climate</strong> stations for the<br />
period 1961-1990, d) <strong>change</strong> of the number of days future <strong>climate</strong> m<strong>in</strong>us the <strong>climate</strong> of the 20 th<br />
century. Isol<strong>in</strong>es <strong>in</strong> a) 1, 2, 5, 10, 30, 50 mm of equivalent water. Isol<strong>in</strong>es <strong>in</strong> c) 5, 10, 15, 20, 25,<br />
30, 40, 50 days, <strong>in</strong> d) 1 day.<br />
35
Figure 2-7. Median number of hot days a) model and <strong>climate</strong> stations for the period 1961-1990,<br />
b) <strong>change</strong> of the number of days m<strong>in</strong>us the <strong>climate</strong> of the 20 th century. Mean number of days<br />
with precipitation larger than 10 mm c) model and <strong>climate</strong> stations.<br />
36
3. Impact of <strong>climate</strong> variations and <strong>change</strong> on plants and on wildfire danger<br />
3.1. Impact of <strong>climate</strong> variations and <strong>change</strong> on plants<br />
Research of <strong>climate</strong> <strong>change</strong> impact on plants is based on an idea that plants are the first<br />
that react to weather and <strong>climate</strong> <strong>change</strong>, for which purpose the phenological data are suitable<br />
for monitor<strong>in</strong>g development phases of certa<strong>in</strong> plant species. Results of l<strong>in</strong>ear trends of long-term<br />
phenological phases of common lilac, apple and olive trees from phenological stations Daruvar,<br />
Zagreb, Gospić, Rab and Hvar (Fig. 3-1), mostly from the period 1961.-2008., are <strong>in</strong>dicated<br />
below. The stations were chosen <strong>in</strong> order to cover basic <strong>climate</strong> types <strong>in</strong> <strong>Croatia</strong>: cont<strong>in</strong>ental,<br />
mounta<strong>in</strong>ous and Mediterranean, as well as the city of Zagreb.<br />
Weather conditions of the last years less and less follow known annual and seasonal cycles<br />
and there are more and more extreme weather events not follow<strong>in</strong>g average states. Thus, for<br />
example, dur<strong>in</strong>g 2007, due to extremely warm w<strong>in</strong>ter and spr<strong>in</strong>g, phenophases occurred much<br />
earlier. Analyses of l<strong>in</strong>ear trends of olive tree phenophases along the Adriatic coast and islands,<br />
as well as forest trees and fruit trees phenophases <strong>in</strong> mounta<strong>in</strong>ous <strong>Croatia</strong> with<strong>in</strong> the last 50<br />
years <strong>in</strong>dicated significant earlier beg<strong>in</strong>n<strong>in</strong>g of their flower<strong>in</strong>g (2–4 days/10 years) as a result of<br />
significant <strong>in</strong>crease of spr<strong>in</strong>g air temperature values <strong>in</strong> this area.<br />
Figure 3-1. Position of selected meteorological and phenological stations <strong>in</strong> <strong>Croatia</strong><br />
In the <strong>Croatia</strong>n <strong>in</strong>land vegetation period for the majority of plants beg<strong>in</strong>s <strong>in</strong> March or April.<br />
The beg<strong>in</strong>n<strong>in</strong>g of common lilac leaf unfold<strong>in</strong>g <strong>in</strong> Zagreb is on 26 March <strong>in</strong> average, while <strong>in</strong><br />
Daruvar on 1 April 1 st (Table 3-1). Naturally, the periods are <strong>change</strong>d from year to year, so the<br />
range between the latest and the earliest date can be even month and a half.<br />
37
The flower<strong>in</strong>g usually starts three weeks after the leaf unfold<strong>in</strong>g, while its fully flower<strong>in</strong>g<br />
the common lilac achieves a week after the flower<strong>in</strong>g start. High values of standard deviation (8-<br />
12 days) also <strong>in</strong>dicate to a great annual variability of common lilac leaf unfold<strong>in</strong>g and flower<strong>in</strong>g<br />
from year to year.<br />
In mounta<strong>in</strong>ous <strong>Croatia</strong> the beg<strong>in</strong>n<strong>in</strong>g of vegetation is moved to April and May, so <strong>in</strong><br />
Gospić the common lilac is usually leaf unfold<strong>in</strong>g on 15 April and flower<strong>in</strong>g on 6 May. It is<br />
exactly a month later than <strong>in</strong> Hvar. Naturally, a limit of vegetation beg<strong>in</strong>n<strong>in</strong>g is earlier as it moves<br />
to the south of <strong>Croatia</strong>. Comparison between northern and middle Adriatic shows 4-5 days<br />
earlier start of common lilac leaf unfold<strong>in</strong>g and flower<strong>in</strong>g <strong>in</strong> Hvar than <strong>in</strong> Rab.<br />
In average, apple tree is leaf unfold<strong>in</strong>g and flower<strong>in</strong>g two weeks earlier <strong>in</strong> Daruvar (9 and<br />
17 April ) than <strong>in</strong> Gospić (25 April 25 th and 2 May). Apple maturation also starts two weeks<br />
earlier <strong>in</strong> Daruvar (6 September) than <strong>in</strong> Gospić (22 September). Such vegetation period of<br />
apple tree <strong>in</strong> the <strong>Croatia</strong>n <strong>in</strong>land lasts for seven months, while <strong>in</strong> mounta<strong>in</strong>ous <strong>Croatia</strong> for six<br />
months due to an earlier beg<strong>in</strong>n<strong>in</strong>g of colour<strong>in</strong>g and leaves fall<strong>in</strong>g.<br />
Appearance of the first flowers, full flower<strong>in</strong>g and end of olive tree flower<strong>in</strong>g is a week<br />
earlier <strong>in</strong> Hvar than <strong>in</strong> Rab. However, first ripe fruits are usually by the middle of October, while<br />
the pick<strong>in</strong>g is <strong>in</strong> the first 10-day period <strong>in</strong> November at both locations.<br />
In order to estimate a tendency of delay/earl<strong>in</strong>ess of phenophases <strong>in</strong> <strong>Croatia</strong>, l<strong>in</strong>ear<br />
trends of their appearance have been calculated for observed long-time period (Table 3-1. and<br />
Fig. 3-2). L<strong>in</strong>ear trends values <strong>in</strong> Table 6.4.2 are reduced to 10-year period. One of the methods<br />
provid<strong>in</strong>g the evaluation of statistical significance of limit <strong>change</strong>, around which the members of<br />
time series are distributed, i.e. evaluation of l<strong>in</strong>ear trend existence is non-parametric Mann-<br />
Kendall rank test.<br />
Statistically significant trend at the level of 0.05 is noticed <strong>in</strong> earlier flower<strong>in</strong>g of observed<br />
plants (2-4 days/10 years) <strong>in</strong> all <strong>climate</strong> zones, except <strong>in</strong> city of Zagreb. Air temperature rise <strong>in</strong><br />
Zagreb cannot be just a result of global warm<strong>in</strong>g, but <strong>in</strong> rapid expansion of Zagreb <strong>in</strong> the last<br />
hundred years.<br />
Earlier apple tree flower<strong>in</strong>g (3-4 days/10 years) is more expressed <strong>in</strong> the mounta<strong>in</strong>ous<br />
<strong>Croatia</strong> than <strong>in</strong> the <strong>in</strong>land (2 days/10 years). Significant trend of apple tree ripe fruits and pick<strong>in</strong>g<br />
is noticed only <strong>in</strong> the <strong>in</strong>land of <strong>Croatia</strong>, as well as a tendency of vegetation extension (leaves<br />
fall<strong>in</strong>g is later 2 days/10 years). On the contrary, <strong>in</strong> the mounta<strong>in</strong>ous <strong>Croatia</strong> a negative trend of<br />
apple tree colour<strong>in</strong>g and leaves fall<strong>in</strong>g (3 days/10 years) has been observed, which <strong>in</strong>dicates to<br />
shorten<strong>in</strong>g the vegetation period <strong>in</strong> autumn.<br />
38
Table 3-1. Mean (MEAN), maximum (MAX) and m<strong>in</strong>imum (MIN) phenophase dates for common<br />
lilac, apple and olive trees along with related standard deviation (STD) and amplitude (AMPL =<br />
MAX - MIN) at selected stations <strong>in</strong> <strong>Croatia</strong> mostly with<strong>in</strong> the period 1961–2008.<br />
PHENO-PHASES UL BF FF EF RF RP CL FL<br />
COMMON LILAC<br />
APPLE TREE<br />
OLIVE TREE<br />
MEAN 4/1 4/21 4/28<br />
STD 12 10 9<br />
MAKS 4/23 5/7 5/13<br />
MIN 3/8 3/30 4/9<br />
AMPL<br />
DARUVAR<br />
46 38 34<br />
MEAN 3/26 4/20 4/26<br />
ZAGREB<br />
STD 12 8 8<br />
MAX 4/15 5/2 5/10<br />
MIN 3/8 4/1 4/9<br />
AMPL<br />
38 31 31<br />
MEAN 4/15 5/6 5/12<br />
STD 11 9 9<br />
MAX 5/2 5/20 5/26<br />
MIN 3/24 4/10 4/17<br />
AMPL<br />
39 40 39<br />
GOSPIĆ<br />
MEAN 3/22 4/11 4/18<br />
STD 8 9 8<br />
MAX 4/3 4/28 5/6<br />
MIN 2/27 3/22 3/30<br />
AMPL<br />
RAB<br />
36 37 37<br />
MEAN 3/17 4/6 4/14<br />
STD 9 8 9<br />
MAX 3/31 4/22 5/1<br />
MIN 2/21 3/19 3/24<br />
AMPL<br />
HVAR<br />
39 34 38<br />
LEGEND:<br />
UL – Beg<strong>in</strong>n<strong>in</strong>g of leaf unfold<strong>in</strong>g<br />
BF – Beg<strong>in</strong>n<strong>in</strong>g of flower<strong>in</strong>g<br />
FF – Full (general) flower<strong>in</strong>g<br />
EF – End of flower<strong>in</strong>g<br />
RF – First ripe fruits<br />
RP – Fruit ripe for pick<strong>in</strong>g<br />
CL – Colour<strong>in</strong>g of leaves<br />
FL – Leaf fall<br />
MEAN 4/9 4/17 4/23 5/2 9/6 9/22 10/22 11/8<br />
STD 9 9 8 7 7 6 11 11<br />
MAX 4/25 5/3 5/9 5/16 9/18 10/9 11/11 11/25<br />
MIN 3/19 3/23 3/31 4/19 8/24 9/9 9/29 10/7<br />
AMPL<br />
DARUVAR<br />
(1969-2008)<br />
37 41 39 27 25 30 43 49<br />
SRED 4/25 5/2 5/8 5/14 9/22 10/5 10/19 10/29<br />
STD 9 8 8 9 6 7 9 9<br />
MAX 5/8 5/19 5/23 5/29 10/7 10/18 11/4 11/11<br />
MIN 4/3 4/17 4/20 4/27 9/7 9/24 10/1 10/6<br />
AMPL<br />
GOSPIĆ<br />
(1968-2008)<br />
35 32 33 32 30 24 34 36<br />
MEAN 5/27 6/3 6/14 10/14 11/7<br />
STD 8 8 7 10 10<br />
MAX 6/14 6/18 6/30 11/3 11/25<br />
MIN 5/6 5/13 5/31 9/9 9/30<br />
AMPL<br />
RAB<br />
39 36 30 55 56<br />
MEAN 5/21 5/28 6/6 10/16 11/9<br />
STD 10 10 11 11 8<br />
MAX 6/5 6/15 6/26 11/5 11/25<br />
MIN 4/4 4/8 4/14 9/9 10/20<br />
AMPL<br />
HVAR<br />
62 68 73 57 36<br />
39
Olive tree flower<strong>in</strong>g is earlier 2 days/10 years <strong>in</strong> northern Adriatic, while <strong>in</strong> Dalmatia 3<br />
days/10 years. Earlier olive ripe 2 days/10 years is observed <strong>in</strong> Dalmatia, while earlier pick<strong>in</strong>g is<br />
not just a result of weather conditions, but it depends on available olive oil process<strong>in</strong>g plants,<br />
amount of yield that can be processed at def<strong>in</strong>ed moment, as well as on market demand for<br />
certa<strong>in</strong> oil quality.<br />
Analysis of <strong>climate</strong> <strong>change</strong> impacts on plants <strong>in</strong>dicated <strong>in</strong> all <strong>climate</strong> zones an earlier<br />
beg<strong>in</strong>n<strong>in</strong>g of flower<strong>in</strong>g t of observed plants <strong>in</strong> spr<strong>in</strong>g, which is a result of warmer w<strong>in</strong>ter and<br />
spr<strong>in</strong>g. In autumn there is no such unambiguous delay <strong>in</strong> colour<strong>in</strong>g and leaves fall<strong>in</strong>g <strong>in</strong> all<br />
<strong>climate</strong> zones, i.e. vegetation period extension is observed <strong>in</strong> the <strong>in</strong>land, but not <strong>in</strong> the<br />
mounta<strong>in</strong>ous <strong>Croatia</strong>. These results are <strong>in</strong> accordance with observed more expressed mean air<br />
temperature rise <strong>in</strong> spr<strong>in</strong>g than <strong>in</strong> autumn.<br />
Table 3-2. L<strong>in</strong>ear trends of phenophases (day/10 years) for common lilac, apple and olive trees<br />
at selected stations <strong>in</strong> <strong>Croatia</strong> mostly <strong>in</strong> the period 1961-2008. Significant l<strong>in</strong>ear trends at the<br />
level ≤ 0.05 are <strong>in</strong> bold.<br />
TREND<br />
(day/10 ys )<br />
PHENO-<br />
PHASES<br />
UL BF FF EF RF RP CL FL<br />
DARUVAR 0.7 -2.1 -2.8<br />
COMMON<br />
LILAC<br />
ZAGREB<br />
GOSPIĆ<br />
RAB<br />
-3.4<br />
-3.5<br />
-0.6<br />
0.2<br />
-2.2<br />
-2.7<br />
0.3<br />
-2.4<br />
-2.3<br />
HVAR<br />
DARUVAR<br />
-1.6 -1.9 -2.3<br />
(1969- -0.8 -2.2 -2.2 -1.7 -1.8 -2.1 -0.2 1.7<br />
APPLE TREE<br />
2008)<br />
GOSPIĆ<br />
(1968-<br />
2008)<br />
-2.4 -3.0 -3.8 -4.5 -0.6 -0.7 -2.7 -2.9<br />
OLIVE TREE<br />
RAB<br />
HVAR<br />
-1.8<br />
-2.9<br />
-2.2<br />
-2.9<br />
0.0<br />
-2.9<br />
0.0<br />
-2.6<br />
-1.7<br />
-2.0<br />
40
19-May<br />
9-May<br />
29-Apr<br />
19-Apr<br />
9-Apr<br />
DARUVAR (1961-2008)<br />
COMMON LILAC - beg<strong>in</strong>n<strong>in</strong>g of flower<strong>in</strong>g<br />
30-Mar<br />
y = -0.2184x + 117.43<br />
20-Mar<br />
1961 1966 1971 1976 1981 1986 1991 1996 2001 2006<br />
year<br />
5-Dec<br />
25-Nov<br />
15-Nov<br />
5-Nov<br />
26-Oct<br />
16-Oct<br />
y = 0.1748x + 310.3<br />
6-Oct<br />
1969 1974 1979 1984 1989 1994 1999 2004<br />
year<br />
28-Jun<br />
18-Jun<br />
8-Jun<br />
29-May<br />
19-May<br />
9-May<br />
29-Apr<br />
DARUVAR (1969-2008)<br />
APPLE - leaf fall<br />
RAB (1961-2008)<br />
OLIVE - beg<strong>in</strong>n<strong>in</strong>g of flower<strong>in</strong>g<br />
y = -0.2603x + 155.21<br />
1961 1966 1971 1976 1981 1986 1991 1996 2001 2006<br />
year<br />
19-May<br />
9-May<br />
29-Apr<br />
19-Apr<br />
9-Apr<br />
ZAGREB (1961-2008)<br />
COMMON LILAC - beg<strong>in</strong>nig of flower<strong>in</strong>g<br />
30-Mar<br />
y = 0.016x + 110.92<br />
20-Mar<br />
1961 1966 1971 1976 1981 1986 1991 1996 2001 2006<br />
year<br />
25-Nov<br />
15-Nov<br />
5-Nov<br />
26-Oct<br />
16-Oct<br />
6-Oct<br />
26-Sep<br />
15-Nov<br />
5-Nov<br />
26-Oct<br />
16-Oct<br />
6-Oct<br />
26-Sep<br />
16-Sep<br />
6-Sep<br />
GOSPIĆ (1968-2008)<br />
APPLE - leaf fall<br />
y = -0.2988x + 309.32<br />
1968 1973 1978 1983 1988 1993 1998 2003 2008<br />
year<br />
HVAR (1962-2008)<br />
OLIVE - first ripe fruits<br />
y = -0.2624x + 296.67<br />
1962 1967 1972 1977 1982 1987 1992 1997 2002 2007<br />
year<br />
Figure 3-2. Time series of phenological phases of common lilac, apple and olive trees, 5-year<br />
flexible mean values and l<strong>in</strong>ear trends for Daruvar, Zagreb, Gospić, Rab and Hvar mostly with<strong>in</strong><br />
the period 1961–2008. x is a number of years (1,2…n).<br />
References:<br />
Mitchell J. M. Jr., Dzerdzeevskii B., Flohn H., Hofmeyr W. L., Lamb H.H., Rao K.H., C.C. Wallen: 1966:<br />
Climatic Change, WMO Tech. Note 79, 58–75.<br />
Vučetić, M., V. Vučetić, 1996: The phenological analysis of almond culture along the Adriatic coast,<br />
Biometeorology, 14, 247–254.<br />
Vučetić, M., Ž. Lončar, 2006: Grow<strong>in</strong>g degree days between the phenological phases of forest trees and<br />
shrubs <strong>in</strong> the NW part of <strong>Croatia</strong>, Zbornik sažetaka s 6 th European Conference on Applied<br />
Climatology, Ljubljana, 4–8. rujna 2006, 1 str. (CD-ROM).<br />
Vučetić, V., M. Vučetić, 2003: Fenološke značajke na području Zavižana, Šumarski list, 7-8, 359–372.<br />
41
Vučetić, V., M. Vučetić, 2005: Variations of phenological stages of olive-trees along the Adriatic coast,<br />
Periodicum Biologorum, 107, 335–340.<br />
Vučetić, V., M. Vučetić, 2006: Phenological fluctuations as a possible signal of climatic <strong><strong>change</strong>s</strong> <strong>in</strong> the<br />
<strong>Croatia</strong>n mounta<strong>in</strong> area, Meteorologische Zeitschift, 15, 2, 237–242.<br />
Vučetić, V., M. Vučetić, M., Ž. Lončar, 2008: History and present observations <strong>in</strong> <strong>Croatia</strong>n plant<br />
phenology, poglavlje u knjizi, The history and current status of plant phenology <strong>in</strong> Europe (COST<br />
725, Nekovar, J. (ur.)), 44–50.<br />
42
3.2. <strong>Climate</strong> <strong>change</strong> impact on wildfire danger<br />
<strong>Croatia</strong>n Adriatic coast, particularly islands, is a typical example of area where the<br />
common <strong>in</strong>terconnection between water (precipitation) and fire is fully expressed. Generally it<br />
can be said that <strong>in</strong> summer a number of fires and burned areas grow from the north to the south,<br />
as well as from the <strong>in</strong>land to the coat and islands, while <strong>in</strong> w<strong>in</strong>ter and early spr<strong>in</strong>g is vice versa.<br />
Even the precipitation amount is decreased from north to south and from <strong>in</strong>land to islands. Due<br />
to its specificity, the most endangered areas consider<strong>in</strong>g forest fires are islands, among them<br />
particularly middle Dalmatian islands. Results of global and regional models <strong>in</strong>dicate that the<br />
largest <strong><strong>change</strong>s</strong> could be expected <strong>in</strong> coastal southern part of Adriatic.<br />
In <strong>Croatia</strong> there are 450 fires <strong>in</strong> average per year and burned area of 9000 ha. In the last<br />
10 years the largest number of forest fires, total of 730, was recorded <strong>in</strong> 2000, when 27400 ha<br />
burned out. In extremely hot and dry years, such as 1998, 2003 and 2007, above average<br />
number of forest fires was recorded <strong>in</strong> the Adriatic area.<br />
For already 30 years The Meteorological and Hydrological Service has been apply<strong>in</strong>g the<br />
Canadian method Fire Weather Index (FWI) to assess a danger of forest fires at the Adriatic. By<br />
means of FWI daily severity rat<strong>in</strong>g (DSR) is determ<strong>in</strong>ed, i.e. assessment of potential danger<br />
accord<strong>in</strong>g to relation:<br />
DSR = 0.0272 FWI 1.77<br />
Mean Monthly Severity Rat<strong>in</strong>g (MSR) or mean Seasonal Severity Rat<strong>in</strong>g (SSR) are<br />
calculated from DSR. Generally, SSR values above 7 <strong>in</strong>dicate extreme potential danger, values<br />
between 3 and 7 are large to very large, values between 1 and 3 are moderate, while values<br />
less than 1 are equal to small potential danger.<br />
As severity assessment conta<strong>in</strong>s meteorological conditions, as well as moisture dead fuel<br />
, MSR and SSR serve for <strong>climate</strong>-fire review of average state <strong>in</strong> certa<strong>in</strong> area per months and fire<br />
season. DSR daily values could be <strong>in</strong>dicator of <strong>change</strong> of state from hour to hour for fast act<strong>in</strong>g<br />
and distribution of fire brigades <strong>in</strong> endangered area.<br />
For the analysis of MSR secular variations, long-term time series of meteorological<br />
stations Crikvenica (1891–2005) and Hvar (1867–2005) as representatives for <strong>climate</strong><br />
conditions of northern and middle Adriatic (Fig. 3-1). Due to a higher mean monthly air<br />
temperature and lower precipitation amount <strong>in</strong> Hvar than <strong>in</strong> Crikvenica, MSR is 2-3 times larger<br />
than <strong>in</strong> middle Adriatic <strong>in</strong> relation to the northern (Table 7-3).<br />
In order to determ<strong>in</strong>e possible danger <strong>in</strong>crease of forest fires at Adriatic, l<strong>in</strong>ear trends for<br />
MSR and non-parametric Mann-Kendall rank test have been analyzed for Crikvenica and Hvar<br />
43
with<strong>in</strong> the season from May to September (Table 3-4 and Fig. 3-3). Significant <strong>in</strong>crease of<br />
potential danger is notified <strong>in</strong> Crikvenica <strong>in</strong> all months of fire season, while <strong>in</strong> Hvar <strong>in</strong> June and<br />
July. Progressive test <strong>in</strong>dicates a beg<strong>in</strong>n<strong>in</strong>g of MSR <strong>in</strong>crease <strong>in</strong> early 1980’s, while trends<br />
became significant by the beg<strong>in</strong>n<strong>in</strong>g of the 21 st century.<br />
Comparison of mean MSR secular values with an average from the period 1961.–1990.<br />
<strong>in</strong>dicates similar values <strong>in</strong> Crikvenica and less <strong>in</strong> Hvar for long-time period <strong>in</strong> relation to a<br />
normal.<br />
Table 3-3. Mean (MEAN), maximum (MAX) and m<strong>in</strong>imum (MIN) monthly severity rat<strong>in</strong>g MSR<br />
along with related standard deviation (STD) and amplitude (AMPL = MAX - MIN) for Crikvenica<br />
(1891–2005) and Hvar (1867–2005), as well as a comparison with a normal 1961–1990.<br />
MONTHS May June July August September<br />
CRIKVENICA (1891-2005)<br />
MEAN 0.9 1.3 3.2 3.8 1.7<br />
STD 0.8 1.1 2.3 3.6 2.1<br />
MAX 3.3 4.4 7.8 16.9 10.5<br />
MIN 0.0 0.0 0.6 0.3 0.1<br />
AMPL 3.3 4.4 7.2 16.6 10.5<br />
CRIKVENICA (1961-1990)<br />
MEAN 0.8 1.3 2.6 3.2 1.8<br />
STD 1.3 1.3 2.2 3.2 2.0<br />
MAX 5.6 6.4 10.9 23.7 19.8<br />
MIN 0.0 0.0 0.1 0.0 0.0<br />
AMPL 5.6 6.4 10.8 23.7 19.8<br />
HVAR (1867-2005)<br />
MEAN 2.5 4.1 6.9 7.1 4.4<br />
STD 1.9 2.8 3.3 3.2 3.4<br />
MAX 10.1 12.5 22.2 17.8 18.0<br />
MIN 0.1 0.5 1.2 1.8 0.0<br />
AMPL 10.1 12.0 21.0 16.0 18.0<br />
HVAR (1961-1990)<br />
MEAN 3.0 4.5 8.0 8.2 4.9<br />
STD 1.7 2.4 2.9 3.6 3.6<br />
MAX 7.0 10.6 13.2 16.8 14.7<br />
MIN 0.5 0.7 2.5 2.8 0.6<br />
AMPL 6.4 9.9 10.6 14.0 14.1<br />
44
MSR<br />
MSR<br />
MSR<br />
15<br />
12<br />
9<br />
6<br />
3<br />
CRIKVENICA (1891-2005)<br />
June<br />
y = 0.0174x + 0.29<br />
0<br />
1891 1901 1911 1921 1931 1941 1951 1961 1971 1981 1991 2001<br />
year<br />
30<br />
25<br />
20<br />
15<br />
10<br />
5<br />
CRIKVENICA (1891-2005)<br />
July<br />
y = 0.0297x + 0.88<br />
0<br />
1891 1901 1911 1921 1931 1941 1951 1961 1971 1981 1991 2001<br />
year<br />
15<br />
12<br />
9<br />
6<br />
3<br />
CRIKVENICA (1891-2005)<br />
August<br />
y = 0.0293x + 1.56<br />
0<br />
1891 1901 1911 1921 1931 1941 1951 1961 1971 1981 1991 2001<br />
year<br />
MSR<br />
MSR<br />
MSR<br />
15<br />
12<br />
9<br />
6<br />
3<br />
HVAR (1867-2005)<br />
June<br />
y = 0.0075x + 3.55<br />
0<br />
1867 1882 1897 1912 1927 1942 1957 1972 1987 2002<br />
year<br />
30<br />
25<br />
20<br />
15<br />
10<br />
5<br />
HVAR (1867-2005)<br />
July<br />
y = 0.0107x + 6.20<br />
0<br />
1867 1882 1897 1912 1927 1942 1957 1972 1987 2002<br />
year<br />
15<br />
12<br />
9<br />
6<br />
3<br />
HVAR (1867-2005)<br />
August<br />
y = 0.0131x + 6.20<br />
0<br />
1867 1882 1897 1912 1927 1942 1957 1972 1987 2002<br />
year<br />
Figure 3-3. Time series of monthly severity rate MSR, 5-year mov<strong>in</strong>g average and l<strong>in</strong>ear trends<br />
for meteorological stations Crikvenica (1891–2006) and Hvar (1867–2005). x is a number of<br />
years (1,2…n).<br />
45
Increased forest fire risk, notified <strong>in</strong> June, is particularly important as it <strong>in</strong>dicates to earlier<br />
beg<strong>in</strong>n<strong>in</strong>g of fire season at Adriatic. However, the analysis also shows the expansion of the area<br />
with <strong>in</strong>creased forest fire risk from the middle to northern Adriatic, especially <strong>in</strong> July and August.<br />
Reason of <strong>in</strong>creased forest fire risk at northern Adriatic is due to a significant <strong>in</strong>crease of mean<br />
air temperature and significant decrease of precipitation <strong>in</strong> summer.<br />
References:<br />
Sneyers, R., 1990: On the Statistical analysis of series of observations, WMO Tech. Note, 143, 1–15.<br />
Van Wagner C.E., 1974.: Structure of the Canadian forest fire weather <strong>in</strong>dex, Department of the<br />
Environment, Canadian Forestry Service, Publ. No. 1333, Ottava, 44 pp.<br />
Van Wagner C.E., T.L. Pickett, 1985: Equations and Fortran Program for the Canadian Forest Fire<br />
Weather Index System, Canadian Forestry Service, Government of Canada, Forestry Technical<br />
Report, 33 pp.<br />
Vučetić, M., 1987: Meteorološka analiza katastrofalnog šumskog požara na Korčuli 1985, Rasprave-<br />
Papers, 22, 67–72.<br />
Vučetić, M., 1992: Vremenske prilike tijekom šumskog požara na otoku Hvaru 13–31.7.1990, Hrvatski<br />
meteorološki časopis, 27, 69–76.<br />
Vučetić, M., 1998: The <strong>in</strong>fluence of weather condition on forest fire on the island of Hvar, 28 July–4<br />
August 1997, Zbornik radova III International Conference on Forest Fire Research, Vol. I, Luso,<br />
Portugal, 16–20 studeni 1998,1295–1303.<br />
Vučetić, M., V. Vučetić,1999: Different types of the forest fires on the <strong>Croatia</strong>n coast, Zbornik radova sa<br />
Symposium Forest Fires: Needs and Innovations, DELFI99, Athens, Greece, 17–20 studeni 1999,<br />
365–369.<br />
Vučetić, M., 2001: Vremenske prilike i šumski požari na hrvatskom priobalju tijekom 2000., Šumarski list,<br />
7–8, 367–378.<br />
Vučetić, M., 2002: Vremenske prilike i usporedba sezone zaštite šuma od požara 2001. u odnosu na<br />
višegodišnji prosjek, Šumarski list, 11–12, 563–574.<br />
Vučetić, M., V. Vučetić, 2002: Vrijeme na Jadranu – Meteorologija za nautičare, Fabra d.o.o., Zagreb, 129<br />
pp.<br />
Vučetić, M., Vučetić, V., Španjol, Ž., Barčić, D., Rosavec, R., A. Mandić, 2006: Secular variations of<br />
monthly severity rat<strong>in</strong>g on the <strong>Croatia</strong>n Adriatic coast dur<strong>in</strong>g the forest fire season, Forest Ecology<br />
and Management, 234 suplement 1, 251–261.<br />
46