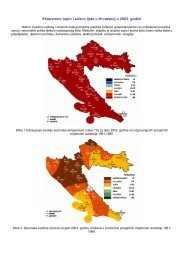
Observed climate changes in Croatia Climate change scenario
Observed climate changes in Croatia Climate change scenario
Observed climate changes in Croatia Climate change scenario

Create successful ePaper yourself
Turn your PDF publications into a flip-book with our unique Google optimized e-Paper software.
Anomalies (°C)<br />
Anomalies (°C)<br />
Anomalies (°C)<br />
2.5<br />
2.0<br />
1.5<br />
1.0<br />
0.5<br />
0.0<br />
-0.5<br />
-1.0<br />
-1.5<br />
-2.0<br />
OSIJEK<br />
-2.5<br />
1900 1910 1920 1930 1940 1950 1960 1970 1980 1990 2000 2010<br />
Years<br />
2.5<br />
2.0<br />
1.5<br />
1.0<br />
0.5<br />
0.0<br />
-0.5<br />
-1.0<br />
-1.5<br />
-2.0<br />
ZAGREB-GRIČ<br />
-2.5<br />
1900 1910 1920 1930 1940 1950 1960 1970 1980 1990 2000 2010<br />
Years<br />
2.5<br />
2.0<br />
1.5<br />
1.0<br />
0.5<br />
0.0<br />
-0.5<br />
-1.0<br />
-1.5<br />
-2.0<br />
GOSPIĆ<br />
-2.5<br />
1900 1910 1920 1930 1940 1950 1960 1970 1980 1990 2000 2010<br />
Years<br />
Anomalies (°C)<br />
Anomalies (°C)<br />
2.5<br />
2.0<br />
1.5<br />
1.0<br />
0.5<br />
0.0<br />
-0.5<br />
-1.0<br />
-1.5<br />
-2.0<br />
CRIKVENICA<br />
-2.5<br />
1900 1910 1920 1930 1940 1950 1960 1970 1980 1990 2000 2010<br />
Years<br />
2.5<br />
2.0<br />
1.5<br />
1.0<br />
0.5<br />
0.0<br />
-0.5<br />
-1.0<br />
-1.5<br />
-2.0<br />
HVAR<br />
-2.5<br />
1900 1910 1920 1930 1940 1950 1960 1970 1980 1990 2000 2010<br />
Years<br />
19 19 19 19 19 19 19 20 20<br />
0010<br />
203040<br />
5060<br />
708090<br />
0010<br />
1901-2008<br />
1909-2008<br />
1934-2008<br />
1959-2008<br />
1984-2008<br />
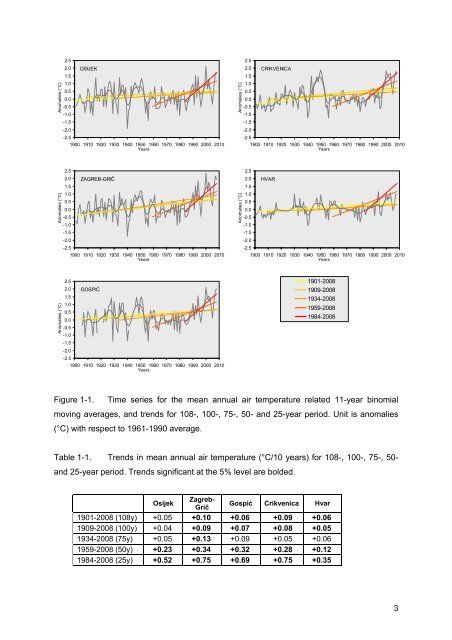
Figure 1-1. Time series for the mean annual air temperature related 11-year b<strong>in</strong>omial<br />
mov<strong>in</strong>g averages, and trends for 108-, 100-, 75-, 50- and 25-year period. Unit is anomalies<br />
(°C) with respect to 1961-1990 average.<br />
Table 1-1. Trends <strong>in</strong> mean annual air temperature (°C/10 years) for 108-, 100-, 75-, 50and<br />
25-year period. Trends significant at the 5% level are bolded.<br />
Osijek<br />
Zagreb-<br />
Grič<br />
Gospić Crikvenica Hvar<br />
1901-2008 (108y) +0.05 +0.10 +0.06 +0.09 +0.06<br />
1909-2008 (100y) +0.04 +0.09 +0.07 +0.08 +0.05<br />
1934-2008 (75y) +0.05 +0.13 +0.09 +0.05 +0.06<br />
1959-2008 (50y) +0.23 +0.34 +0.32 +0.28 +0.12<br />
1984-2008 (25y) +0.52 +0.75 +0.69 +0.75 +0.35<br />
3