Observed climate changes in Croatia Climate change scenario
Observed climate changes in Croatia Climate change scenario
Observed climate changes in Croatia Climate change scenario

You also want an ePaper? Increase the reach of your titles
YUMPU automatically turns print PDFs into web optimized ePapers that Google loves.
northern part of the doma<strong>in</strong>, whereas above our areas the northern w<strong>in</strong>d component will be<br />
strengthened, although the westerly w<strong>in</strong>d will still prevail.<br />
2.3. Surface fields<br />
2.3.1 Temperature at 2 m (T2m)<br />
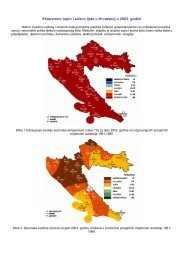
In all seasons temperature at 2 m will be <strong>in</strong>creased <strong>in</strong> future <strong>climate</strong> (Fig. 2-2); this is<br />
statistically significant even at the 99% confidence level. However, warm<strong>in</strong>g of the European<br />
cont<strong>in</strong>ent is not the same across the seasons. For example, <strong>in</strong> w<strong>in</strong>ter and spr<strong>in</strong>g, the warm<strong>in</strong>g is<br />
larger <strong>in</strong> the north-eastern part of Europe than <strong>in</strong> the Mediterranean (Fig. 2-2 a,b). Such a<br />
differential field <strong>in</strong> T2m is reflected on the <strong>Croatia</strong>n region as well, where a temperature <strong>in</strong>crease<br />
<strong>in</strong> w<strong>in</strong>ter is slightly higher <strong>in</strong> the northern part (for approximately 1.8 °C), and less pronounced <strong>in</strong><br />
the southern parts of the country (about 1.5 °C; Fig. 2-2a). The warm<strong>in</strong>g <strong>in</strong> future <strong>climate</strong>,<br />
<strong>in</strong>dicated <strong>in</strong> Fig. 2-2a, is smaller, on average, for about 0.5-1.0 degree than the warm<strong>in</strong>g<br />
obta<strong>in</strong>ed by EH5OM global model (Branković et al. 2010). In spr<strong>in</strong>g, an <strong>in</strong>crease <strong>in</strong> temperature<br />
is relatively uniform throughout <strong>Croatia</strong> (Fig. 2-2b), and, with the amplitude of warm<strong>in</strong>g of about<br />
1.5 °C, it is quite similar to w<strong>in</strong>ter warm<strong>in</strong>g.<br />
In summer and autumn, warm<strong>in</strong>g is more pronounced <strong>in</strong> south Europe and along the<br />
coastal part of the Mediterranean (Fig. 2-2 c,d), and significantly exceeds the warm<strong>in</strong>g from<br />
colder part of the year. For example, above the Iberian Pen<strong>in</strong>sula, amplitude exceeds 4 °C <strong>in</strong><br />
summer, while <strong>in</strong> <strong>Croatia</strong> the warm<strong>in</strong>g is between 2 °C <strong>in</strong> the northern and almost 3 °C <strong>in</strong> the<br />
southern part of the country. In autumn, the T2m <strong>in</strong>crease will be between 1.5 °C <strong>in</strong> a larger<br />
portion of the cont<strong>in</strong>ental <strong>Croatia</strong> and slightly above 2 °C <strong>in</strong> the coastal zone, as well as <strong>in</strong> Istria<br />
and the Dalmatian h<strong>in</strong>terland. In summer, the warm<strong>in</strong>g is similar to that from the w<strong>in</strong>ter period<br />
(Fig. 2-2c), and for approximately 1 °C smaller than <strong>in</strong> EH5OM global model. The differences <strong>in</strong><br />
the future T2m warm<strong>in</strong>g between global and regional model can be the consequence of various<br />
factors or of their comb<strong>in</strong>ation. Probably the ma<strong>in</strong> source of largest differences between the<br />
models is differently def<strong>in</strong>ed parameterization of unresolved physical processes. However, the<br />
differences could be also attributed to a more detailed (better) orography resolution <strong>in</strong> the<br />
regional model.<br />
The above warm<strong>in</strong>g is calculated as the mean value of the three-member ensemble.<br />
Unlike the ensemble mean, <strong>change</strong> <strong>in</strong> temperature <strong>in</strong>terannual variability, expressed by<br />
standard deviation, <strong>in</strong>dicates only a slight <strong>in</strong>crease of temperature variability <strong>in</strong> future <strong>climate</strong><br />
(not shown). The T2m standard deviation has a maximum a little higher than 0.3 °C <strong>in</strong> summer<br />
<strong>in</strong> the eastern and southern <strong>Croatia</strong> – that is much lower than mean values from Fig. 2-2. In<br />
autumn and w<strong>in</strong>ter, the <strong>change</strong> <strong>in</strong> variability is even smaller, with no <strong>change</strong> at all <strong>in</strong> spr<strong>in</strong>g.<br />
22