Observed climate changes in Croatia Climate change scenario
Observed climate changes in Croatia Climate change scenario
Observed climate changes in Croatia Climate change scenario

Create successful ePaper yourself
Turn your PDF publications into a flip-book with our unique Google optimized e-Paper software.
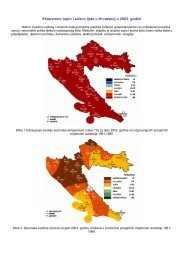
Figure 1-7. Trend results for maximum durations of dry spells for precipitation threshold of 1 mm (left<br />
column) and 10 mm (right column), for seasons (upper four rows) and a year (lower row). Circles <strong>in</strong>dicate<br />
positive trend, triangles negative trend, while symbols <strong>in</strong> bold type <strong>in</strong>dicate statistically significant trend.<br />
Size of symbols is proportional to the absolute value of <strong>change</strong> per decade relative to the respective<br />
average: 1-5%/10years, 5-10%/10 years and larger than 10%. Squares <strong>in</strong>dicate trend between +/-<br />
1%/10years.<br />
16