Certificate of Approval
Certificate of Approval
Certificate of Approval

Create successful ePaper yourself
Turn your PDF publications into a flip-book with our unique Google optimized e-Paper software.
Hilti HSC / HSC-R safety anchor Page 6 <strong>of</strong> 11<br />
Assessment report for approval Report no. 7517.02<br />
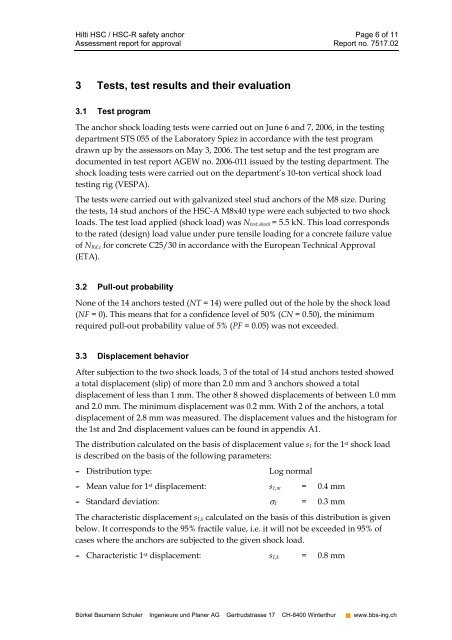
3 Tests, test results and their evaluation<br />
3.1 Test program<br />
The anchor shock loading tests were carried out on June 6 and 7, 2006, in the testing<br />
department STS 055 <strong>of</strong> the Laboratory Spiez in accordance with the test program<br />
drawn up by the assessors on May 3, 2006. The test setup and the test program are<br />
documented in test report AGEW no. 2006-011 issued by the testing department. The<br />
shock loading tests were carried out on the department’s 10-ton vertical shock load<br />
testing rig (VESPA).<br />
The tests were carried out with galvanized steel stud anchors <strong>of</strong> the M8 size. During<br />
the tests, 14 stud anchors <strong>of</strong> the HSC-A M8x40 type were each subjected to two shock<br />
loads. The test load applied (shock load) was Ntest,shock = 5.5 kN. This load corresponds<br />
to the rated (design) load value under pure tensile loading for a concrete failure value<br />
<strong>of</strong> NRd,c for concrete C25/30 in accordance with the European Technical <strong>Approval</strong><br />
(ETA).<br />
3.2 Pull-out probability<br />
None <strong>of</strong> the 14 anchors tested (NT = 14) were pulled out <strong>of</strong> the hole by the shock load<br />
(NF = 0). This means that for a confidence level <strong>of</strong> 50% (CN = 0.50), the minimum<br />
required pull-out probability value <strong>of</strong> 5% (PF = 0.05) was not exceeded.<br />
3.3 Displacement behavior<br />
After subjection to the two shock loads, 3 <strong>of</strong> the total <strong>of</strong> 14 stud anchors tested showed<br />
a total displacement (slip) <strong>of</strong> more than 2.0 mm and 3 anchors showed a total<br />
displacement <strong>of</strong> less than 1 mm. The other 8 showed displacements <strong>of</strong> between 1.0 mm<br />
and 2.0 mm. The minimum displacement was 0.2 mm. With 2 <strong>of</strong> the anchors, a total<br />
displacement <strong>of</strong> 2.8 mm was measured. The displacement values and the histogram for<br />
the 1st and 2nd displacement values can be found in appendix A1.<br />
The distribution calculated on the basis <strong>of</strong> displacement value s1 for the 1 st shock load<br />
is described on the basis <strong>of</strong> the following parameters:<br />
– Distribution type: Log normal<br />
– Mean value for 1 st displacement: s1,m = 0.4 mm<br />
– Standard deviation: σ1 = 0.3 mm<br />
The characteristic displacement s1,k calculated on the basis <strong>of</strong> this distribution is given<br />
below. It corresponds to the 95% fractile value, i.e. it will not be exceeded in 95% <strong>of</strong><br />
cases where the anchors are subjected to the given shock load.<br />
– Characteristic 1 st displacement: s1,k = 0.8 mm<br />
Bürkel Baumann Schuler Ingenieure und Planer AG Gertrudstrasse 17 CH-8400 Winterthur � www.bbs-ing.ch