2009 Annual Report - Toromont Industries Ltd.
2009 Annual Report - Toromont Industries Ltd.
2009 Annual Report - Toromont Industries Ltd.

You also want an ePaper? Increase the reach of your titles
YUMPU automatically turns print PDFs into web optimized ePapers that Google loves.
180 180<br />
160 160<br />
140 140<br />
120 120<br />
100 100<br />
09<br />
Compression Group<br />
TOROMONT INDUSTRIES LTD. employed over 3,800 people in 129<br />
locations, predominantly in Canada and the United States at the end<br />
of <strong>2009</strong>. With the acquisition of Enerflex in January 2010, this scope<br />
increases significantly (see page 4). Our common shares are listed<br />
on the Toronto Stock Exchange under the symbol TIH. We serve our<br />
customers through two business groups: Equipment and Compression.<br />
Equipment Group<br />
We sell, rent and service a broad range of mobile equipment<br />
and industrial engines through our Caterpillar dealership<br />
and Battlefield – The CAT Rental Store in Ontario, Manitoba,<br />
Newfoundland, and most of Labrador and Nunavut.<br />
Financial Highlights<br />
We design, engineer, fabricate, install and service natural gas<br />
compression units and hydrocarbon and petrochemical process<br />
systems through <strong>Toromont</strong> Energy Systems (renamed Enerflex in<br />
2010) and industrial and recreational refrigeration systems through<br />
CIMCO Refrigeration.<br />
(in thousands except per share amounts and ratios) <strong>2009</strong> 2008 2007<br />
Revenues $ 1,824,592 $ 2,121,209 $ 1,886,761<br />
Operating income 182,352 207,854 180,123<br />
Net earnings 120,516 140,524 122,280<br />
Working capital 539,264 509,276 466,859<br />
Total assets 1,364,667 1,533,450 1,356,861<br />
Debt net of cash to equity (0.06:1) 0.05:1 0.19:1<br />
Shareholders’ equity 854,063 779,103 654,730<br />
– per share $ 13.17 $ 12.06 $ 10.08<br />
Earnings per share – basic 1.86 2.16 1.89<br />
Dividends per share 0.60 0.56 0.48<br />
Closing share price – TSX 27.79 22.99 28.26<br />
Return on opening shareholders’ equity 15.5% 21.5% 21.6%<br />
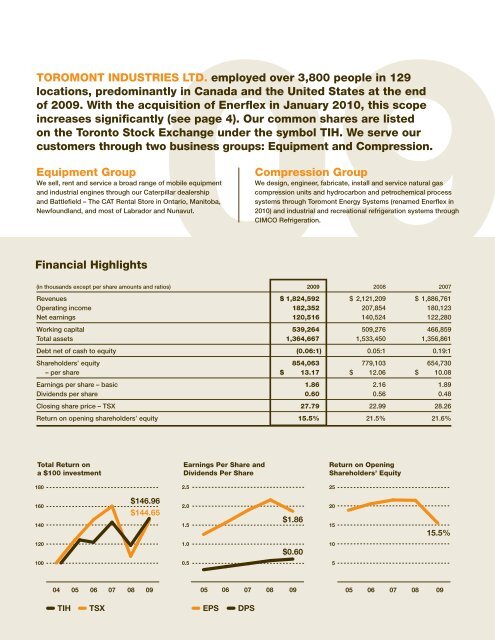
Total Return on<br />
a $100 investment<br />
180<br />
160<br />
140<br />
120<br />
100<br />
$146.96 $146.96 $146.96<br />
$144.65 $144.65 $144.65<br />
2.5<br />
2.0<br />
1.5<br />
1.0<br />
0.5<br />
04 0405 05 0406 06 0507 07 0608 08 0709 09 08 09 05 05 06 05 06 07 06 07 08 07 08 09 08 09 09 05 05 06 05 06 07 06 07 08 07 08 09 08 09 09<br />
TIH TIH<br />
TSX TIHTSX<br />
TSX EPS EPS EPS DPS DPS DPS<br />
2.5<br />
2.0<br />
1.5<br />
1.0<br />
0.5<br />
Earnings Per Share and<br />
Dividends Per Share<br />
2.5<br />
2.0<br />
1.5<br />
1.0<br />
0.5<br />
$1.86 $1.86 $1.86<br />
$0.60 $0.60 $0.60<br />
Return on Opening<br />
Shareholders’ Equity<br />
25<br />
20<br />
15<br />
10<br />
5<br />
25<br />
20<br />
15<br />
10<br />
5<br />
25<br />
20<br />
15<br />
10<br />
5<br />
15.5% 15.5% 15.5%