2009 Annual Report - Toromont Industries Ltd.
2009 Annual Report - Toromont Industries Ltd.
2009 Annual Report - Toromont Industries Ltd.

Create successful ePaper yourself
Turn your PDF publications into a flip-book with our unique Google optimized e-Paper software.
40 | TOROMONT <strong>2009</strong> ANNUAL REPORT<br />
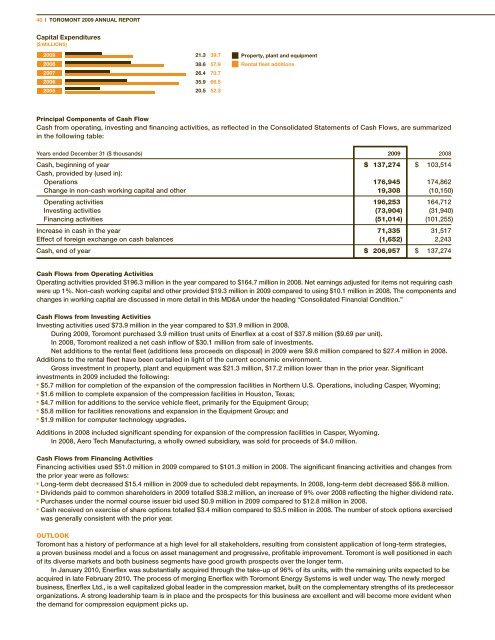
capital Expenditures<br />
($ MiLLiONs)<br />
<strong>2009</strong><br />
2008<br />
2007<br />
2006<br />
2005<br />
Principal Components of Cash Flow<br />
Cash from operating, investing and financing activities, as reflected in the Consolidated Statements of Cash Flows, are summarized<br />
in the following table:<br />
Years ended December 31 ($ thousands) <strong>2009</strong> 2008<br />
Cash, beginning of year<br />
Cash, provided by (used in):<br />
$ 137,274 $ 103,514<br />
Operations 176,945 174,862<br />
Change in non-cash working capital and other 19,308 (10,150)<br />
Operating activities 196,253 164,712<br />
Investing activities (73,904) (31,940)<br />
Financing activities (51,014) (101,255)<br />
Increase in cash in the year 71,335 31,517<br />
Effect of foreign exchange on cash balances (1,652) 2,243<br />
Cash, end of year $ 206,957 $ 137,274<br />
Cash Flows from Operating Activities<br />
Operating activities provided $196.3 million in the year compared to $164.7 million in 2008. Net earnings adjusted for items not requiring cash<br />
were up 1%. Non-cash working capital and other provided $19.3 million in <strong>2009</strong> compared to using $10.1 million in 2008. The components and<br />
changes in working capital are discussed in more detail in this MD&A under the heading “Consolidated Financial Condition.”<br />
Cash Flows from Investing Activities<br />
Investing activities used $73.9 million in the year compared to $31.9 million in 2008.<br />
During <strong>2009</strong>, <strong>Toromont</strong> purchased 3.9 million trust units of Enerflex at a cost of $37.8 million ($9.69 per unit).<br />
In 2008, <strong>Toromont</strong> realized a net cash inflow of $30.1 million from sale of investments.<br />
Net additions to the rental fleet (additions less proceeds on disposal) in <strong>2009</strong> were $9.6 million compared to $27.4 million in 2008.<br />
Additions to the rental fleet have been curtailed in light of the current economic environment.<br />
Gross investment in property, plant and equipment was $21.3 million, $17.2 million lower than in the prior year. Significant<br />
investments in <strong>2009</strong> included the following:<br />
n $5.7 million for completion of the expansion of the compression facilities in Northern U.S. Operations, including Casper, Wyoming;<br />
n $1.6 million to complete expansion of the compression facilities in Houston, Texas;<br />
n $4.7 million for additions to the service vehicle fleet, primarily for the Equipment Group;<br />
n $5.8 million for facilities renovations and expansion in the Equipment Group; and<br />
n $1.9 million for computer technology upgrades.<br />
Additions in 2008 included significant spending for expansion of the compression facilities in Casper, Wyoming.<br />
In 2008, Aero Tech Manufacturing, a wholly owned subsidiary, was sold for proceeds of $4.0 million.<br />
Cash Flows from Financing Activities<br />
Financing activities used $51.0 million in <strong>2009</strong> compared to $101.3 million in 2008. The significant financing activities and changes from<br />
the prior year were as follows:<br />
n Long-term debt decreased $15.4 million in <strong>2009</strong> due to scheduled debt repayments. In 2008, long-term debt decreased $56.8 million.<br />
n Dividends paid to common shareholders in <strong>2009</strong> totalled $38.2 million, an increase of 9% over 2008 reflecting the higher dividend rate.<br />
n Purchases under the normal course issuer bid used $0.9 million in <strong>2009</strong> compared to $12.8 million in 2008.<br />
n Cash received on exercise of share options totalled $3.4 million compared to $3.5 million in 2008. The number of stock options exercised<br />
was generally consistent with the prior year.<br />
21.3<br />
38.6<br />
26.4<br />
35.9<br />
20.5<br />
39.7<br />
57.9<br />
70.7<br />
66.5<br />
52.3<br />
Property, plant and equipment<br />
Rental fleet additions<br />
OUTLOOK<br />
<strong>Toromont</strong> has a history of performance at a high level for all stakeholders, resulting from consistent application of long-term strategies,<br />
a proven business model and a focus on asset management and progressive, profitable improvement. <strong>Toromont</strong> is well positioned in each<br />
of its diverse markets and both business segments have good growth prospects over the longer term.<br />
In January 2010, Enerflex was substantially acquired through the take-up of 96% of its units, with the remaining units expected to be<br />
acquired in late February 2010. The process of merging Enerflex with <strong>Toromont</strong> Energy Systems is well under way. The newly merged<br />
business, Enerflex <strong>Ltd</strong>., is a well capitalized global leader in the compression market, built on the complementary strengths of its predecessor<br />
organizations. A strong leadership team is in place and the prospects for this business are excellent and will become more evident when<br />
the demand for compression equipment picks up.