2009 Annual Report - Toromont Industries Ltd.
2009 Annual Report - Toromont Industries Ltd.
2009 Annual Report - Toromont Industries Ltd.

You also want an ePaper? Increase the reach of your titles
YUMPU automatically turns print PDFs into web optimized ePapers that Google loves.
<strong>2009</strong><br />
<strong>Annual</strong> <strong>Report</strong><br />
The Future<br />
of Enerflex<br />
Our natural gas and process compression<br />
business in profile | Pg 04<br />
Forging a Precious<br />
Relationship<br />
<strong>Toromont</strong> stakes its claim with<br />
senior gold producer | Pg 13
180 180<br />
160 160<br />
140 140<br />
120 120<br />
100 100<br />
09<br />
Compression Group<br />
TOROMONT INDUSTRIES LTD. employed over 3,800 people in 129<br />
locations, predominantly in Canada and the United States at the end<br />
of <strong>2009</strong>. With the acquisition of Enerflex in January 2010, this scope<br />
increases significantly (see page 4). Our common shares are listed<br />
on the Toronto Stock Exchange under the symbol TIH. We serve our<br />
customers through two business groups: Equipment and Compression.<br />
Equipment Group<br />
We sell, rent and service a broad range of mobile equipment<br />
and industrial engines through our Caterpillar dealership<br />
and Battlefield – The CAT Rental Store in Ontario, Manitoba,<br />
Newfoundland, and most of Labrador and Nunavut.<br />
Financial Highlights<br />
We design, engineer, fabricate, install and service natural gas<br />
compression units and hydrocarbon and petrochemical process<br />
systems through <strong>Toromont</strong> Energy Systems (renamed Enerflex in<br />
2010) and industrial and recreational refrigeration systems through<br />
CIMCO Refrigeration.<br />
(in thousands except per share amounts and ratios) <strong>2009</strong> 2008 2007<br />
Revenues $ 1,824,592 $ 2,121,209 $ 1,886,761<br />
Operating income 182,352 207,854 180,123<br />
Net earnings 120,516 140,524 122,280<br />
Working capital 539,264 509,276 466,859<br />
Total assets 1,364,667 1,533,450 1,356,861<br />
Debt net of cash to equity (0.06:1) 0.05:1 0.19:1<br />
Shareholders’ equity 854,063 779,103 654,730<br />
– per share $ 13.17 $ 12.06 $ 10.08<br />
Earnings per share – basic 1.86 2.16 1.89<br />
Dividends per share 0.60 0.56 0.48<br />
Closing share price – TSX 27.79 22.99 28.26<br />
Return on opening shareholders’ equity 15.5% 21.5% 21.6%<br />
Total Return on<br />
a $100 investment<br />
180<br />
160<br />
140<br />
120<br />
100<br />
$146.96 $146.96 $146.96<br />
$144.65 $144.65 $144.65<br />
2.5<br />
2.0<br />
1.5<br />
1.0<br />
0.5<br />
04 0405 05 0406 06 0507 07 0608 08 0709 09 08 09 05 05 06 05 06 07 06 07 08 07 08 09 08 09 09 05 05 06 05 06 07 06 07 08 07 08 09 08 09 09<br />
TIH TIH<br />
TSX TIHTSX<br />
TSX EPS EPS EPS DPS DPS DPS<br />
2.5<br />
2.0<br />
1.5<br />
1.0<br />
0.5<br />
Earnings Per Share and<br />
Dividends Per Share<br />
2.5<br />
2.0<br />
1.5<br />
1.0<br />
0.5<br />
$1.86 $1.86 $1.86<br />
$0.60 $0.60 $0.60<br />
Return on Opening<br />
Shareholders’ Equity<br />
25<br />
20<br />
15<br />
10<br />
5<br />
25<br />
20<br />
15<br />
10<br />
5<br />
25<br />
20<br />
15<br />
10<br />
5<br />
15.5% 15.5% 15.5%
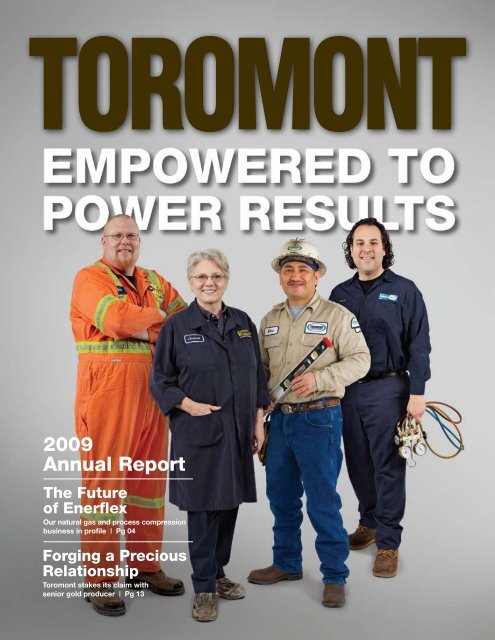
contents<br />
Empowered to<br />
power Results<br />
Delivering profitable growth is a team<br />
effort. <strong>Toromont</strong> fuels performance<br />
through a decentralized approach –<br />
empowering business unit leaders and<br />
their teams to produce ever increasing<br />
value to our customers and shareholders.<br />
On OUR cOvER<br />
Rob VanRoon, Battlefield<br />
Joanne Wilson, <strong>Toromont</strong> CAT<br />
Elias Leon, TESI<br />
Dave Parise, CIMCO<br />
ABOvE<br />
From left to right:<br />
Mike Storring, <strong>Toromont</strong> CAT<br />
Tony Joosse, Battlefield<br />
Mark Szilard, CIMCO<br />
Michael Smith, TESI<br />
Jennifer Cochrane, TIL<br />
Haley Coito, <strong>Toromont</strong> CAT<br />
Kevin Rolston, Battlefield<br />
Kelli Celeste, CIMCO<br />
Lynn Chang, CIMCO<br />
Frank Crummey, <strong>Toromont</strong> CAT<br />
Jon Brown, Battlefield<br />
Peter McMurdo, <strong>Toromont</strong> CAT<br />
Nigel Watson, <strong>Toromont</strong> CAT<br />
FEATURES<br />
04 ThE FUTURE OF EnERFlEx<br />
BEginS nOw<br />
With global market reach and<br />
substantial capabilities, our natural<br />
gas compression and process<br />
business readies for value creation.<br />
08 A SOUThwESTERn SUccESS STORy<br />
Southwestern Energy’s pioneering<br />
efforts in Arkansas’ Fayetteville Shale<br />
play create opportunity for <strong>Toromont</strong>.<br />
10 wASTE nOT, wAnT nOT<br />
Helping an Ontario municipality realize<br />
value from landfill gas is a 24/7 job.<br />
13 FORging A pREciOUS<br />
RElATiOnShip<br />
<strong>Toromont</strong> people and equipment play<br />
a variety of important supporting roles<br />
at Goldcorp Inc. mines.<br />
02 lETTER TO ShAREhOldERS<br />
15 whEn ThE gOing gETS TOUgh,<br />
ThERE iS TOROmOnT SERvicE<br />
16 mOving mOUnTAinS pART OF dAy’S<br />
wORk AT lOng hARBOUR<br />
18 On ThE FROnT linES<br />
OF inFRASTRUcTURE<br />
20 cOld TEchnOlOgy, hOT EcOnOmicS<br />
23 EcO chill mAkES indUSTRiAl<br />
mARkET dEBUT<br />
24 13,000 cUSTOmERS, 36 STORES,<br />
OnE REnTAl cOmpAny<br />
27 A SAFE And SEcURE wORkplAcE<br />
28 cOmmUniTy SUppORT<br />
29 EnviROnmEnTAl STEwARdShip<br />
30 cORpORATE gOvERnAncE<br />
31 BOARd OF diREcTORS<br />
32 mAnAgEmEnT’S diScUSSiOn<br />
And AnAlySiS<br />
53 mAnAgEmEnT’S And<br />
AUdiTORS’ REpORTS<br />
54 FinAnciAlS
2 | TOROMONT <strong>2009</strong> ANNUAL REPORT<br />
dear Fellow<br />
Shareholders<br />
THE MARK OF A GOOD COMPANY IS THE ABILITY TO PERFORM THROUGH ALL PHASES<br />
OF THE ECONOMIC CYCLE. IN THE WORST ECONOMIC RECESSION IN A GENERATION,<br />
TOROMONT RAISED ITS DIVIDEND, DELIVERED PROFITABLE RESULTS, STRENGTHENED<br />
ITS BALANCE SHEET, MAINTAINED ITS STRONG CORE OF PEOPLE AND CAPABILITIES,<br />
AND ESTABLISHED ITSELF AS A GLOBAL COMPRESSION EQUIPMENT INDUSTRY LEADER<br />
BY MAKING THE LARGEST ACQUISITION IN ITS HISTORY.<br />
we are pleased to say that <strong>Toromont</strong> made the most of<br />
the recessionary environment. Through the disciplined<br />
work of our team and aggressive action taken at the<br />
first signs of the economic correction, we maintained our track<br />
record of strong performance during this challenging phase of<br />
the business cycle.<br />
Net income for <strong>2009</strong> was $120.5 million or $1.86 per share<br />
as all of our business units continued to operate profitably.<br />
Return on opening shareholders’ equity was 15.5%. Revenues<br />
were $1.8 billion, as the impact of the broad-based decline in<br />
customer spending was somewhat mitigated by product support.<br />
At year end, our cash exceeded our total debt, a financial<br />
position that reflects the ongoing strength of our operations,<br />
our enduring focus on disciplined capital management and a<br />
conscious effort to build our cash position in order to finance<br />
the acquisition of Enerflex.<br />
While the revenue and earnings records of the prior year<br />
remain unsurpassed – for now – <strong>Toromont</strong>’s long-term track<br />
record stands as the most important testament to the quality<br />
of our Company and its ability to create shareholder value.<br />
AdjUSTEd TO nEw REAliTiES<br />
It was not business as usual in <strong>2009</strong>. The global credit crisis<br />
affected our end markets, driving a significant decline in<br />
economic activity and reducing customer order volume in key<br />
sectors including construction and natural gas.<br />
With the support of our employees, <strong>Toromont</strong> adjusted to<br />
these conditions beginning in September of 2008. Across our<br />
Company, discretionary expenses were reduced, certain projects<br />
were deferred, salaries were frozen and work sharing as well as<br />
voluntary leaves were tools used to help maintain our strong core<br />
of people and capabilities while we await the economic upturn.<br />
Due to these adjustments, and the large backlogs carried over<br />
from 2008, <strong>Toromont</strong>’s results in <strong>2009</strong> were even stronger than<br />
we anticipated.<br />
What we did not adjust was our approach to business, which<br />
can be summarized as follows:<br />
n We supply highly specified capital equipment to broad markets<br />
and support our customers every step of the way as they use<br />
that equipment – a business model designed with capital<br />
spending trends in mind.<br />
n We strive for market leadership and operate only in those areas<br />
where we have a reasonable prospect of achieving it – because<br />
this is the best way to drive shareholder and customer value.<br />
n We settle for nothing less than the highly productive use<br />
of capital. Each of our businesses operates with an individually<br />
calibrated return on capital employed target and is held<br />
accountable for meeting that target as the price for receiving<br />
capital.<br />
n We trust our business leaders to make capital allocations. This<br />
trust is reflected in our decentralized management system,<br />
which, along with meaningful employee share ownership, is a<br />
trademark characteristic of our Company.<br />
n We pursue opportunities aggressively but never at the expense<br />
of ethical behaviour or employee safety – both of which are<br />
priorities for <strong>Toromont</strong>.
By remaining faithful to this formula and preserving our<br />
sales, engineering design and service capabilities through this<br />
downturn, <strong>Toromont</strong> made good things happen in <strong>2009</strong>.<br />
Among the notable highlights of the year in the Equipment Group:<br />
n Our installed equipment base in the mining sector surpassed<br />
the 1,000-unit level across 70 customer locations. Additions<br />
were made to fleets at Goldcorp, Vale Inco, Apollo Gold and<br />
Agnico Eagle Mines, Barrick – Hemlo, Sifto Salt – Goderich<br />
Mine, and Canadian Salt – Ojibway Mine. Reflecting the scope<br />
of our offering, these additions included underground and<br />
surface equipment, and prime and standby power systems – all<br />
provided by Caterpillar, the world leader in mining equipment<br />
and our partner for the past 16 years. Due to the steady<br />
increase in our installed base, parts and service sales to the<br />
mining industry have contributed almost $300 million to total<br />
revenue over the past five years.<br />
n Power systems activity was buoyant with strength in commercial<br />
applications such as telecommunications and banking, as<br />
well as municipal infrastructure and landfill gas to energy. As<br />
a result, <strong>Toromont</strong> CAT Power Systems had an excellent year.<br />
n While many competitors reduced rental fleets, Battlefield – The<br />
CAT Rental Store continued to invest to drive increased<br />
product availability, reliability and customer satisfaction.<br />
Unprecedented levels of government infrastructure spending<br />
intentions had limited impact on our Equipment Group<br />
businesses because of the length of time required for projects to<br />
become truly “shovel ready.” However, there is reason for<br />
optimism. Billions of dollars in public works funds must be spent<br />
by Canadian governments by March 2011 and as this deadline<br />
approaches, customers expect activity to intensify.<br />
The Compression Group completed a variety of customer<br />
projects:<br />
n In the United States, <strong>Toromont</strong> Energy Systems made sizeable<br />
deliveries for both the 1,679-mile Rockies Express Pipeline and<br />
the 500-mile Midcontinent Express Pipeline. Together, these<br />
two projects generated $173 million of revenue for <strong>Toromont</strong><br />
over the past two years.<br />
n Southwestern Energy (see page 8) purchased a number of<br />
compression packages for its Fayetteville Shale project.<br />
n Industrial refrigeration orders were received and delivered for<br />
Roche Canada, Walmart, Overwaitea Food Group, Nova<br />
Chemicals, ConAgra Foods ® , Loblaw Companies, Millard<br />
Refrigerated Services and Southern Cold Storage.<br />
n Spurred on by the $500 million Recreational Infrastructure<br />
Canada (RinC) program, CIMCO’s bookings were strong,<br />
including numerous orders for ECO CHILL. This environmentally<br />
friendly ice rink refrigeration system also made its first<br />
forays into the far larger industrial refrigeration market (see<br />
page 23).<br />
n The Orlando Magic purchased a CIMCO ice rink system for<br />
their multi-purpose arena scheduled to open in 2010. CIMCO<br />
has supplied and installed the rinks that sit below the hard<br />
court on every NBA facility constructed since 1990.<br />
In early 2010, we also celebrated the successful conclusion<br />
of the Vancouver Winter Olympics with the knowledge that<br />
CIMCO supplied refrigeration systems, engineering and service<br />
to eight Olympic venues.<br />
TOROMONT <strong>2009</strong> ANNUAL REPORT | 3<br />
EnERFlEx AcqUiSiTiOn<br />
In early 2010, <strong>Toromont</strong> acquired Enerflex Systems Income<br />
Fund and Enerflex Holdings Limited Partnership. This important<br />
transaction brings together Enerflex and <strong>Toromont</strong> Energy<br />
Systems to create a stronger organization better able to serve<br />
customers and compete globally.<br />
Headquartered in Calgary and with pro forma annual<br />
revenues of $1.5 billion, our new business is called Enerflex <strong>Ltd</strong>.<br />
This is a very exciting accomplishment several years in the<br />
making. We believe the timing is advantageous because it occurs<br />
near the bottom of the business cycle. These two former rivals<br />
serve complementary markets (see page 4) and together have<br />
a solid and growing product support base to help offset future<br />
energy cycles. Integration is now underway to realize the value<br />
of the attractive synergies and cost savings available to us.<br />
Blair Goertzen leads as Chief Executive Officer of Enerflex,<br />
supported by three divisional Presidents: Jerry Fraelic, President,<br />
U.S.; Ivan Heidecker, President, Canada; and Bill Moore,<br />
President, International. Other executives and managers from<br />
the two predecessor organizations are part of the new<br />
management team.<br />
We paid $315.6 million in cash and issued 11.9 million<br />
<strong>Toromont</strong> shares to effect the purchase. Even after accounting<br />
for the acquisition, <strong>Toromont</strong> has a significant cash position,<br />
no borrowings on its $250 million operating lines and no change<br />
in its strong credit rating.<br />
lOOking FORwARd<br />
It is too early to say how much of a recovery, if any, our business<br />
and the economy in general will see in 2010. Within our Equipment<br />
Group, we expect certain sectors such as road building, mining<br />
and power systems will improve. We expect that 2010 will be<br />
a year of transition for our natural gas-related business as we<br />
focus on integrating the combined operations of Enerflex <strong>Ltd</strong>.<br />
In our refrigeration business, we expect that the recreational<br />
side will continue to show strength while industrial will remain<br />
challenged.<br />
My thanks to our customers and business partners, as<br />
well as all members of the <strong>Toromont</strong> community – shareholders,<br />
employees and Directors – for your support in what has been<br />
a time of sacrifice and uncertainty but also dramatic and<br />
meaningful progress.<br />
Yours sincerely,<br />
Signed<br />
Robert M. Ogilvie<br />
Chairman of the Board<br />
and Chief Executive Officer
1<br />
4 | TOROMONT <strong>2009</strong> ANNUAL REPORT<br />
The future of<br />
Enerflex<br />
begins now<br />
what’s in a name?<br />
if the name is Enerflex,<br />
the answer is over 3,000<br />
employees, pro forma<br />
<strong>2009</strong> annual revenues<br />
of $1.5 billion, a 30-year<br />
track record in serving<br />
the needs of customers<br />
in 35 countries – and an<br />
exciting future.<br />
Calgary, Alberta, Canada<br />
1<br />
Calgary, Alberta, Canada<br />
2<br />
1<br />
3<br />
2<br />
4<br />
Nisku, Alberta, Canada<br />
3<br />
Casper, Wyoming, U.S.
4<br />
5<br />
Houston, Texas, U.S.<br />
5<br />
AUSTRAliA<br />
Dry Creek<br />
Eagle Farm<br />
Kewdale<br />
Northbridge<br />
Roma<br />
Seven Hills<br />
South Guildford<br />
Rijsenhout, Netherlands<br />
cAnAdA<br />
Athabasca, Alberta<br />
Barrhead, Alberta<br />
Bonnyville, Alberta<br />
Calgary, Alberta<br />
Drayton Valley, Alberta<br />
Drumheller, Alberta<br />
Edson, Alberta<br />
Edmonton, Alberta<br />
Fort Nelson, British Columbia<br />
Fort St. John, British Columbia<br />
Grande Prairie, Alberta<br />
Hinton, Alberta<br />
Kindersley, Saskatchewan<br />
Lethbridge, Alberta<br />
Lloydminster, Saskatchewan<br />
London, Ontario<br />
6<br />
Manning, Alberta<br />
Medicine Hat, Alberta<br />
Red Deer, Alberta<br />
Seven Hills, North West Territories<br />
Slave Lake, Alberta<br />
Stettler, Alberta<br />
Swift Current, Saskatchewan<br />
Westlock, Alberta<br />
cOlUmBiA<br />
Bogota<br />
gERmAny<br />
Spelle<br />
indOnESiA<br />
Jakarta<br />
Java<br />
mAlAySiA<br />
Kuala Lumpur<br />
nEThERlAndS<br />
Rijsenhout<br />
OmAn<br />
Muscat<br />
pAkiSTAn<br />
Lahore<br />
Perth, Australia<br />
6<br />
TOROMONT <strong>2009</strong> ANNUAL REPORT | 5<br />
UniTEd ARAB EmiRATES<br />
Abu Dhabi<br />
UniTEd kingdOm<br />
Caterham<br />
Inverurie<br />
Surrey<br />
UniTEd STATES<br />
Cypress, Texas<br />
Denver, Colorado<br />
Longview, Texas<br />
Mars, Pennsylvania<br />
Rifle, Colorada<br />
Soldotna, Alaska<br />
Washington, Pennsylvania<br />
Wheeler, Texas<br />
Vernal, Utah<br />
Enerflex<br />
worldwide<br />
Sales/Service Locations<br />
7<br />
7<br />
Brisbane, Australia
6 | TOROMONT <strong>2009</strong> ANNUAL REPORT<br />
Enerflex <strong>Ltd</strong>. is the new name for<br />
our natural gas and process<br />
compression business formed<br />
from the combination of Enerflex Systems<br />
Income Fund, acquired January 20, 2010<br />
and <strong>Toromont</strong> Energy Systems.<br />
As one company, Enerflex provides<br />
what we believe are the scope, scale and<br />
expertise necessary to address market<br />
challenges and deliver value to our<br />
customers and shareholders over the long<br />
term. On that basis, we are proud to<br />
present the Enerflex company profile.<br />
lEAding ApplicATiOnS<br />
From the well-head to the pipeline,<br />
Enerflex is a market leader in engineering,<br />
manufacturing and servicing highly<br />
specified equipment for a diversified<br />
mix of customers, including many of the<br />
largest energy exploration and production,<br />
chemical and petrochemical companies<br />
in the world. Enerflex also has expertise<br />
in providing gas compression and<br />
processing facilities to our customers on<br />
a turn-key basis and through alternative<br />
delivery models such as ‘build-ownoperate-maintain’<br />
contracts like a recent<br />
project in Oman.<br />
Our corporate roots stretch back 30<br />
years and over this time, we have<br />
amassed knowledge from manufacturing<br />
several million horsepower for upstream,<br />
midstream and downstream applications.<br />
Midstream markets represent about<br />
75% of our pro-forma revenues. Once a<br />
well is drilled and completed and the<br />
upstream portion of a project is finished,<br />
Enerflex provides compression packages<br />
to increase well-head pressure and for<br />
gas gathering, pipeline and storage<br />
facilities for both conventional and<br />
An Enerflex Combined Heat and Power Unit (CHP) produces energy using alternative<br />
fuel in Rijsenhout, Netherlands.<br />
unconventional resource plays around<br />
the world.<br />
In this market segment, we also provide<br />
producers with industrial refrigeration<br />
packages, amine plants (where CO 2 and<br />
hydrogen sulfide are removed from natural<br />
gas), dew point plants and cryogenic plants.<br />
Our downstream markets include<br />
power generation, petrochemical, natural<br />
gas distribution and storage facilities.<br />
lEAding SERvicE<br />
In all customer segments, our customers<br />
rely on us not just for equipment designed<br />
to maximize production and compressor<br />
throughput, but for ongoing customer<br />
support. On a pro forma basis, product<br />
support represents some 25% of our <strong>2009</strong><br />
pro forma revenue.<br />
Contributions from our preventative<br />
maintenance, parts and service business<br />
are important for our future because they<br />
help to offset energy cycles that affect<br />
customer spending on new equipment.<br />
Of equal importance, customer service<br />
creates customer satisfaction and the<br />
potential for new equipment sales.<br />
Today, we have over 400 service<br />
technicians across 28 locations and in<br />
six countries, along with over 300<br />
field-service trucks – an infrastructure<br />
that makes Enerflex a reliable 24/7<br />
supplier to customers around the world.<br />
lEAding mARkETS<br />
Another key strength for our future is<br />
geographic diversification. We operate in<br />
four major regions. Our largest market,<br />
Enerflex provided equipment for the phase two expansion of this<br />
natural gas compression station in Injune, Queensland, Australia.
epresenting 86% of pro forma <strong>2009</strong><br />
revenue, is the Americas where we work<br />
from Alaska to the Gulf of Mexico and<br />
beyond. This includes Canada, where we<br />
have a well-established presence in the<br />
Western Canadian Sedimentary Basin, the<br />
United States, where our packages are<br />
employed in major gas plays in Wyoming,<br />
Texas, Arkansas and Colorado as well as<br />
pipelines and storage facilities connecting<br />
east to west and north to south, Latin<br />
America and the Caribbean.<br />
Australasia is our second largest<br />
market, accounting for 11% of pro forma<br />
<strong>2009</strong> revenue. Across this vast territory,<br />
which encompasses nine countries, we<br />
have completed more than 130 projects,<br />
delivering turn key natural gas processing<br />
facilities and gas compression stations<br />
together with the infrastructure to move<br />
gas from where it is produced to where it<br />
is needed. Australia has announced plans<br />
to significantly expand its existing<br />
capacity over the next five years in<br />
Queensland, which adds to existing<br />
prospects on the northwestern shelf of<br />
that continent. Major producers in this<br />
region have been expanding coal seam<br />
gas production in Queensland for<br />
domestic use in power generation and as<br />
feedstock for LNG facilities for export.<br />
This will create a strong growth opportunity<br />
for Enerflex because coal seam gas<br />
requires both compression and processing<br />
equipment before it reaches the LNG facility.<br />
Enerflex has a strong service<br />
business in Europe and has provided gas<br />
compression equipment into that region<br />
for 20 years. In <strong>2009</strong> alone, 50,000<br />
horsepower of compression was packaged<br />
for that market, with Russia leading<br />
the way. We are also involved in Europe’s<br />
Combined Heat and Power (CHP)<br />
generation market. Our products<br />
encompass institutional and industrial<br />
applications using alternative fuels such<br />
as biogas, landfill gas and vapour gas.<br />
We expect this market to continue to<br />
expand as environmentally friendly fuel<br />
sources receive strong government<br />
support in Europe.<br />
In the Middle East/North Africa, our<br />
customers are located in Oman, Kuwait,<br />
Egypt, Pakistan, the United Arab Emirates<br />
and a number of other oil and gas-producing<br />
countries. We have completed numerous<br />
turn-key projects in this region over the<br />
years, most notably the El Wastani project<br />
(an LPG facility in Egypt) and the MOL<br />
project, a gas processing facility in<br />
Pakistan. Recently, Enerflex was awarded<br />
a contract to build-own-operate-maintain<br />
an offshore gas compression facility in the<br />
Sultanate of Oman. Demand for our<br />
products in this region will be driven by<br />
domestic demand for gas used for power<br />
generation and desalination plants, as<br />
well as an expanding LNG infrastructure<br />
in the region.<br />
lEAding pEOplE,<br />
FAciliTiES, EqUipmEnT<br />
Enerflex operates fabrication and<br />
manufacturing facilities in Calgary and<br />
Nisku, Alberta, Houston, Texas, Casper,<br />
Wyoming, Rijsenhout, Netherlands and<br />
Brisbane, Australia.<br />
In total, we have more than one million<br />
sq.ft. of production space available to<br />
produce highly engineered packages<br />
using a variety of reciprocating and<br />
rotary screw compression engines and<br />
components from a broad number of<br />
leading original equipment manufacturers.<br />
TOROMONT <strong>2009</strong> ANNUAL REPORT | 7<br />
Our modern facilities, including our<br />
sales and service operations, are staffed<br />
by experienced and highly skilled<br />
people. A common goal for our team<br />
across our operations is to efficiently<br />
deliver reliable solutions that maximize<br />
customer return on investment.<br />
Like all <strong>Toromont</strong> employees,<br />
the Enerflex team is empowered to<br />
run their business. We look forward to<br />
what this empowerment will mean as<br />
we begin to realize the benefits of the<br />
size, scope and synergies resident in<br />
this exciting combination. TIH<br />
An Enerflex service technician inspects<br />
a compression system in Calgary.<br />
Product support represents 25% of<br />
Enerflex’s <strong>2009</strong> pro forma revenue.<br />
This natural gas compression facility in Charleville, Queensland, Australia<br />
is one of a growing number of Enerflex installations on the continent.
8 | TOROMONT <strong>2009</strong> ANNUAL REPORT<br />
A southwestern<br />
success story<br />
just beyond little Rock, Arkansas is an unassuming stretch of rural<br />
land that is quickly becoming an important part of the energy production<br />
landscape in the United States thanks to the pioneering efforts of one<br />
integrated company.<br />
A typical compression station in Southwestern Energy’s Fayetteville Shale play.
The land in question encompasses<br />
the Fayetteville Shale play and the<br />
company is Southwestern Energy, the<br />
first to successfully produce unconventional<br />
natural gas from this large reservoir located<br />
on the Arkansas side of the Arkoma Basin.<br />
Today, Southwestern is the largest gas<br />
producer in the Fayetteville Shale.<br />
Over the past two years, <strong>Toromont</strong><br />
Energy Systems Inc. (TESI) has played<br />
an active role in this success story by<br />
providing dozens of highly specified<br />
natural gas compression packages<br />
used by Southwestern’s natural gas<br />
gathering subsidiary.<br />
The history of this relationship began<br />
with a cold call. Impressed with<br />
Southwestern’s progress in Arkansas,<br />
Mark Phillips, Account Manager at TESI’s<br />
Houston operations saw opportunity and<br />
in March of 2008, an introductory call was<br />
made to the customer. The timing was<br />
good. Southwestern was in the market for<br />
compression systems and not long after<br />
the initial call and exploratory meetings,<br />
TESI was given a request for proposal.<br />
Not content to go on the information<br />
found in the request alone, TESI made a<br />
field trip to Fayetteville to better<br />
understand the customer’s requirements.<br />
Southwestern also visited TESI’s<br />
operations to assess everything from the<br />
“quality of our facility and equipment to<br />
the quality of our people,” said Marc<br />
Rossiter, Sales Manager TESI. “This was<br />
an extensive assessment, conducted in a<br />
very disciplined manner by a company<br />
that knows what it’s doing.”<br />
Although TESI faced strong<br />
competition, it was awarded a contract to<br />
build a significant portion of Southwestern’s<br />
business based on a host of considerations<br />
that included TESI’s ability to meet three<br />
unique requirements: low noise, low<br />
emissions and stability.<br />
Since many of Southwestern’s natural<br />
gas gathering stations on the Fayetteville<br />
Shale operate close to other land owners,<br />
they insisted on procuring low noise<br />
compression packages. Reducing<br />
emissions was also important due to<br />
environmental policies. In addition, to<br />
enable Southwestern to nimbly respond<br />
to the changing output of its wells over<br />
time, they wanted the compression<br />
packages to be able to sit on a temporary<br />
foundation of compacted gravel and to<br />
operate in this state without loss of<br />
performance or structural integrity.<br />
Typically, compression packages of this<br />
size are bolted to an engineered concrete<br />
foundation for stability.<br />
To meet the first requirement, TESI<br />
designed its packages with low noise fans.<br />
The second spec was met with the<br />
addition of special oxidization catalysts<br />
(which work like an automobile’s catalytic<br />
converter). These were designed as part of<br />
a base-mounted silencer system. This<br />
system is housed outside the gathering<br />
station to make it easy for Southwestern’s<br />
operators to change the catalysts. The<br />
third need was met through a redesign of<br />
the compression skid to make it even<br />
heavier and more stable. The end product<br />
was both sizeable and powerful, featuring<br />
1,775 horsepower CAT ® 3606 gas engines<br />
running Ariel JGD/4 compressors. Each<br />
unit is capable of compressing about<br />
seven million standard cubic feet of<br />
gas per day.<br />
With the design complete, each<br />
package was then made to identical<br />
specifications at TESI’s Houston<br />
fabrication operation. Identical design<br />
not only improved TESI’s manufacturing<br />
efficiency, it improved the efficiency and<br />
speed of maintenance performed by<br />
Southwestern’s operators on site. Once<br />
built, the skids were delivered to the<br />
Fayetteville Shale where TESI’s service<br />
division assembled and commissioned<br />
each package.<br />
“This project was a TESI team effort<br />
all the way,” said Jerry Fraelic, President,<br />
U.S. Operations TESI. “It shows what can<br />
be accomplished with ingenuity, attention<br />
to detail, hard work and a very<br />
knowledgeable customer.”<br />
While compression rental is prevalent<br />
in the U.S. market, Southwestern chose<br />
to own these packages due to its integrated<br />
business model of engaging in oil and<br />
“ Our relationship with Southwestern<br />
Energy began with a phone call and was<br />
solidified when we demonstrated we<br />
could meet three unique requirements.”<br />
Marc Rossiter, Sales Manager<br />
<strong>Toromont</strong> Energy Systems Inc., Houston<br />
TOROMONT <strong>2009</strong> ANNUAL REPORT | 9<br />
gas exploration and production, natural<br />
gas gathering and marketing – as well<br />
as a financial assessment of rental<br />
versus ownership.<br />
TESI’s contribution to Southwestern’s<br />
infrastructure has been focused on gas<br />
gathering and the compression technology<br />
that underpins it – a critical part of the<br />
process. Compression comes into play<br />
after the fluids from the well (water,<br />
hydrocarbons, etc.) have been separated.<br />
“The equipment <strong>Toromont</strong> is<br />
providing to Southwestern Energy is<br />
critical in their overall business of<br />
marketing clean-burning natural gas to<br />
consumers throughout North America,”<br />
says Mr. Rossiter. “Using our compression<br />
systems, we pressurize the natural gas to<br />
1,000 psi – which is the standard for most<br />
pipelines. Anything less means the gas<br />
doesn’t move from the gathering station<br />
into the pipeline and that means no sale.”<br />
Southwestern expects to produce<br />
and move natural gas from the Fayetteville<br />
Shale formation to waiting markets for<br />
years to come. TESI’s specified packages<br />
are built for this exciting journey. TIH
10 | TOROMONT <strong>2009</strong> ANNUAL REPORT<br />
waste not,<br />
want not<br />
TOROmOnT hElpS mUnicipAliTy<br />
REAliZE vAlUE FROm lAndFill gAS<br />
The gas utilization plant at the Glanbrook facility consists of two Caterpillar G3520 generator<br />
sets housed in custom-designed enclosures supplied by <strong>Toromont</strong> CAT Power Systems.
like many landfills in North America,<br />
Glanbrook serves as an important<br />
repository for municipal solid waste<br />
that cannot be diverted or composted.<br />
Operational since 1980 and with an<br />
expected operating life of another 20-plus<br />
years, it sits on a 539-acre site between<br />
the Welland River and Buckhorn Creek.<br />
In late 2003, forward-thinking<br />
members of City council and staff<br />
commissioned a study to determine the<br />
feasibility of landfill gas recovery at the<br />
site. The study, conducted by CRA<br />
Consultants, concluded that the site could<br />
support a landfill gas-to-energy (LGE)<br />
plant because it produced more than 500<br />
cubic feet per minute of gas – a threshold<br />
that was necessary to make the plant<br />
economically viable. Under the Ontario<br />
Power Authority’s (OPA) Renewable<br />
Energy Standard Offer Program, the City<br />
was also assured of getting favourable<br />
rates for the electricity generated.<br />
Following receipt of the study, the<br />
City formed Hamilton Renewable Power Inc.<br />
to finance the project and collect revenue<br />
from the energy generated from waste.<br />
The City also decided that construction<br />
and operation of the site would best be<br />
handled on a turn-key basis and in<br />
TOROMONT <strong>2009</strong> ANNUAL REPORT | 11<br />
Each minute, the city of hamilton’s glanbrook<br />
landfill produces about 1,100 cubic feet of<br />
methane gas mixed with carbon dioxide.<br />
Rather than flaring this dangerous mix into<br />
the atmosphere, hamilton has turned this<br />
problem into a source of electrical energy<br />
and $2.8 million in annual revenue with help<br />
from <strong>Toromont</strong> cAT power Systems.<br />
“ The city of hamilton set ambitious objectives for<br />
the glanbrook landfill. we were eager to accept<br />
the challenge and to leverage our experience in<br />
similar landfill gas-to-energy projects.”<br />
Joe VanSchaick, <strong>Toromont</strong> CAT Power Systems<br />
EPG Market Manager, Concord, Ontario<br />
November 2006, hired <strong>Toromont</strong> to provide<br />
a complete solution, including commissioning<br />
and ongoing operation.<br />
This was not <strong>Toromont</strong>’s first LGE<br />
plant: the Company gained significant<br />
experience in building and operating<br />
successful landfill gas-to-energy projects<br />
in Sarnia, Waterloo and Toronto over the<br />
past decade. Glanbrook, though, had its<br />
own unique requirements.<br />
Continued on next page.
12 | TOROMONT <strong>2009</strong> ANNUAL REPORT<br />
“The City of Hamilton set out to<br />
achieve several objectives with the<br />
Glanbrook site beyond the elimination of<br />
harmful gases and revenue generation,”<br />
said Joe VanSchaick, EPG Market Manager,<br />
<strong>Toromont</strong> CAT Power Systems who<br />
developed <strong>Toromont</strong>’s Glanbrook proposal.<br />
“Because the site is located in an urban<br />
area, they wanted to reduce odours and<br />
odour complaints, leachate mounding and<br />
noise emissions. This is also an operating<br />
landfill, so there would be zero tolerance for<br />
any waste disposal disruption during plant<br />
construction. It was an ambitious effort<br />
and one we were eager to undertake.”<br />
To address the City’s objectives,<br />
<strong>Toromont</strong> engineers added a dedicated<br />
blower to provide extra combustion<br />
capacity for odour control. The gas<br />
collection system was designed to include<br />
28 horizontal gas collection trenches placed<br />
in areas with higher leachate levels, which<br />
improved collection efficiency. This was in<br />
addition to gas wells drilled into the top of<br />
the landfill. A number of adjustments were<br />
also made to the generators and radiator<br />
system to reduce noise. Powerful monitoring<br />
and control systems were also added,<br />
allowing the operator to remotely perform<br />
diagnostic tests and calibrations.<br />
Following design, construction began<br />
in 2007. Phase one included installation of<br />
horizontal collection trenches, transmission<br />
header piping, condensate traps and<br />
extraction wells. During this phase,<br />
<strong>Toromont</strong> CAT equipment was used for<br />
earthmoving and Battlefield – The CAT<br />
Rental Store provided a variety of small<br />
tools and lifts.<br />
Phase two involved site preparation<br />
and construction of the power plant and<br />
its various units in an obscure area of the<br />
The Caterpillar G3520 efficiently burns the methane produced from the<br />
landfill to provide a clean, green, reliable source of renewable energy.<br />
landfill, chosen so that it would integrate<br />
with a nearby forest. The plant includes a<br />
motor control centre and a blower<br />
building, which houses a collection<br />
system. Inside the blower building, gas<br />
sucked from the wells is conditioned,<br />
chilled and condensed before it is<br />
combusted by two low-emission Caterpillar<br />
1.6MW G3520C generators packaged<br />
by <strong>Toromont</strong> specifically for Glanbrook.<br />
These systems cope with impure gas,<br />
which shortens both spark plug and oil life<br />
and causes regular build ups of siloxanes<br />
in the combustion chamber. Siloxane is a<br />
chemical compound that when oxidized,<br />
forms abrasive deposits on pistons and<br />
cylinder heads and damages internal<br />
engine components.<br />
In all, it was a complex installation<br />
completed while the landfill remained fully<br />
operational. The plant was commissioned<br />
by <strong>Toromont</strong> in November of 2008 after<br />
Ontario Power Generation installed five miles<br />
of electrical line to connect the plant to the<br />
grid and Glanbrook received operating<br />
permits from the Ministry of the Environment.<br />
Bill Batty, a long-time <strong>Toromont</strong><br />
employee, led the commissioning process<br />
– and now serves as plant supervisor. “My<br />
job is to keep the plant operating 24/7,<br />
because any downtime means the loss of<br />
revenue for the City and the need to flare<br />
the gas rather than capture and harness<br />
it,” said Mr. Batty. “I also maintain and<br />
balance production from the 45 gas wells<br />
on site. Using gas monitoring equipment, I<br />
switch production from one well to another<br />
and that way get a higher average<br />
methane content in the gas we’re burning.<br />
If a well is overtaxed, the blowers start to<br />
draw oxygen rather than methane. So far,<br />
Glanbrook has been running its engines at<br />
“ landfills produce greenhouse<br />
gas 24/7. with the <strong>Toromont</strong><br />
engineered, cAT powered plant,<br />
we are able to maintain production<br />
volumes on a continuous basis.”<br />
Bill Batty,<br />
Plant Supervisor, Glanbrook Landfill, Hamilton<br />
about 55 to 57% methane – which is much<br />
better than average for a landfill.”<br />
Mr. Batty uses an Internet-enabled<br />
Scada system to remotely monitor the plant<br />
on weekends and evenings from his laptop<br />
and makes a variety of adjustments to<br />
ensure peak operation. <strong>Toromont</strong>’s St.<br />
Catharines branch provides ongoing<br />
maintenance to the plant.<br />
While the market for LGE plants is<br />
decidedly niche, more than 50 landfills in<br />
<strong>Toromont</strong> CAT’s territories meet the gas<br />
production threshold that would make them<br />
viable energy producers.<br />
Today, more than a year after completion,<br />
Glanbrook is meeting its objectives.<br />
The operation generates net electricity<br />
output of 26 million kilowatts-hours per<br />
year, enough to power 2,100 homes. Based<br />
on a 20-year agreement with OPA, Hamilton<br />
Renewable Power receives 11 cents per<br />
kilowatt hour plus 3.52 cents per kilowatt<br />
hour for on-peak power production from the<br />
landfill. Considering project costs offset by<br />
the revenue stream, payback will be<br />
achieved by the end of 2012.<br />
Most important, this installation<br />
eliminates 100,000 tonnes a year of carbon<br />
dioxide that would otherwise be released<br />
into the atmosphere. That’s the equivalent<br />
of planting 9,200 hectares of trees. TIH
A CAT 2900 LHD at work in underground mining.<br />
Forging a precious<br />
relationship<br />
TOROmOnT STAkES iTS clAim wiTh<br />
SEniOR gOld pROdUcER<br />
Building a mine takes years of exploration and development, along with<br />
hundreds of millions of dollars of capital. it’s a high stakes, high reward<br />
business that requires careful planning, extensive knowledge and effective<br />
execution, often in some of the harshest environments on earth.<br />
in the gold mining industry, Goldcorp Inc. has consistently<br />
found success despite these challenges. Today, it is widely<br />
recognized as a low-cost and fast-growing senior gold<br />
producer. In Canada, Goldcorp operates Red Lake, Musselwhite<br />
and Porcupine gold mines, all based in Ontario.<br />
<strong>Toromont</strong> people and equipment play a variety of important<br />
supporting roles at each of these mines. In so doing, we have<br />
forged a 15-year relationship with Goldcorp that transcends<br />
mining techniques, distance and commodity cycles.<br />
These mines employ dozens of sophisticated Caterpillar<br />
production machines – the equipment that tears blasted rock<br />
from the earth and heaves it hour after hour to processing mills to<br />
be refined. Each piece of equipment is chosen to meet the<br />
specific requirements of its destination.<br />
Production at Musselwhite is high volume, meaning a<br />
substantial amount of rock must be extracted on a daily basis to<br />
produce each ounce of gold. For this site 480 kilometres north of<br />
Thunder Bay, the <strong>Toromont</strong> fleet of machines is comprised of large<br />
and medium-sized equipment designed to move large, heavy<br />
loads. It includes CAT AD45B underground trucks, CAT R2900G<br />
underground Load Haul Dump (LHD), CAT R1700G LHDs, R1300G<br />
LHDs and a CAT M135H custom motor grader.<br />
Conversely, Red Lake Gold Mines is one of the world’s<br />
highest-grade gold mines with comparatively less rock moved<br />
per day to meet gold production requirements. Although Red<br />
Lake is the largest gold mine in Canada from the standpoint of<br />
gold production, its rich mineral deposits require smaller<br />
machines than Musselwhite such as CAT R1300G LHDs, R1600G<br />
LHDs and CAT AD30 underground trucks.<br />
TOROMONT <strong>2009</strong> ANNUAL REPORT | 13<br />
“Goldcorp measures its production costs right down to the<br />
ounce,” said Jeff McKnight, Branch Manager, <strong>Toromont</strong> CAT<br />
Thunder Bay. “So it’s no surprise that they are experts in selecting<br />
the right production equipment for each mine. While Red Lake’s<br />
narrow vein, high-grade ore body dictates the use of smaller<br />
equipment, Musselwhite specifies bigger equipment which is<br />
capable of extracting larger volumes on a very efficient basis.<br />
With CAT’s product range, we are able to meet the needs of all of<br />
Goldcorp’s properties in our territories.”<br />
At the Porcupine sites near Timmins, Ontario – North<br />
America’s longest continuously operating gold mine – <strong>Toromont</strong><br />
CAT equipment has operated since 1994. Back then, Caterpillar<br />
had only recently awarded <strong>Toromont</strong> the Ontario dealership<br />
territory when the Dome surface mine announced it was in the<br />
market for mining equipment. <strong>Toromont</strong> beat out the competition<br />
for this important order, setting in motion a long-term relationship.<br />
As time went on, Dome surface machines moved to the nearby<br />
Pamour Open Pit and continued to perform at a high rate until<br />
last year when the Pit scaled back and began to focus on<br />
transporting roughly six years’ worth of stockpiled materials to<br />
the Goldcorp Dome mill for processing. Meanwhile, <strong>Toromont</strong>’s<br />
relationship with Porcupine continues uninterrupted at<br />
Porcupine’s Hoyle Pond site 20 kilometres east of Timmins. Here,<br />
a sizeable and growing fleet of Caterpillar equipment contributes<br />
to the mine’s strong future.<br />
Goldcorp’s machines are both rugged and technologically<br />
advanced. Rugged because they run 24/7 in unforgiving<br />
conditions and technologically advanced to provide operator<br />
safety and highly efficient operation. Most of the LHD machines<br />
Continued on next page.
14 | TOROMONT <strong>2009</strong> ANNUAL REPORT<br />
at Musselwhite mine are equipped with<br />
remote control interfaces allowing safe<br />
operation from a distance, away from<br />
danger zones. To increase durability,<br />
<strong>Toromont</strong> designs special guarding<br />
packages to protect the machines from<br />
collisions with rock walls, which can lead<br />
to lost production time and machine<br />
damage – a costly combination.<br />
<strong>Toromont</strong> is one of the only mining<br />
equipment suppliers capable of machine<br />
customization to meet a site’s specific<br />
requirements. Over the past five years,<br />
specialized braking and emissions systems<br />
have been added and adjustments made to<br />
operator workspaces on dozens of mining<br />
machines at <strong>Toromont</strong> CAT before delivery.<br />
pOwERing liFElinES<br />
Production equipment is only part of<br />
<strong>Toromont</strong>’s contribution. Equally important<br />
is the provision of power systems. Just<br />
ask a miner who depends on electricity<br />
for fresh air and light 2,000 metres below<br />
the surface.<br />
In <strong>2009</strong>, <strong>Toromont</strong> CAT Power<br />
Systems added to its existing fleet at<br />
Musselwhite by commissioning two 3500<br />
Series CAT power generation systems to<br />
provide primary power for shaft<br />
ventilation. These large, 50 by 10 foot<br />
packages are now providing 2 megawatts<br />
and 1.7 megawatts of power respectively<br />
on a primary basis for the next two years<br />
until the shaft is connected to the hydro<br />
grid – and thereafter for back-up power.<br />
“We designed and built these<br />
systems to be ready to produce power the<br />
minute they were dropped on site and we<br />
did it in five weeks,” said Chris Moskal,<br />
Manager of <strong>Toromont</strong> CAT Power<br />
Systems, Western Region. “It normally<br />
takes 18 to 20 weeks to do what we did in<br />
five, but when it’s critical to a customer’s<br />
production, we make it happen.”<br />
Red Lake is fully connected to the<br />
hydro grid, but even there, Goldcorp uses<br />
two CAT standby generator sets.<br />
pEOplE mAkE ThE diFFEREncE<br />
Whether the equipment is used for production<br />
or power generation, it must be maintained<br />
to deliver flawlessly. Service is the third<br />
element of <strong>Toromont</strong>’s relationship with<br />
Goldcorp’s Ontario mines.<br />
Due to the high volume nature of<br />
production at Musselwhite, customer<br />
support is delivered by a team of<br />
specialized <strong>Toromont</strong> technicians who<br />
keep the machines operating 24 hours a<br />
day, 365 days a year.<br />
In recognition of the size of the fleet<br />
and its high level of utilization, <strong>Toromont</strong> CAT<br />
created the position of Project Manager<br />
for the Musselwhite operation. It is performed<br />
by Bob Robertson, a 15-year <strong>Toromont</strong><br />
veteran who coordinates <strong>Toromont</strong> service<br />
technicians and site supervisors onsite.<br />
“Our job is to deliver uptime – to<br />
make sure that the customer’s machines<br />
are available for production exactly when<br />
they are needed,” said Mr. Robertson.<br />
“That takes a high level of coordination<br />
given the continuous nature of<br />
Musselwhite’s production. Schedules are<br />
important and we match our work with the<br />
activity of the mine and the usage of each<br />
machine. It’s like a chess match.”<br />
Machine hours are monitored and<br />
preventative maintenance is delivered at<br />
250, 500 and 1,000 hours to exacting<br />
Caterpillar standards. To eliminate<br />
downtime, <strong>Toromont</strong>’s technicians perform<br />
preventative maintenance during mine<br />
shift changes – meaning they are flat out<br />
busy at 6am and again at 6pm. In between<br />
times, they troubleshoot, manage parts<br />
inventories and undertake more elaborate<br />
maintenance on both the underground<br />
fleet and the CAT surface vehicles that are<br />
involved in exploration, snow removal,<br />
material handling and site maintenance.<br />
Mr. Robertson’s job also includes fleet<br />
analysis, an important task enabled by the<br />
advanced nature of the technology<br />
onboard each machine. “Through<br />
diagnostic downloads three times each<br />
month from our on-site technicians, we<br />
calculate the volume of rock the machine<br />
has moved, hours of usage, idle time,<br />
consumable consumption and harness<br />
this intelligence to advise the customer on<br />
whether it’s time to do an overhaul or buy<br />
new. These calculations help Goldcorp<br />
reduce their cost of ownership and cost of<br />
production.”<br />
While the needs of each of Goldcorp’s<br />
mines in Ontario are unique, as Mr. Robertson<br />
sees it, the common bond is “consistency<br />
of delivery. Whether we’re providing<br />
equipment, service or parts, our job is to<br />
deliver to the highest standard of performance<br />
every time. It’s what Goldcorp expects and<br />
it’s what we expect of ourselves.” TIH<br />
Goldcorp’s Musselwhite mine<br />
uses Caterpillar equipment<br />
including the CAT AD45B<br />
underground articulated truck.
A Caterpillar AP1055D track<br />
asphalt paver on the job.<br />
whEn ThE gOing gETS<br />
TOUgh, ThERE iS<br />
TOROmOnT SERvicE<br />
Road building is tough. In some areas of Canada as<br />
winter sets in, it’s close to impossible.<br />
Facing the end of the paving season in central<br />
Newfoundland and a construction deadline, Bill Farrell of Farrell’s<br />
Excavating <strong>Ltd</strong>. was getting set for a final push to complete a job<br />
he started on the Trans Canada Highway in July.<br />
The weather was uncooperative and with just four days to<br />
go before his deadline, the final drive motor on his AP1055D track<br />
asphalt paver failed. At 4 pm on Saturday, October 24, <strong>2009</strong>, Jonas<br />
Gaulton, Service Supervisor of <strong>Toromont</strong> CAT St. John’s branch<br />
received the call. A normally self-sufficient Bill Farrell needed a<br />
new Final Drive Assembly so paving could resume on Monday<br />
at 7 am sharp.<br />
Being late in the season, a new motor was not in inventory<br />
at the branch – or anywhere else in Newfoundland and Labrador.<br />
After alerting a local team comprised of Wayne Waterman,<br />
<strong>Toromont</strong> CAT Vice President Newfoundland and Labrador, Peter<br />
Warren, Machine Sales Representative (MSR) and Carl Hamlyn<br />
Product Support Manager, Jonas sought help from Mark Medeiros<br />
Paving Sales Specialist and Scott Symon Technical Communicator<br />
at <strong>Toromont</strong>’s Concord, Ontario branch. Scott located a new<br />
AP1055D paver in Windsor – but not a spare final drive motor.<br />
Not to be deterred, the Windsor branch joined the team early<br />
Saturday evening. Tom Scott, the on-call MSR in Windsor<br />
contacted technicians Troy White and Mike Renaud, along with<br />
Jason Martin, the Parts Counterman and the plan took shape.<br />
Troy, Mike and Jason would remove the drive assembly and<br />
Jason would transport it to Toronto’s Pearson Airport where it<br />
TOROMONT <strong>2009</strong> ANNUAL REPORT | 15<br />
would leave on a commercial flight to St. John’s in the early hours<br />
of Sunday morning. Five hours after they started, the final drive<br />
was expertly disassembled and on a truck to Toronto. Jason<br />
unloaded it and returned home, confident that the motor would<br />
arrive Sunday morning in Newfoundland.<br />
Then the unexpected: the motor did not arrive. Without<br />
notice, the commercial flight was cancelled. More quick thinking<br />
was needed. The team contacted a charter company. A plane based<br />
in New Brunswick would travel to Toronto, pick up the 400 pound<br />
motor and then head to St. John’s. Problem solved.<br />
At 4 pm Sunday, the motor arrived at the St. John’s branch<br />
where technicians James Bonia, Edward Farrell and Greg Simms<br />
were standing by with Farrell’s AP1055D paver to install the<br />
assembly. Five hours later, a good-as-new paver was readied for<br />
its trek back to the Trans Canada Highway.<br />
At 7 am Monday, October 26, paving resumed. On Thursday,<br />
motorists streamed down the 25 kilometre final stretch of the<br />
newly paved section of the Trans Canada Highway unaware of<br />
the gargantuan effort made by the team at Farrell’s and<br />
<strong>Toromont</strong> CAT to make it happen.<br />
“I’ve been a customer of <strong>Toromont</strong>’s for the past seven<br />
years and while I knew they offered good service – having<br />
purchased over 20 machines from them – I never knew they<br />
would go this far to help,” said Farrell’s founder, Bill. “The<br />
teamwork between the branches and their persistence made all<br />
the difference for me. In my view, <strong>Toromont</strong> CAT really gives new<br />
meaning to the term customer support.” TIH
16 | TOROMONT <strong>2009</strong> ANNUAL REPORT<br />
moving mountains<br />
part of day’s work<br />
at long harbour<br />
Site development began in <strong>2009</strong> on one of the most anticipated<br />
mining-related projects in canada, the vale inco’s long harbour<br />
hydromet processing plant outside St. john’s, newfoundland.<br />
Pennecon Limited relies on a variety of <strong>Toromont</strong> CAT<br />
equipment including the Caterpillar 740 articulated truck.
when completed in February 2013,<br />
this $2.8 billion plant will use a<br />
unique water-based process to<br />
extract nickel from concentrate, produced<br />
at the Voisey’s Bay Mine 1,200 kilometers<br />
northwest (in northern Labrador), and<br />
refine it to a finished nickel product.<br />
The Long Harbour project has<br />
attracted 1,000 workers and many local<br />
companies to the construction site. One<br />
of them is Pennecon Limited, a leading<br />
diversified construction company<br />
headquartered in Newfoundland and<br />
Labrador. Pennecon, through their Penny<br />
Heavy Civil Division, was awarded the<br />
Long Harbour earthworks contract in late<br />
May <strong>2009</strong>. As a long-time <strong>Toromont</strong><br />
customer, Pennecon responded to its<br />
contract win with an order for a fleet of<br />
Caterpillar equipment and a requirement<br />
to deliver the machines in only three weeks.<br />
Drawing on its resources in<br />
Newfoundland and Labrador, as well as<br />
its Concord, Ontario branch, <strong>Toromont</strong><br />
immediately set out first to secure the<br />
equipment fleet, which included CAT D8T<br />
bulldozers, 345D and 365C hydraulic<br />
excavators, 740 ADT off-road trucks, C65<br />
model rollers and a CAT 988H wheel loader.<br />
“Normally, when we factor in<br />
customization and PDI (pre-delivery<br />
inspection), an order of this size would<br />
take eight to ten weeks to deliver,” says<br />
Dave Fowler, Sales Office Manager at<br />
<strong>Toromont</strong> CAT St. John’s branch, who<br />
along with two local Machine Sales<br />
Representatives, Tom Hill and Peter<br />
Warren, worked to fill the bill. “Doing it all<br />
in three weeks was a tall order, requiring<br />
us to mobilize significant resources.”<br />
Locating the equipment was made<br />
easier by the dealership’s online<br />
inventory management system and once<br />
located, modifications were made to<br />
certain machines to meet the special<br />
requirements of the Long Harbour<br />
project: the removal of 1.3 million cubic<br />
meters of soil, rock and bog.<br />
“As part of site preparation, Penny<br />
Heavy Civil are literally removing/<br />
flattening the top of a mountain at Long<br />
Harbour, installing underground services<br />
including a storm-water management and<br />
diversion system, cables and piping, and<br />
constructing main and secondary access<br />
roads,” says Mr. Hill. “Their equipment<br />
must be able to perform these tasks on<br />
an efficient and cost-effective basis.”<br />
Through customer discussions aided<br />
by <strong>Toromont</strong> CAT’s Customer Service<br />
Group, with significant experience in fleet<br />
production and analysis, a number of<br />
units were equipped with machine control<br />
and guidance systems. These systems<br />
increase productivity by up to 40% by<br />
using cross slope, sonic, laser and GPS<br />
technology combined with automatic<br />
blade controls to allow machine<br />
operators to maintain consistent grades.<br />
With over one million cubic metres of<br />
earth to move at Long Harbour, these<br />
systems eliminate the considerable back<br />
and forth that would otherwise<br />
accompany site preparation.<br />
<strong>Toromont</strong> CAT’s Concord branch<br />
made a number of other modifications,<br />
notably shortening the stick, which is<br />
the arm that moves the bucket on an<br />
TOROMONT <strong>2009</strong> ANNUAL REPORT | 17<br />
“ we mobilized resources from<br />
several <strong>Toromont</strong> cAT branches<br />
to deliver the right machines at<br />
the right time for pennecon<br />
limited to use on one of the<br />
largest earthworks projects in<br />
this province’s history.”<br />
Peter Warren, <strong>Toromont</strong> CAT<br />
Machine Sales Representative, St. John’s<br />
excavator, and cutting the track shoes<br />
to suit the application and the types of<br />
material that had to be excavated.<br />
On June 15th, <strong>2009</strong>, Penny Heavy<br />
Civil put the new equipment to work,<br />
along with a number of other Caterpillar<br />
machines owned by the partners. Today,<br />
a substantial amount of blasting,<br />
excavation and earth moving has already<br />
taken place, and the one-kilometresquare<br />
location of the main process<br />
buildings is taking shape. The port area<br />
at Long Harbour, which is contiguous to<br />
the plant site, is being developed as it<br />
prepares to accept in-bound ships<br />
carrying concentrate and outbound ships<br />
carrying nickel. This remediation work is<br />
part of massive improvements being<br />
made by Vale Inco.<br />
This project represents a continuation<br />
of <strong>Toromont</strong>’s service to the Voisey’s Bay<br />
mine itself. Today Vale Inco Voisey’s Bay<br />
operates a fleet of Caterpillar equipment<br />
consisting primarily of CAT 777 off-highway<br />
trucks, CAT wheel loaders ranging from<br />
a 906 CCE to the large 992 mining wheel<br />
loader, hydraulic excavators from a 315<br />
to a 385 and D3 trim and D9 bulldozers.<br />
<strong>Toromont</strong> supports the mine through an<br />
on-site parts department staffed by highly<br />
qualified parts and service personnel. TIH<br />
A Caterpillar 345 hydraulic excavator with<br />
substantial lift capacity loads material into a<br />
CAT articulated truck.
18 | TOROMONT <strong>2009</strong> ANNUAL REPORT<br />
On ThE FROnT linES<br />
OF inFRASTRUcTURE<br />
Across Canada, “shovel-ready”<br />
infrastructure projects are now<br />
turning into roads, bridges, water<br />
mains, universities, hospitals and skating<br />
facilities, thanks to unprecedented public<br />
funding by all levels of government.<br />
According to the federal government’s<br />
update at the end of <strong>2009</strong>, under collective<br />
infrastructure programs cost-shared with<br />
provinces, territories and municipalities,<br />
$25.8 billion has been committed for<br />
infrastructure spending toward some<br />
6,700 projects. Much of this activity will<br />
take place before March 31, 2011, creating<br />
conditions for a groundswell of construction<br />
activity over the next 12 months.<br />
Cruickshank Construction, with<br />
operations in Kingston, Green Valley and<br />
Morrisburg, Ontario, is one of hundreds<br />
of companies on the front lines of<br />
delivering the benefits of infrastructure<br />
investing for Canadians.<br />
This long-time supplier of road and<br />
bridge construction and maintenance<br />
services to government and private<br />
developers, is preparing for a busy 2010.<br />
This activity will be a boon to Cruickshank,<br />
which owns aggregate quarries, ready-mix<br />
concrete and asphalt plants.<br />
To ensure its future readiness,<br />
Cruickshank took delivery of a fleet of 22<br />
heavy machines from <strong>Toromont</strong> in <strong>2009</strong>,<br />
including CAT 320 and 336 hydraulic<br />
excavators, four CAT models of asphalt<br />
rollers, a D6K bulldozer, IT 38 integrated<br />
tool carrier and CAT models 924, 966, 972<br />
and 980 wheel loaders.<br />
This equipment has been deployed<br />
across Cruickshank’s operations, including<br />
its aggregate quarries, where it is<br />
augmenting or replacing older CAT<br />
models. <strong>Toromont</strong> CAT will also maintain<br />
the equipment as part of a long-term<br />
customer support agreement. As such, the<br />
order represented a departure for<br />
Cruickshank owners, who have<br />
traditionally purchased used equipment<br />
and serviced it themselves.<br />
The change of approach was made<br />
after the customer assessed the total cost<br />
of ownership, taking into account not only<br />
initial capital costs, but the expenses and<br />
complexity associated with maintenance.<br />
“ cruickshank construction traditionally<br />
used pre-owned equipment but a<br />
thorough assessment showed better<br />
cost of ownership was possible with<br />
a new fleet from <strong>Toromont</strong>.”<br />
Paul Egan,<br />
Territory Manager, <strong>Toromont</strong> CAT, Ottawa<br />
“Cruickshank is a sophisticated buyer<br />
that is focused on return on employed<br />
capital,” said Matt De Witt, Vice President<br />
of <strong>Toromont</strong> CAT, Central Region. “Their<br />
own analysis determined that leasing new<br />
equipment packaged with a Customer<br />
Support Agreement (“CSA”) would not<br />
only reduce their initial capital outlay, it<br />
would lower their total cost of operation<br />
compared to buying and operating<br />
pre-owned machines.”<br />
In other words, while Cruickshank<br />
expects to be busy for the foreseeable<br />
future owing to public infrastructure<br />
spending and a recovering economy, their<br />
decision was not based on market<br />
demand alone but on equipment<br />
economics.<br />
CSAs fix the cost of maintenance<br />
over the life of the equipment, giving<br />
customers like Cruickshank budget<br />
certainty as well as something equally<br />
tangible: better equipment performance<br />
Inside a dome at one of Cruickshank’s<br />
yards, a <strong>Toromont</strong> CAT wheel loader<br />
stockpiles salt for winter.
from regularly scheduled service. In an<br />
aggregate quarry, where dirt and sand can<br />
wreak havoc with engines and<br />
components, regular maintenance is vital<br />
to productivity.<br />
To enable <strong>Toromont</strong> to deliver CSAs<br />
to Cruickshank and other customers on<br />
mutually agreeable financial terms,<br />
<strong>Toromont</strong> relies on predictive models of<br />
equipment failure and real world<br />
experience in servicing machines.<br />
“We determine the cost of<br />
maintenance down to the operating hour<br />
for our customer’s equipment and we do<br />
that in a systematic way,” said Steve<br />
Cassidy, Product Support Manager at<br />
<strong>Toromont</strong> CAT who along with Dave<br />
McClure, Ottawa Branch Manager and<br />
Paul Egan, Machine Sales Representative<br />
helped Cruickshank place its order.<br />
“Specifically, we conducted an<br />
applications survey to assess the work<br />
each machine will do. For example,<br />
Cruickshank wheel loaders that perform<br />
face work (where drilling and blasting<br />
occur) will require more maintenance than<br />
loaders engaged in stockpiling aggregate.<br />
The information gathered from this survey<br />
is fed into our CAT Builder software<br />
program, allowing us to calculate the<br />
exact cost of maintenance for each<br />
component and consumable on each<br />
machine based on hours of usage. No<br />
guessing is required.”<br />
Guesswork is also removed from the<br />
delivery of service with Product Link, an<br />
electronic system that allows <strong>Toromont</strong> to<br />
remotely monitor equipment performance,<br />
utilization and location.<br />
“Product Link gives us an edge<br />
because it allows us to intervene<br />
proactively with oil changes and other<br />
service protocols right at the aggregate<br />
quarry, before harm is done to critical parts<br />
and components,” says Mr. Cassidy. “This<br />
level of service is standard with CSAs and<br />
is part of reducing cost of ownership.”<br />
Financial considerations aside,<br />
Cruickshank chose <strong>Toromont</strong> because<br />
CAT equipment best fit their varied needs.<br />
As an integrated company, Cruickshank<br />
regularly shifts their machines to the work<br />
that needs to be performed. For example<br />
CAT wheel loaders will work in their quarries<br />
in the summer and in winter will move<br />
sand for road maintenance. Same for their<br />
excavators: they may be used to widen a<br />
road one day and at a quarry the next.<br />
While the work is varied, Cruickshank<br />
had very specific criteria for performance.<br />
The machines were chosen after<br />
considering cycle speeds (which<br />
determine cost per tonne), fuel efficiency,<br />
power requirements, accuracy of machine<br />
control and guidance systems and<br />
operator safety and visibility. CAT’s work<br />
tools, which are used to extract rock, were<br />
also assessed, along with CAT’s Quick<br />
TOROMONT <strong>2009</strong> ANNUAL REPORT | 19<br />
Cruickshank had specific criteria in mind when selecting<br />
its equipment, including this CAT excavator.<br />
Coupler system. With it, operators can<br />
remove and replace tools in a matter of<br />
seconds – which eliminates costly<br />
downtime between jobs.<br />
“Cruickshank performed a very<br />
thorough buying process,” said Mr.<br />
McClure. “We were short listed based on a<br />
number of criteria, including our branch<br />
network, people and our collective ability<br />
to perform for them where they do<br />
business. This level of due diligence<br />
makes our win even more special.”<br />
As a general contractor, Cruickshank<br />
has the management and field expertise,<br />
equipment, and construction products to<br />
complete any job and has built roads and<br />
bridges throughout Ontario in all types of<br />
terrain. As a result, since 1998, its<br />
equipment needs have also been served<br />
by Battlefield – The CAT Rental Store.<br />
Cruickshank’s motto, “we do our level<br />
best” expresses the company’s strong<br />
commitment to customer service and<br />
satisfaction. <strong>Toromont</strong> is proud to help<br />
Cruickshank meet this commitment in<br />
2010 and beyond. TIH
20 | TOROMONT <strong>2009</strong> ANNUAL REPORT<br />
cold technology,<br />
hot economics<br />
cimcO’s EnviROnmEnTAl gAmE chAngER EcO chill<br />
SURFAcES SAvingS FOR icE Rink OwnER<br />
CIMCO’S ECO CHILL system provides both<br />
high performance ice for these hockey players<br />
and high energy efficiency for Ridley’s new<br />
ice rink facility.
TOROMONT <strong>2009</strong> ANNUAL REPORT | 21<br />
Ridley college is recognized<br />
internationally for its high<br />
academic standards. Beginning<br />
in 2010, this independent school<br />
in St. catharines, Ontario will<br />
also be recognized for its ability<br />
to heat and air condition its new<br />
arena using ice.<br />
Extracting heat to make ice is a well-known engineering<br />
feat. Less well known is the ability to recover the heat<br />
extracted during the ice making process and re-use it,<br />
as Ridley is doing, to heat the dressing rooms, water for the<br />
showers, snow melting equipment and the floors of an adjacent<br />
field house at its new sports complex.<br />
All of this is made possible with ECO CHILL ® technology<br />
from CIMCO Refrigeration. What makes ECO CHILL special to<br />
Ridley and the many other private and municipally owned arenas<br />
that have installed it is that the technology significantly reduces<br />
heating (and cooling) costs by lowering electricity consumption.<br />
Greenhouse gas (GHG) emissions are also reduced because<br />
utilization of the arena’s natural-gas burning furnaces is lower<br />
and the refrigerants used in ECO CHILL are non-ozone depleting.<br />
Exactly how does ECO CHILL work? In an old style ice rink,<br />
heat is extracted from the five-inch thick concrete pad that sits<br />
below the ice surface and then released outdoors using a heat<br />
exchanger. Heating and cooling for the seating areas and<br />
dressing rooms require additional HVAC systems powered by<br />
natural gas and electricity. In an ECO CHILL rink like Ridley’s,<br />
100% of the heat and cold extracted from the ice rink are<br />
recovered, recycled or stored for future consumption.<br />
“Ice rinks are energy intensive,” says CIMCO’s Dave Sinclair,<br />
Branch Manager for the group that handled the Ridley project for<br />
CIMCO. “A traditional rink consumes 1.5 million kWh of electricity<br />
per year, so reducing this consumption by recycling heat and cold<br />
creates attractive cost savings. In Ridley’s case, the ECO CHILL<br />
system makes 80 tons of heat available, some of which is<br />
recycled for radiant flooring in the adjoining field house (site of its<br />
old ice rink that now serves as a vantage point for the new<br />
450-seat area.) The rest is either stored until it’s needed or is used<br />
to heat dressing rooms, showers and common areas. ECO CHILL<br />
also provides some cooling for the dressing rooms, lobby and<br />
field house through CIMCO’s patented Ice Battery. The Ice<br />
Battery is a thermal storage device that is used to store heat but<br />
can also provide cooling. Economically and environmentally, it’s<br />
the way of the future for ice rinks.” Continued on next page.
22 | TOROMONT <strong>2009</strong> ANNUAL REPORT<br />
In traditional arenas, the refrigeration<br />
and heating systems don’t talk to each<br />
other. By integrating the control systems<br />
for both, CIMCO creates an intelligent<br />
building that is able to store heat, use it<br />
when it’s necessary to meet the facility’s<br />
changing temperature requirements and<br />
reduce peak electricity consumption. The<br />
integration is managed through a<br />
sophisticated computer control system<br />
called ECO SENSE.<br />
ECO SENSE allows Ridley to monitor<br />
its athletic complex remotely, and adjust<br />
temperatures for each room without<br />
physically touching a thermostat. The<br />
technology also collects data on energy<br />
consumption, which will be used to<br />
achieve LEED (Leadership in Energy and<br />
Environmental Design) certification.<br />
To an untrained eye, other than the<br />
Ice Battery, an ECO CHILL-powered<br />
facility looks the same as an ordinary<br />
rink. Most of the equipment, including<br />
CIMCO-engineered high efficiency<br />
screw compressor package, steel<br />
plate and frame heat exchangers, and<br />
microprocessor controls, is contained<br />
in a mechanical room.<br />
Unseen is what goes on in the<br />
concrete pad below the ice rink. There,<br />
entombed in layers of concrete and<br />
insulation, are 52,000 linear feet of pipe.<br />
Inside, a syrupy solution known as glycol<br />
A CIMCO Eco-80A ECO CHILL package at Ridley College.<br />
Complete with screw compressors and plate and frame<br />
heat exchangers, this package provides up to 1,300 MBH<br />
of building heat for the new facility.<br />
circulates in the floor. The cold glycol acts<br />
as a heat transfer fluid to move the heat<br />
away from the floor allowing the floor to<br />
freeze and ice to be made. The rejected<br />
heat is then transferred to a warm glycol<br />
solution that is circulated through piping in<br />
the building to provide heat. A portion of<br />
these same cold and warm glycol flows<br />
are also directed to a system called ECO<br />
DRY, which ventilates, heats and<br />
dehumidifies the arena while keeping<br />
humidity at about 40%. This is important<br />
for Ridley as its arena operates year<br />
round. If left unchecked, particularly in the<br />
summer, humidity in an arena creates fog.<br />
Ammonia is used as the primary<br />
refrigerant that exchanges heat<br />
with the chilled glycol. Ridley chose<br />
ammonia over Freon because ammonia<br />
has no harmful ozone-depleting<br />
properties, offers better heat transfer<br />
characteristics and is ten times less<br />
expensive than Freon.<br />
Since inventing ECO CHILL in 2002,<br />
CIMCO has earned four U.S. and<br />
Canadian patents – the latest granted in<br />
<strong>2009</strong> for ECO CHILL’s computerized<br />
control systems – a prestigious federal<br />
government innovation award, and more<br />
than 100 customers.<br />
In its markets, ECO CHILL has<br />
become the standard for environmentally<br />
responsible ice rinks and as such has<br />
removed, across its installed base, some<br />
50,000 tons of GHG per year – the<br />
equivalent of 11,000 cars travelling 20,000<br />
kilometers each. This environmental payback<br />
is growing each year along with the<br />
installed base.<br />
So how is ECO CHILL performing at<br />
Ridley? Julia Bertollo, Director of Physical<br />
Plant, recommended ECO CHILL to her<br />
Board of Directors, based on a cost/<br />
benefit analysis, five year ROI and the<br />
desire to contribute to the College’s<br />
five-year Sustainable Energy Plan to<br />
reduce energy consumption by 33.5%.<br />
“Our goals were clear,” says<br />
Ms. Bertollo. “Achieve LEED certification,<br />
create an ice surface of NHL calibre and<br />
deliver the arena on budget and on time.<br />
We’ve gotten it all. Although LEED<br />
certification will take a year, operating<br />
statistics so far show that we will be able<br />
to run our new two-building arena<br />
complex for the same price as our old<br />
single facility rink, taking into account<br />
annual hydro and natural gas costs. We’re<br />
also on budget and CIMCO delivered a<br />
beautiful facility exactly when they said they<br />
would – in just 10 months.”<br />
Aside from the technical details, one<br />
other important feature stands out<br />
according to Ms. Bertollo: “The quality of<br />
the ice. It’s simply outstanding.” TIH
EcO chill mAkES<br />
indUSTRiAl<br />
mARkET dEBUT<br />
industrial refrigeration for food,<br />
beverage, blast freezing, cold<br />
storage and process industries is<br />
historically a larger market for CIMCO<br />
than recreational refrigeration.<br />
For this reason, the recent<br />
introduction of ECO CHILL as well<br />
as ammonia-based heat pumps and<br />
other green refrigeration technologies<br />
for industrial customers is a positive<br />
development – one that is creating new<br />
revenue opportunities.<br />
An early adopter of ECO CHILL’s<br />
industrial market offering is Viandes<br />
Paquette. This leading Quebec-based<br />
food production company specializes in<br />
meat processing and quick freezing. It<br />
will use the technology to heat and cool a<br />
complex that includes a meat processing<br />
plant with 40 process rooms and a spiral<br />
freezer, an office space and in the future,<br />
a grocery store. Even its driveway will be<br />
served by ECO CHILL, eliminating the<br />
need to shovel snow in the winter.<br />
The opportunity for ECO CHILL<br />
arose after a violent fire destroyed<br />
Viandes Paquette’s factory. In taking the<br />
decision to rebuild, company President<br />
Guy Paquette and his team decided<br />
to make their new facility a “green”<br />
one. This installation, now underway in<br />
Henryville, Quebec will be a showcase for<br />
environmental management. Outfitted with<br />
a complete ECO CHILL thermal package,<br />
the building will recycle 100% of the<br />
heat it creates and on a projected basis,<br />
reduce annual electrical consumption<br />
by 2.5 million kilowatt hours per year – a<br />
substantial annual savings.<br />
“Unlike most industrial projects where<br />
our sole responsibility is refrigeration, for<br />
Viandes Paquette, we are taking on the<br />
broader role of managing the energy of the<br />
entire plant,” said Benoit Rodier, Quebec<br />
Region Manager for CIMCO. “We’re able<br />
to do this because ECO CHILL is an<br />
integrated energy management system<br />
that works as efficiently and effectively<br />
for industrial applications as it does for<br />
recreational facilities.”<br />
The premise behind ECO CHILL<br />
for industrial applications is the same<br />
TOROMONT <strong>2009</strong> ANNUAL REPORT | 23<br />
An ECO CHILL package is hoisted<br />
to the mechanical room on the roof<br />
of Viandes Paquette’s factory.<br />
as it is for recreational ice rinks: remove<br />
heat to create cold, store the heat rather<br />
than waste it and use it to reduce peak<br />
power consumption. However, there is a<br />
significant difference: size. The Viandes<br />
Paquette building is a two-storey, 130,000<br />
square foot plant.<br />
Size means more equipment. The<br />
Viandes Paquette facility will be equipped<br />
with six ECO DRY units (a new glycol-fed<br />
zero gas, zero electricity air handling<br />
system developed by CIMCO’s team<br />
in Montreal), four Ice Batteries, two<br />
low-temperature screw compressors,<br />
45 evaporators, a boiler for domestic<br />
hot water and a complete building<br />
automation system.<br />
Two closed loop systems will carry<br />
food-grade glycol throughout the plant.<br />
One loop will be used to keep the process<br />
rooms at +/–34 Fahrenheit, the second will<br />
be used to condition the office space. This<br />
is a major project and the first complete<br />
industrial ECO CHILL thermal plant<br />
installation in Canada. TIH
24 | TOROMONT <strong>2009</strong> ANNUAL REPORT<br />
13,600 customers, 36 Stores,<br />
One Rental<br />
company<br />
hOw BATTlEFiEld – ThE cAT REnTAl STORE mAkES<br />
pERFORmAncE hAppEn in TOUgh mARkETS<br />
Battlefield sells and rents Caterpillar multi terrain loaders, like this one,<br />
and other compact construction equipment to many customers.
meeting the needs of 13,600<br />
customers is never easy but<br />
Battlefield – The CAT Rental<br />
Store has made it look that way for<br />
almost 15 years by applying a variety of<br />
customer-focused strategies.<br />
For any rental company, the most<br />
fundamental part of business success is<br />
the ability to meet customer needs – now.<br />
In this business, “yes we have it available<br />
today” means the difference between<br />
deal and no deal.<br />
Answering in the affirmative when a<br />
customer calls takes sophisticated and<br />
attentive inventory management,<br />
calibrated to carrying the right quantities<br />
of the right brand name items.<br />
“Metrics pertaining to time and<br />
financial utilization are Key Performance<br />
Indicator’s for the management of our<br />
business,” says Dale Folkerson,<br />
Battlefield’s VP and General Manager.<br />
“Coupled with industry information on<br />
construction activities, we continually<br />
determine fleet requirements and adjust<br />
our product lists accordingly.”<br />
The seasonal nature of customer<br />
activity in Battlefield’s markets presents a<br />
challenge for inventory management and<br />
business generally. To meet this challenge,<br />
Battlefield has strengthened its product<br />
offerings over the years to include<br />
groundheaters, bottled and bulk propane,<br />
tarps, curing blankets and related<br />
supplies as well as snow removal equipment.<br />
“Whether we provide winter heat<br />
solutions to the expansion of St.<br />
Michael’s Hospital, cement-based grouts<br />
for a bridge deck project on the QEW, or<br />
a scissor lift to change light bulbs in a<br />
shopping plaza, Battlefield emphasizes a<br />
one-stop experience for contractors,” says<br />
Tony Joosse, VP Operations and Regional<br />
Manager for the Greater Toronto Region.<br />
Beyond equipment rental, Battlefield<br />
also generates revenue from the sale of<br />
new and used CAT Compact Construction<br />
Equipment and replacement parts, as<br />
well as product sales and service for<br />
Trimble survey technologies commonly<br />
used by contractors, such as lasers and<br />
optical control instruments.<br />
gETTing TO yES<br />
Meeting a rental need is not only about<br />
what’s in inventory – it’s about how quickly<br />
the product can get out of the warehouse<br />
and into the customer’s place of business.<br />
Battlefield’s objective is to deliver in two<br />
hours or less.<br />
To address this requirement, 36<br />
Battlefield – The CAT Rental Stores<br />
operate in carefully chosen urban and<br />
suburban markets with quick access to<br />
major thoroughfares. Not only do these<br />
brightly lit and distinctive stores attract<br />
walk-in business, they serve pivotal roles<br />
in Battlefield’s hub and spoke model of<br />
distribution.<br />
“When we are located within a 30<br />
minute drive time of construction projects<br />
or customer facilities, we find that<br />
customer expectations can be met<br />
consistently,” says Gerry Hamilton,<br />
Rental Manager, Brampton. “Proximity to<br />
markets is a lynchpin of our financial<br />
model as well.”<br />
Choosing locations for new stores is<br />
more science than art for Battlefield,<br />
which has grown its footprint by four<br />
stores in the past five years with new<br />
locations added organically and by way<br />
of acquisition. To underscore the<br />
short-term “need it now” nature of its<br />
business, about 85% of all rentals are for<br />
durations of less than 30 days.<br />
Sometimes sizeable jobs require a<br />
different approach to service. In certain<br />
TOROMONT <strong>2009</strong> ANNUAL REPORT | 25<br />
(Left) A Battlefield delivery truck loaded with a towable Lincoln Electric welder prepares to depart for a customer jobsite.<br />
(Right) Jay Battrick, Rental Manager at Battlefield’s Barrie location explains the features of a gas-powered Honda generator to a customer.<br />
cases, Battlefield may establish a<br />
“storefront” at the customer’s site to<br />
enable contractors to access equipment in<br />
minutes rather than hours. Battlefield has<br />
operated several of these temporary rental<br />
locations over the past five years at<br />
locations including a nuclear power facility<br />
which used numerous pieces of equipment.<br />
Continued on next page.<br />
“ Battlefield uses technology,<br />
experience, our storefronts<br />
and our delivery fleets in<br />
combination to put value<br />
in each rental transaction.”<br />
Dale Folkerson,<br />
Battlefield VP and General Manager
26 | TOROMONT <strong>2009</strong> ANNUAL REPORT<br />
(Left) A customer uses a pneumatic breaker to weaken a concrete surface. (Right Top) A Battlefield driver enters customer transaction information<br />
into an industry leading, state-of-the-art TRAC hand-held device. (Right Bottom) Jim Connolly, Laser Service Technician at the Laser Service & Repair<br />
Centre at Battlefield’s Brampton location calibrates a laser level to ensure factory specifications are met.<br />
For these and other jobs where<br />
equipment may be used for weeks rather<br />
than days, Battlefield’s TRAC and<br />
e-commerce technologies represent an<br />
added bonus for customers. With these<br />
systems, the customer knows exactly<br />
when the equipment was rented and<br />
where that equipment is at any given<br />
time. The result is a reduction of costs for<br />
idle or lost equipment and much<br />
improved record-keeping.<br />
In 2010, Battlefield will launch the<br />
second generation of its TRAC system to<br />
improve its delivery truck dispatch system<br />
as well as certain administrative efficiencies.<br />
“TRAC II was designed to improve<br />
our delivery truck dispatch functionality<br />
without sacrificing delivery speed to<br />
customers,” said Ross Miller, Battlefield’s<br />
Controller. ”Operating a fleet of 250<br />
delivery trucks is a significant expense,<br />
so improving fleet efficiency reduces fuel<br />
costs, greenhouse gas emissions and the<br />
need to add more trucks to cover<br />
expansions in our territory. While it’s too<br />
early to indicate success with TRAC II, our<br />
objective is to reduce costs by 5–7%.”<br />
Making performance happen is never<br />
easy in any business. That Battlefield has<br />
managed to do so through this recent<br />
downturn is testament not only to its<br />
business formula and the empowerment<br />
of its people, but the loyalty of its<br />
customers – all 13,600 of them. TIH<br />
“ we continued to invest in our<br />
business through the downturn<br />
to increase our competitiveness<br />
and financial utilization.”<br />
Ross Miller,<br />
Battlefield Controller
TOROMONT <strong>2009</strong> ANNUAL REPORT | 27<br />
A Safe and Secure workplace<br />
creating a safe workplace for our<br />
employees is a goal shared by all<br />
<strong>Toromont</strong> leaders, including our<br />
Board of Directors who review health and<br />
safety statistics on a regular basis and<br />
oversee compliance with the Company’s<br />
Code of Business Conduct. While a<br />
top-down approach is used to ensure all<br />
safety rules are implemented and<br />
enforced, real success comes from<br />
creating a “safety first” culture.<br />
In all business units, service<br />
technicians hold “tool box” meetings that<br />
focus on safety and throughout the day<br />
all employees are reminded of the<br />
importance of safety through posters,<br />
daily emails and monthly newsletters. A<br />
safety suggestion contest was launched<br />
across <strong>Toromont</strong> in search of the best<br />
safety ideas from our employees. The use<br />
of cellphone and electronic devices has<br />
been banned while driving – well ahead<br />
of provincial and state rule changes. On<br />
every job, it’s mandatory for our<br />
employees to identify and document the<br />
potential risks and review procedures to<br />
minimize those risks. Some 60,000<br />
hazard assessments were completed by<br />
<strong>Toromont</strong> CAT employees in <strong>2009</strong> alone.<br />
While these are corporate-wide<br />
initiatives, each of our business units<br />
focuses on the special needs of their<br />
workforce. As part of its work alone<br />
PUT YOUR BEST FOOT FORWARD!<br />
WEAR FOOT PROTECTION!<br />
FOOT PROTECTION REQUIRED<br />
BEYOND THIS POINT<br />
CSA APPROVED STEEL TOE, STEEL PLATE REQUIRED.<br />
MAY ALSO REQUIRE ELECTRIC SHOCK PROTECTION<br />
IF EXPOSED TO LIVE ELECTRICAL CONDUCTORS.<br />
FOR MORE INFO CONTACT:<br />
H&S 416-514-4760<br />
OR VISIT: http://info.toromont.com/hrcat/healthsafety_program/Safety_Standards.asp<br />
policy, <strong>Toromont</strong> CAT uses a satellitebased<br />
SPOT device to monitor the safety<br />
of its employees in the field. SPOT<br />
satellite GPS messenger devices work<br />
in locations where cellphones do not<br />
and with the click of a button, enable<br />
technicians to connect to 911 services.<br />
At <strong>Toromont</strong> Energy Systems (TESI),<br />
a new behavioural-based approach has<br />
been adopted called AWARE. Its purpose<br />
is to empower employees to root out<br />
unsafe behaviours and conditions and<br />
promote mutual accountability for a safe<br />
workplace. At Battlefield – The CAT Rental<br />
Store where employees log over 11<br />
million kilometers a year, driver training is<br />
both obligatory and much valued, not<br />
only by its employees, but customers<br />
who need on-time delivery every time. In<br />
<strong>2009</strong>, CIMCO began to implement new<br />
software that streamlines the overall<br />
management of the safety process.<br />
Recognition programs are also used<br />
to encourage safe practices. Sometimes<br />
recognition comes from customers.<br />
TESI’s Houston service group was<br />
honoured in May <strong>2009</strong> by Shell with the<br />
2008 HSE Contractor Award in<br />
recognition of safety excellence. A<br />
Number 1 Safety Award was given to<br />
CIMCO by Giffels Design-Build Inc. in<br />
recognition of CIMCO’s safety program<br />
on a major project in B.C.<br />
DON'T BE AFRAID<br />
TO LOOK ME IN THE EYES!<br />
WEAR EYE PROTECTION!<br />
EYE PROTECTION REQUIRED<br />
BEYOND THIS POINT<br />
EYE PROTECTION CAN INCLUDE:<br />
SAFETY GLASSES, GOGGLES, FACE SHIELD, ETC...<br />
FOR MORE INFO CONTACT:<br />
H&S 416-514-4760<br />
OR VISIT: http://info.toromont.com/hrcat/healthsafety_program/Safety_Standards.asp<br />
HEARING PROTECTION REQUIRED<br />
BEYOND THIS POINT<br />
FOR MORE INFO CONTACT:<br />
H&S 416-514-4760<br />
The payback on these efforts? Fewer<br />
injured employees – lost time injuries<br />
were reduced year over year by 45%.<br />
This ongoing effort underscores a<br />
philosophy best described by David<br />
Wetherald, <strong>Toromont</strong>’s Vice President<br />
Human Resources and Legal: “<strong>Toromont</strong><br />
has made a serious commitment to<br />
achieving an injury-free, productive and<br />
engaging workplace. We are making<br />
headway, but this is a job that never ends<br />
and a commitment that will not fade.” TIH<br />
Ownership<br />
works<br />
To make it easier for our employees<br />
to acquire an ownership stake in<br />
<strong>Toromont</strong>, we have offered a<br />
Company-match in our Employee Share<br />
Ownership Plan (ESOP) since 2008. For<br />
every $3 contributed to the employee<br />
share ownership plan, <strong>Toromont</strong> invests<br />
$1 to a maximum of $1,000 per year.<br />
Now, more than 48% of our employees<br />
are shareholders. This program aligns<br />
our employees in a common cause:<br />
creating shareholder value. TIH<br />
WHAT SOUNDS BETTER?<br />
A TRACTOR OR<br />
YOUR KIDS LAUGHTER?<br />
WEAR YOUR HEARING<br />
PROTECTION TO HEAR<br />
WHAT YOU REALLY WANT<br />
TO HEAR!<br />
HEARING LOSS CAN OCCUR WHERE dB LEVELS EXCEED 85dB CONSISTENTLY.<br />
HEARING PROTECTION INCLUDES BOTH EAR PLUGS OR EAR MUFFS.<br />
OR VISIT: http://info.toromont.com/hrcat/healthsafety_program/Safety_Standards.asp<br />
<strong>Toromont</strong> uses a variety<br />
of tools, including posters<br />
like these, to encourage<br />
all employees to embrace<br />
safe and smart workplace<br />
practices.
28 | TOROMONT <strong>2009</strong> ANNUAL REPORT<br />
community<br />
Support<br />
we are proud that once again in <strong>2009</strong>, our employees,<br />
working together and individually, made a difference<br />
in our communities. An ongoing example is support<br />
provided to United Way. To raise funds for this important cause,<br />
<strong>Toromont</strong> CAT employees and their families participated in<br />
seven fundraisers, including the marquee event, the <strong>Toromont</strong>sponsored<br />
Dragon Boat Festival of York Region which attracted<br />
1,800 spectators including 315 people from <strong>Toromont</strong>. This year<br />
marked the first time that CIMCO employees also participated<br />
in the races. These events encouraged teamwork and went a<br />
long way in helping employees and <strong>Toromont</strong> contribute over<br />
$180,000 in <strong>2009</strong>, and a total of $657,075 donated to United Way<br />
since 2003.<br />
Beyond financial contributions, 22 employees participated<br />
in United Way “Days of Caring” when they worked at the Sandgate<br />
Women’s Shelter (a transitional shelter) and the Vitanova<br />
Foundation, which provides support to people suffering from<br />
substance abuse. <strong>Toromont</strong> CAT was honoured with the United<br />
Way of York Region <strong>2009</strong> Days of Caring Spirit Award for its<br />
participation. Two <strong>Toromont</strong> executives also served on or<br />
chaired United Way of York Region fundraising committees,<br />
further strengthening the bonds between our organizations.<br />
Our business units also supported other causes such as<br />
food banks, homeless shelters and foundations for children.<br />
CIMCO and <strong>Toromont</strong> CAT employees at the <strong>2009</strong> <strong>Toromont</strong> CAT Dragon Boat Festival in King City, Ontario.<br />
Community support also involves educational initiatives.<br />
In addition to scholarships at Centennial College, since 2008<br />
we have offered a scholarship in motive power techniques at<br />
Sir Sandford Fleming College for Inuit students. This scholarship<br />
is only one element of our support. We have been active for<br />
more than a decade with Kitikmeot, Qikiqtaalluk and Sakku Inuit<br />
organizations. The goal of this partnership is to bring the<br />
benefits of employment and skills development north. TIH<br />
Day of Caring volunteer team at work at Sandgate Women’s Shelter<br />
of York Region in Sutton, Ontario.
Environmental<br />
Stewardship<br />
we help customers to improve their environmental<br />
practices (see Glanbrook Landfill page 10 and ECO<br />
CHILL page 20) but we also seek to improve our own.<br />
As part of this ongoing effort, we examined our operations<br />
in <strong>2009</strong> and began to take inventory of our environmental<br />
practices to form a baseline for a carbon mitigation strategy.<br />
It will take time and effort to develop this sustainability strategy<br />
but we believe it’s imperative to have our own house in order<br />
which means having verifiable achievements.<br />
We also continued to encourage our employees to innovate<br />
with a goal of doing more with less and increasing our efficiency<br />
and competitiveness while reducing our environmental impacts.<br />
This led to some big and small changes, a few of which are<br />
described below.<br />
To eliminate waste, a pilot project at our Concord, Ontario<br />
branch proved to be successful in recycling absorbent pads<br />
used to soak up oil and other lubricants. In the past, these<br />
pads were either buried in a landfill or incinerated. Dave Tufts,<br />
<strong>Toromont</strong> CAT’s Environmental and Facilities Manager, found<br />
a company that would collect, clean and return these pads,<br />
thereby eliminating a substantial waste stream.<br />
TOROMONT <strong>2009</strong> ANNUAL REPORT | 29<br />
“While this initiative is only cost neutral, it works so well in<br />
diverting waste that we have rolled it out to multiple branches,”<br />
said Mr. Tufts. “In <strong>2009</strong>, we diverted 5,400 kilograms of waste<br />
from landfill and recycled 3,430 litres of liquids. We will do much<br />
more in 2010.”<br />
<strong>Toromont</strong> CAT’s Reman operations implemented a lights/<br />
computers off policy, installed programmable thermostats and<br />
minimized environmental waste by installing a ZEP shurfill brake<br />
clean refill system. This system eliminates the use of aerosol<br />
from parts cleaning and is less expensive. Electricity use was<br />
also reduced – by 20,000 kilowatt hours per month – with the<br />
installation of a variable speed air compressor used to power<br />
hand tools. Similar efforts were undertaken at other branches<br />
as part of a broader pledge made by <strong>Toromont</strong> CAT to reduce<br />
its energy consumption by 10% over three years.<br />
Battlefield invested in two more equipment washing<br />
systems, at a capital cost of over $300,000. These systems<br />
not only conserve up to 1,245 cubic metres of water a year per<br />
location, they capture particles of oil and fuel residue removed<br />
from the equipment while it’s cleaned, allowing for safer disposal.<br />
More of these systems will be installed in the future. TIH
30 | TOROMONT <strong>2009</strong> ANNUAL REPORT<br />
corporate governance Overview<br />
A strong and effective corporate governance program continues to be a principal priority for <strong>Toromont</strong>. The Nominating and Corporate<br />
Governance Committee, on behalf of the Board, establishes and monitors the governance program and its effectiveness. The Company’s<br />
corporate governance structure and procedures are founded on our Code of Business Conduct that applies to all directors, officers<br />
and employees. Our governance program includes the activities of the Board of Directors, who are elected by and are accountable to<br />
the shareholders, and the activities of management who are appointed by the Board and are charged with the day-to-day management<br />
of the Company.<br />
<strong>Toromont</strong> regularly reviews and enhances its governance practices in response to evolving regulatory developments and other<br />
applicable legislation.<br />
The Company’s corporate governance program is in compliance with National Policy 58-201 – Corporate Governance Guidelines<br />
and Multilateral Instrument 52-110 – Audit Committees.<br />
BOARd OF diREcTORS<br />
The role of the Board of Directors, its activities and responsibilities are documented and are assessed at least annually, as are the<br />
terms of reference for each of the committees of the Board, the Chairs of the committees, the Lead Director and the Chairman,<br />
inclusive of scope and limits of authority of management. The Board acts in a supervisory role and any responsibilities not delegated<br />
to management remain with the Board. The Board’s supervisory role includes such matters as strategic planning, identification and<br />
management of risks, succession planning, communication policy, internal controls and governance.<br />
The Lead Director is an independent director appointed annually by the independent directors of the Board to facilitate the<br />
Board’s functioning autonomously from management. The Lead Director serves as a non-partisan contact for other directors on matters<br />
not deemed appropriate to be discussed initially with the Chairman or in situations where the Chairman is not available. The Lead Director<br />
is available to counsel the Chairman on matters appropriate for review in advance of discussion with the full Board of Directors. The<br />
Lead Director chairs a session at each Board meeting during which only independent directors are present.<br />
cOmmiTTEE STRUcTURE And mAndATES<br />
Committees of the Board are an integral part of the Company’s governance structure. Three committees have been established with a<br />
view to allocating expertise and resources to particular areas, and to enhance the quality of discussion at Board meetings. The committees<br />
facilitate Board decision-making by providing recommendations to the Board on matters within their respective responsibilities.<br />
All committees are comprised solely of directors who are independent of management. A summary of the responsibilities of the<br />
committees follow.<br />
The Nominating and Corporate Governance Committee: Principal responsibilities are reviewing and making recommendations as<br />
to all matters relating to effective corporate governance. The committee is responsible for assessing effectiveness of the Board, its<br />
size and composition, its committees, director compensation, the Board’s relationship to management and individual performance and<br />
contribution of its directors. The committee is responsible for identification and recruitment of new directors and new director orientation.<br />
The Audit Committee: Principal duties include oversight responsibility for financial statements and related disclosures, reports to<br />
shareholders and other related communications, establishment of appropriate financial policies, the integrity of accounting systems<br />
and internal controls, legal compliance on ethics programs established by management, the approval of all audit and non-audit services<br />
provided by the independent auditors and consultation with the auditors independent of management and overseeing the work of the<br />
auditors and the Internal Audit department.<br />
The Human Resources and Compensation Committee: Principal responsibilities are compensation of executive officers and other<br />
senior management, short- and long-term incentive programs, pension and other benefit plans, executive officer appointments, evaluation<br />
of performance of the Chief Executive Officer, succession planning and executive development. The committee also oversees compliance<br />
with the Company’s Code of Business Conduct and the health, safety and environment program.
Board of directors<br />
Robert S. Boswell Director since 2007<br />
Mr. Boswell is Chairman and Chief Executive Officer<br />
of Laramie Energy II, LLC., a Denver-based company<br />
primarily focused on finding and developing natural<br />
gas reserves from unconventional gas reservoirs<br />
within the Western Sedimentary Basin of North<br />
America. He is also a director of Complete<br />
Production Services, Inc., an oil and gas service<br />
provider based in Houston, Texas.<br />
Robert m. Franklin l s Director since 1994<br />
Chairman, Human Resources and<br />
Compensation Committee<br />
Mr. Franklin is President of Signalta Capital<br />
Corporation, a private investment company.<br />
He is also a director of Barrick Gold Corporation,<br />
First Uranium Corporation, and Canadian Tire<br />
Corporation.<br />
Ronald g. gage, f c a n l Director since 2000<br />
Chairman, Nominating and<br />
Corporate Governance Committee<br />
Mr. Gage is a Fellow of The Institute of Chartered<br />
Accountants of Ontario. He is a director of Invesco<br />
Trimark Canada Fund Inc., Invesco Trimark<br />
Corporate Class Inc., easyhome <strong>Ltd</strong>., and the<br />
Canadian Public Accountability Board.<br />
david A. galloway n s Director since 2002<br />
Mr. Galloway is Chairman of the Board of<br />
Directors of Bank of Montreal. He also serves on<br />
the Board of Directors of E.W. Scripps Company.<br />
n Member of Nominating and<br />
Corporate Governance Committee<br />
l Member of Audit Committee<br />
s Member of Human Resources and<br />
Compensation Committee<br />
Back row left to right:<br />
H. Stanley Marshall<br />
Ronald G. Gage<br />
Stephen J. Savidant<br />
David A. Galloway<br />
Robert M. Franklin<br />
Front row left to right:<br />
Robert M. Ogilvie<br />
Robert S. Boswell<br />
Wayne S. Hill<br />
John S. McCallum<br />
wayne S. hill Director since 1988<br />
Mr. Hill is a former Executive Vice President of<br />
the Company. Mr. Hill joined <strong>Toromont</strong> in 1985<br />
as Vice President, Finance and Chief Financial<br />
Officer and became Executive Vice President in<br />
2002. He retired from the Company in May 2008.<br />
He is also a director of First Uranium Corporation.<br />
h. Stanley marshall s Director since 1998<br />
Mr. Marshall is President and Chief Executive<br />
Officer and a director of Fortis Inc. and several<br />
of its subsidiaries (an international electric utility<br />
holding company).<br />
john S. mccallum n l Director since 1985<br />
Lead Director and Chairman, Audit Committee<br />
Mr. McCallum is a Professor of Finance in the<br />
I.H. Asper School of Business at the University<br />
of Manitoba. He is also a director of IGM<br />
Financial Inc., Wawanesa Mutual Insurance<br />
Company, Wawanesa General Insurance<br />
Company, Wawanesa Life Insurance Company<br />
and Fortis Inc. (including subsidiaries in British<br />
Columbia and Alberta).<br />
TOROMONT <strong>2009</strong> ANNUAL REPORT | 31<br />
Robert m. Ogilvie Director since 1986<br />
Mr. Ogilvie is Chairman of the Board and Chief<br />
Executive Officer of the Company. Mr. Ogilvie<br />
joined <strong>Toromont</strong> in 1985 and has been Chairman<br />
since 1987. He has also been the Company’s CEO<br />
since 1987, excluding the period from 2002 to<br />
2006. Mr. Ogilvie is also on the Board of Regents<br />
of Mount Allison University.<br />
Stephen j. Savidant Director since 2007<br />
Mr. Savidant is an independent businessman<br />
and Chairman of ProspEx Resources <strong>Ltd</strong>., a<br />
Calgary-based oil and gas company focused<br />
on exploration for natural gas in the Western<br />
Canadian Sedimentary Basin. He is also a<br />
director of Empire Company Limited.
32 | TOROMONT <strong>2009</strong> ANNUAL REPORT<br />
Management’s Discussion and Analysis<br />
of Financial Results for the year ended December 31, <strong>2009</strong><br />
This Management’s Discussion and Analysis (“MD&A”) comments on the operations, performance and financial condition of <strong>Toromont</strong><br />
<strong>Industries</strong> <strong>Ltd</strong>. (“<strong>Toromont</strong>” or the “Company”) as at and for the year ended December 31, <strong>2009</strong>, compared to the preceding year. This<br />
MD&A should be read in conjunction with the attached audited consolidated financial statements and related notes for the year ended<br />
December 31, <strong>2009</strong>.<br />
The consolidated financial statements reported herein have been prepared in accordance with Canadian Generally Accepted<br />
Accounting Principles (“GAAP”) and are reported in Canadian dollars. The information in this MD&A is current to February 5, 2010.<br />
Additional information is contained in the Company’s filings with Canadian securities regulators, including the Company’s <strong>Annual</strong><br />
Information Form. These filings are available on SEDAR at www.sedar.com and on the Company’s website at www.toromont.com.<br />
ADVISORY<br />
Statements and information herein that are not historical facts are “forward-looking information”. Words such as “plans”, “intends”, “outlook”,<br />
“expects”, “anticipates”, “estimates”, “believes”, “likely”, “should”, “could”, “will”, “may” and similar expressions are intended to identify<br />
forward-looking information and statements.<br />
By their nature, forward-looking information and statements are subject to risks and uncertainties which may be beyond <strong>Toromont</strong>’s<br />
ability to control or predict. Actual results or events could differ materially from those expressed or implied by forward-looking information<br />
and statements. Factors that could cause actual results or events to differ from current expectations include, among others: business<br />
cycle risk, including general economic conditions in the countries in which <strong>Toromont</strong> operates; risk of commodity price changes including<br />
precious and base metals and natural gas; risk of changes in foreign exchange rates, including the Cdn$/US$ exchange rate; risk of the<br />
termination of distribution or original equipment manufacturer agreements; risk of equipment product acceptance and availability of supply;<br />
risk of increased competition; credit risk related to financial instruments; risk of additional costs associated with warranties and maintenance<br />
contracts; interest rate risk on financing arrangements; risk of availability of financing; risk of environmental regulation; and risks related to<br />
the integration of Enerflex’s operations with those of <strong>Toromont</strong>. Additional information on these factors and other risks and uncertainties<br />
that could cause actual results or events to differ from current expectations can be found in the “Risks and Risk Management” and<br />
“Outlook” section of this MD&A. Other factors, risks and uncertainties not presently known to <strong>Toromont</strong> or that <strong>Toromont</strong> currently<br />
believes are not material could also cause actual results or events to differ materially from those expressed or implied by forward-looking<br />
information and statements.<br />
Forward-looking information and statements contained herein about prospective results of operations, financial position or cash<br />
flows that are based on assumptions about future economic conditions and courses of action are presented for the purpose of assisting<br />
<strong>Toromont</strong>’s shareholders in understanding management’s current view regarding those future outcomes and may not be appropriate for<br />
other purposes. Readers are cautioned not to place undue reliance on the forward-looking information and statements contained herein,<br />
which are given as of the date of this document, and not to use such information and statements for anything other than their intended<br />
purpose. <strong>Toromont</strong> disclaims any obligation or intention to update or revise any forward-looking information or statement, whether the<br />
result of new information, future events or otherwise, except as required by applicable law.<br />
CORPORATE PROFILE AND BUSINESS SEGMENTATION<br />
As at December 31, <strong>2009</strong>, <strong>Toromont</strong> employed approximately 3,800 people in more than 129 locations, predominately in Canada and the<br />
United States. <strong>Toromont</strong> is listed on the Toronto Stock Exchange under the symbol TIH. The Company serves its customers through two<br />
business groups.<br />
The Equipment Group sells, rents and services a broad range of specialized construction equipment and industrial engines. These<br />
activities generated 48% of the Company’s revenues in <strong>2009</strong> (2008 – 52%). The Equipment Group is comprised of <strong>Toromont</strong> CAT, one of the<br />
world’s larger Caterpillar dealerships by revenue and geographic territory, and Battlefield – The CAT Rental Store, an industry-leading<br />
rental operation. Performance in the Equipment Group is driven by activity in several industries: road building and other infrastructurerelated<br />
activities; residential and commercial construction; mining; aggregates; waste management; steel; forestry; and agriculture. Other<br />
significant activities include sales and product support activities for Caterpillar engines used in a variety of applications including industrial,<br />
commercial, marine, on-highway trucks and power generation.<br />
The Compression Group is a leading North American business specializing in the design, engineering, fabrication, installation<br />
and after-sale support of compression, process and refrigeration systems. These activities generated 52% of the Company’s revenues<br />
in <strong>2009</strong> (2008 – 48%). In <strong>2009</strong>, the Compression Group was comprised of <strong>Toromont</strong> Energy Systems Inc., a leader in supplying and<br />
servicing compression and process systems used in natural gas, fuel gas and carbon dioxide applications and CIMCO Refrigeration,<br />
a leader in industrial and recreational markets. Results in the Compression Group are influenced by conditions in the primary market<br />
segments served: natural gas production and transportation; chemical, petrochemical, food and beverage processing; cold storage; food<br />
distribution; and ice rink construction.
TOROMONT <strong>2009</strong> ANNUAL REPORT | 33<br />
ACQUISITION OF ENERFLEX<br />
On January 20, 2010, <strong>Toromont</strong> completed its take-over bid for Enerflex Systems Income Fund (“Enerflex”), acquiring a total of approximately<br />
42.2 million trust units and exchangeable limited partnership units. Together with the trust units owned by <strong>Toromont</strong> prior to commencement<br />
of the take-over bid, <strong>Toromont</strong> now owns approximately 96% of the outstanding trust units on a fully-diluted basis. <strong>Toromont</strong> will acquire<br />
the balance of the outstanding trust units on February 26, 2010. The total consideration for Enerflex is approximately $670 million, including<br />
units acquired prior to the take-over bid, units acquired in the take-over bid and the second step transaction.<br />
Enerflex is a supplier of products and services to the global oil and gas production industry, and has operations in Canada, Australia,<br />
the Netherlands, the United States, Germany, Pakistan, the United Arab Emirates, Egypt, Indonesia and Malaysia.<br />
This important transaction brings together Enerflex and <strong>Toromont</strong> Energy Systems, reported in the Compression Group, to create a<br />
stronger organization (named “Enerflex <strong>Ltd</strong>.”), better able to serve customers and compete in both North American and international<br />
markets. The combined organization has significant presence in key global markets including Canada, the United States, Australia, Europe<br />
and the Middle East. The new Enerflex benefits from increased financial strength and access to capital and is better positioned to serve<br />
customers. <strong>Toromont</strong> also expects to realize attractive synergies and cost savings through the elimination of excess fabrication capacity,<br />
overlapping service facilities, certain public company costs of Enerflex and duplicative head office and general and administration expenses.<br />
<strong>Toromont</strong> acquired the Enerflex units tendered to its take-over bid with cash and shares, and will acquire the remaining trust units<br />
on the same terms. In the aggregate, <strong>Toromont</strong> will pay approximately $315.6 million in cash and issue 11.9 million common shares for<br />
these units.<br />
The cash consideration of the purchase price along with transaction costs and repayment of $100.6 million in senior secured notes<br />
payable at Enerflex will be largely financed with additional unsecured bank debt under a new term loan facility that <strong>Toromont</strong> closed in<br />
January 2010. Borrowings of up to $450 million are available to <strong>Toromont</strong> under this facility, with draw downs to occur by July 2010, and<br />
are due in July 2011 (eighteen month term). Interest on borrowings is charged at floating rates based on Canadian prime rate or Canadian<br />
Bankers’ Acceptances rate, plus a specified margin.<br />
This acquisition will be accounted for as a business combination with <strong>Toromont</strong> as the acquirer of Enerflex. The purchase method of<br />
accounting will be used. The Company is in the process of finalizing the estimated fair values of assets acquired and liabilities assumed<br />
at the date of acquisition, including goodwill and identifiable intangible assets. The consolidated results of operations of Enerflex will be<br />
included in the Consolidated Statement of Earnings after January 20, 2010.<br />
Except as otherwise disclosed, the information presented herein excludes Enerflex and its businesses as Enerflex was acquired after<br />
December 31, <strong>2009</strong>.<br />
PRIMARY OBJECTIVE AND MAJOR STRATEGIES<br />
A primary objective is to build shareholder value through sustainable and profitable growth, founded on a strong financial position. To guide<br />
its activities in pursuit of this objective, <strong>Toromont</strong> works toward specific, long-term financial goals (see “Key Performance Measures”) and<br />
each of its operating groups consistently employs the following broad strategies:<br />
Expand Markets<br />
<strong>Toromont</strong> serves a diverse number of markets that offer significant long-term potential for profitable expansion. Each operating group<br />
strives to achieve or maintain leading positions in served markets. Incremental revenues are derived from improved coverage, market<br />
share gains and geographic expansion. Expansion of the installed base of equipment provides the foundation for future product support<br />
growth and leverages the fixed costs associated with the Company’s infrastructure.<br />
Strengthen Product Support<br />
<strong>Toromont</strong>’s parts and service business is a significant contributor to overall profitability and serves to stabilize results through economic<br />
downturns. Product support activities also represent opportunities to develop closer relationships with customers and differentiate the<br />
Company’s product and service offering. The ability to consistently meet or exceed customers’ expectations for service efficiency and<br />
quality is critical, as after-market support is an integral part of the customer’s decision-making process when purchasing equipment.<br />
Broaden Product Offerings<br />
<strong>Toromont</strong> delivers specialized capital equipment to a diverse range of customers and industries. Collectively, thousands of different parts<br />
are offered through the Company’s distribution channels. The Company expands its customer base through selectively extending product<br />
lines and capabilities. In support of this strategy, <strong>Toromont</strong> represents product lines that are considered leading, and often best-in-class<br />
from suppliers and business partners who continually expand and develop their offerings. Strong relationships with suppliers and business<br />
partners are critical in achieving growth objectives.<br />
Invest in Resources<br />
The combined knowledge and experience of <strong>Toromont</strong>’s people is a key competitive advantage. Growth is dependent on attracting,<br />
retaining and developing employees with values that are consistent with <strong>Toromont</strong>’s. Incentive programs, a strong share ownership
34 | TOROMONT <strong>2009</strong> ANNUAL REPORT<br />
Revenue<br />
($ MiLLiONs)<br />
<strong>2009</strong><br />
2008<br />
2007<br />
2006<br />
2005<br />
and highly principled culture result in a close alignment of employee and shareholder interests. By investing in employee training<br />
and development, the capabilities and productivity of employees continually improve to better serve shareholders, customers and<br />
business partners.<br />
<strong>Toromont</strong>’s information technology represents another competitive differentiator in the marketplace. The Company’s selective<br />
investments in technology, inclusive of e-commerce initiatives, strengthen customer service capabilities, generate new opportunities<br />
for growth, drive efficiency and increase returns to shareholders.<br />
Maintain a Strong Financial Position<br />
A strong, well-capitalized balance sheet creates financial flexibility, and has contributed to the Company’s long-term track record of profitable<br />
growth. It is also fundamental to the Company’s future success.<br />
CONSOLIDATED RESULTS OF OPERATIONS<br />
Years ended December 31 ($ thousands, except per share amounts) <strong>2009</strong> 2008 % change<br />
REvENUEs $ 1,824,592 $ 2,121,209 (14%)<br />
Cost of goods sold 1,415,476 1,660,285 (15%)<br />
Gross profit 409,116 460,924 (11%)<br />
Selling and administrative expenses 226,764 253,070 (10%)<br />
OPERATiNg iNcOME 182,352 207,854 (12%)<br />
Interest expense 8,815 11,753 (25%)<br />
Interest and investment income (6,355) (14,999) (58%)<br />
Income before income taxes 179,892 211,100 (15%)<br />
Income taxes 59,376 70,247 (15%)<br />
EARNiNgs fROM cONTiNUiNg OPERATiONs 120,516 140,853 (14%)<br />
Loss on disposal of discontinued operations – (432) n/m<br />
Earnings from discontinued operations – 103 n/m<br />
NET EARNiNgs $ 120,516 $ 140,524 (14%)<br />
EARNiNgs PER shARE – BAsic $ 1.86 $ 2.16 (14%)<br />
KEy RATiOs:<br />
Gross profit as a % of revenues 22.4% 21.7%<br />
Selling and administrative expenses as a % of revenues 12.4% 11.9%<br />
Operating income as a % of revenues 10.0% 9.8%<br />
Income taxes as a % of income before income taxes 33.0% 33.3%<br />
n/m = not meaningful<br />
1,584.9<br />
1,824.6<br />
1,746.2<br />
1,886.8<br />
2,121.2<br />
Operating income<br />
($ MiLLiONs)<br />
<strong>2009</strong> 182.4<br />
2008<br />
2007<br />
2006<br />
2005<br />
Revenues decreased by $296.6 million or 14% in <strong>2009</strong> compared to a year ago on weak economic conditions. Compression revenues were<br />
down 8% while Equipment revenues were down 20%.<br />
The Canadian/U.S. dollar exchange rate impacts reported revenues on the translation of the financial statements of the Compression<br />
Group’s growing U.S. operations. Exchange rates between the Canadian and US dollar have been volatile in <strong>2009</strong>, ranging from a low of<br />
$0.77 to a high of $0.97; on average, the Canadian dollar was 6% weaker in <strong>2009</strong> compared to 2008. The impact in <strong>2009</strong> was an increase<br />
in revenues of $40 million and net income by $3 million. In addition, the exchange rate impacts revenues in the Canadian operations of<br />
both the Equipment and Compression Groups, as pricing to customers typically reflects movements in the exchange rate on U.S. sourced<br />
equipment, components and spare parts, although this will typically lag posted rate changes, given the age of inventory, timing of orders<br />
and hedging practices.<br />
Gross profit margin in <strong>2009</strong> was 22.4%, compared to 21.7% in 2008. The change in gross margin reflected the increased proportion<br />
of revenues coming from the relatively higher margin product support business within the Equipment Group. Compression Group gross<br />
margins were 40 basis points higher on improved sales mix and project execution. In 2008, the Compression Group reported several large<br />
pipeline projects which carried lower margins. Equipment Group gross profit margins were 140 basis points higher on a change in sales mix,<br />
with a higher proportion of product support business in <strong>2009</strong> compared to 2008.<br />
Selling and administrative expenses decreased $26.3 million or 10% in <strong>2009</strong>, tracking the 14% decrease in revenue. Compensation costs<br />
were $8.4 million lower due to reduced staffing levels and lower profit sharing related to lower earnings. Bad debt expense decreased<br />
119.6<br />
165.3<br />
180.1<br />
207.9
Equipment group Revenue<br />
($ MiLLiONs)<br />
<strong>2009</strong><br />
2008<br />
2007<br />
2006<br />
2005<br />
881.3<br />
913.9<br />
987.9<br />
1,099.2<br />
1,098.3<br />
TOROMONT <strong>2009</strong> ANNUAL REPORT | 35<br />
$6.9 million reflecting strong collections experience and an improved aging of accounts receivable. Sales-related expenses such as freight,<br />
service costs and marketing were down approximately $4.7 million on lower activity levels. Other costs including occupancy, travel and<br />
training were tightly controlled in light of the economic slowdown resulting in an annual reduction of approximately $8.2 million. Foreign<br />
exchange on translation of subsidiaries increased expense $2.3 million. Selling and administrative expenses as a percentage of revenues<br />
were 12.4% for <strong>2009</strong>, versus 11.9% in 2008.<br />
Operating income declined $25.5 million or 12% in <strong>2009</strong> compared to the prior year on lower revenues, partially offset by improved<br />
gross margins. Operating income as a percentage of revenue improved to 10.0% from 9.8% in 2008.<br />
Interest expense was $2.9 million or 25% lower in <strong>2009</strong> than in the prior year. Certain long-term debt was repaid during the year as<br />
scheduled and served to reduce the effective average interest rate.<br />
Interest and investment income in 2008 included gains realized on the sale of marketable securities of $8.2 million, or $0.10 per share<br />
after tax. Excluding this item, interest and investment income decreased $0.4 million or 6% from the prior year reflecting lower interest rates<br />
on investing of excess cash, partially offset by higher dividend income on Enerflex trust units held during <strong>2009</strong>.<br />
The effective income tax rate for <strong>2009</strong> was 33.0% compared to 33.3% for 2008, reflecting lower corporate income tax rates in <strong>2009</strong>.<br />
Net earnings in <strong>2009</strong> were $120.5 million, $1.86 basic earnings per share (“EPS”), down 14% from 2008. Excluding investment gains<br />
in 2008, net earnings and EPS in <strong>2009</strong> were down 10%.<br />
Comprehensive income for the year was $109.0 million, comprised of net earnings of $120.5 million and other comprehensive loss of<br />
$11.5 million. Other comprehensive loss arose primarily from a loss on translation of self-sustaining foreign operations of $23.3 million and<br />
a decrease in fair value of derivatives designated as cash flow hedges of $4.1 million, partially offset by an unrealized gain on Enerflex trust<br />
units designated as available for sale assets of $15.6 million.<br />
BUSINESS SEGMENT OPERATING RESULTS<br />
The accounting policies of the segments are the same as those of the consolidated entity. Management evaluates overall business segment<br />
performance based on revenue growth and operating income relative to revenues. Corporate expenses are allocated based on each segment’s<br />
operating income. Interest expense and interest and investment income are not allocated.<br />
Results of Operations in the Equipment Group<br />
Equipment group Operating income<br />
($ MiLLiONs)<br />
<strong>2009</strong> 85.4<br />
Years ended December 31 ($ thousands) <strong>2009</strong> 2008 % change<br />
Equipment sales and rentals<br />
New $ 336,907 $ 503,478 (33%)<br />
Used 118,273 145,069 (18%)<br />
Rental 137,536 151,342 (9%)<br />
Total equipment sales and rentals 592,716 799,889 (26%)<br />
Power generation 9,692 8,893 9%<br />
Product support 278,938 290,431 (4%)<br />
Total revenues $ 881,346 $ 1,099,213 (20%)<br />
Operating income $ 85,441 $ 108,672 (21%)<br />
Capital expenditures $ 37,706 $ 65,835 (43%)<br />
KEy RATiOs:<br />
Product support revenues as a % of total revenues 31.6% 26.4%<br />
Group total revenues as a % of consolidated revenues 48.3% 51.8%<br />
Operating income as a % of revenues 9.7% 9.9%<br />
2008<br />
2007<br />
2006<br />
2005<br />
Results in the Equipment Group were dampened by weak economic conditions in Canada.<br />
New equipment sales were 33% lower in <strong>2009</strong> compared to 2008 on lower unit sales. Industrial power systems applications, including<br />
prime and backup power systems, recorded good deliveries in the year. Other market segments, most notably heavy and general<br />
construction, and mining were lower.<br />
Used equipment sales were 18% lower year-over-year, reflecting weaker market conditions. Sales of used equipment vary depending<br />
on customer buying preferences, exchange rate considerations and product availability.<br />
Rental revenues were down $14 million or 9% from 2008 reflecting lower utilization and lower rental rates in a competitive market.<br />
Power generation revenues from <strong>Toromont</strong>-owned plants increased 9% over the prior year, reflecting increased operating hours<br />
and higher average prices for electricity.<br />
80.6<br />
91.5<br />
108.7<br />
108.3
36 | TOROMONT <strong>2009</strong> ANNUAL REPORT<br />
compression group Revenue<br />
($ MiLLiONs)<br />
<strong>2009</strong><br />
2008<br />
2007<br />
2006<br />
2005<br />
671.0<br />
788.4<br />
758.3<br />
943.2<br />
1,022.0<br />
Equipment Group product support revenues were down $11 million or 4% from 2008 on lower parts and service. Product support<br />
revenues in <strong>2009</strong> benefited from higher parts pricing on the weaker Canadian dollar during the earlier part of the year. On a constant<br />
dollar basis, parts revenues were down 14%. Lower activity levels and economic uncertainty have led to reduced demand for maintenance<br />
and repair services.<br />
Operating income was down $23.2 million or 21% from 2008 on the 20% decrease in revenues. Gross margins were higher in <strong>2009</strong><br />
on a higher proportion of product support activities. Selling and administrative expenses were 11% lower in <strong>2009</strong> than in the prior year<br />
on lower compensation costs, bad debt expense and sales-related expenses in light of lower volume levels. Operating income was 9.7%<br />
of revenues, down slightly from the prior year.<br />
New equipment bookings for the year were down 29% in <strong>2009</strong> from the prior year due to year-over-year decreases seen in the first<br />
three quarters of <strong>2009</strong>. Bookings were lower across most industries, particularly heavy and general construction and mining.<br />
Backlogs at December 31, <strong>2009</strong> were down 24% year-over-year on lower bookings.<br />
Capital expenditures in the Equipment Group totalled $37.7 million in <strong>2009</strong> compared to $65.8 million in 2008. Capital expenditures<br />
have been reduced in light of the prevailing economic climate. Expenditures related to replacement and expansion of the rental fleet<br />
accounted for $27.2 million of total expenditures in <strong>2009</strong>.<br />
Results of Operations in the Compression Group<br />
compression group Operating income<br />
($ MiLLiONs)<br />
<strong>2009</strong> 96.9<br />
Years ended December 31 ($ thousands) <strong>2009</strong> 2008 % change<br />
Package sales and rentals<br />
Package sales $ 746,741 $ 792,856 (6%)<br />
Rentals 15,238 21,149 (28%)<br />
Total package sales and rentals 761,979 814,005 (6%)<br />
Product support 181,267 207,991 (13%)<br />
Total revenues $ 943,246 $ 1,021,996 (8%)<br />
Operating income $ 96,911 $ 99,182 (2%)<br />
Capital expenditures $ 23,335 $ 30,640 (24%)<br />
KEy RATiOs:<br />
Product support revenues as a % of total revenues 19.2% 20.4%<br />
Group total revenues as a % of consolidated revenues 51.7% 48.2%<br />
Operating income as a % of revenues 10.3% 9.7%<br />
2008<br />
2007<br />
2006<br />
2005<br />
The Compression Group delivered terrific revenues and operating income in <strong>2009</strong>, considering the economic slowdown, due to a large<br />
backlog entering the year.<br />
Package sales revenues were $46.1 million or 6% lower compared to 2008 on the following factors:<br />
n On average, the Canadian dollar was weaker in <strong>2009</strong>, resulting in an increase in package revenues on translation of foreign operations<br />
of $35 million.<br />
n U.S. natural gas compression revenues were flat to 2008 on a U.S. dollar basis, despite the fact that 2008 revenues included approximately<br />
$65 million related to large pipeline projects not repeated in <strong>2009</strong>.<br />
n Canadian natural gas compression revenues were down 40% from 2008 on continued weak market fundamentals.<br />
n Process systems revenues were up 2% on a constant dollar basis.<br />
n Package revenues from refrigeration systems were $25 million lower compared to the similar period of 2008, primarily on lower activity<br />
within industrial and U.S. recreational markets.<br />
Rental revenues were $5.9 million or 28% lower in <strong>2009</strong> than in the prior year. The decrease was due to lower utilization of the Canadian<br />
rental fleet on lower demand for compression equipment in light of weak natural gas pricing.<br />
Product support revenues were down $26.7 million or 13% in the year. Natural gas product support activities were down approximately<br />
29% in Canada and 14% in the U.S. on a constant dollar basis on lower market activity. Industrial refrigeration product support activities<br />
were even with levels reported in the prior year.<br />
Operating income for the Compression Group decreased 2% on the 8% reduction in revenues. Gross margins were up slightly over<br />
the prior year on better project execution and job mix. General and administrative expenses decreased 10% year-over-year with decreases<br />
driven by lower compensation and sales-related expenses in keeping with the current economic environment. Operating income increased<br />
to 10.3% of revenues for the year compared with 9.7% in 2008.<br />
56.9<br />
71.8<br />
73.8<br />
99.2
TOROMONT <strong>2009</strong> ANNUAL REPORT | 37<br />
Compression bookings in <strong>2009</strong> were down 48% from the record bookings seen in 2008. Natural gas compression bookings were down<br />
60%, with decreases in both the U.S. and Canada. Lower prices for natural gas have led to reductions in the capital spending by natural gas<br />
producers. Industrial and recreational bookings were up 10%, as gains in Canada were partially offset by lower activity in the United States.<br />
End-of-year backlogs were down 46% from December 31, 2008 on reduced bookings.<br />
Capital expenditures in the Compression Group totalled $23.3 million in <strong>2009</strong> compared to $30.6 million in 2008. Significant capital<br />
expenditures related to the expansion of manufacturing facilities in Casper, Wyoming.<br />
CONSOLIDATED FINANCIAL CONDITION<br />
The Company has maintained a strong financial position for many years. At December 31, <strong>2009</strong>, the ratio of total debt net of cash to equity was<br />
less than 0.01:1 compared to 0.05:1 in the prior year. The Company had significant cash balances at year-end which exceeded total debt. Total<br />
assets were $1.4 billion at December 31, <strong>2009</strong>, compared with $1.5 billion at the end of 2008.<br />
Working Capital<br />
The Company’s investment in non-cash working capital decreased to $332.3 million at December 31, <strong>2009</strong>. The major components, along<br />
with the changes from December 31, 2008, are identified in the following table.<br />
Years ended December 31 ($ thousands) <strong>2009</strong> 2008 $ change % change<br />
Accounts receivable $ 244,759 $ 375,059 $ (130,300) (35%)<br />
Inventories 373,110 499,360 (126,250) (25%)<br />
Future income tax assets 34,326 34,934 (608) (2%)<br />
Derivative financial instruments (874) 11,246 (12,120) n/m<br />
Other current assets 6,037 11,381 (5,344) (47%)<br />
Accounts payable and accrued liabilities (228,436) (337,073) 108,637 (32%)<br />
Dividends payable (9,728) (9,045) (683) 8%<br />
Deferred revenue (89,810) (194,261) 104,451 (54%)<br />
Current portion of long-term debt (14,044) (15,363) 1,319 (9%)<br />
Income taxes receivable, net 16,967 (4,236) 21,203 n/m<br />
Total non-cash working capital $ 332,307 $ 372,002 $ (39,695) (11%)<br />
n/m = not meaningful<br />
Accounts receivable were 35% lower than last year reflecting lower revenues in the fourth quarter of <strong>2009</strong>. Focused attention on collections<br />
has resulted in improvements in days sales outstanding in all businesses.<br />
Inventories were 25% lower than at December 31, 2008. Inventories in the majority of locations were lower due to focused efforts<br />
to reduce existing inventories.<br />
Future income tax assets reflect differences between income tax and accounting.<br />
Derivative financial instruments represent the fair value of foreign exchange contracts. Given the recent volatility in the Canadian/<br />
U.S. dollar exchange rate, the Company’s hedging practices have led to a cumulative net loss of $0.9 million as at December 31, <strong>2009</strong>.<br />
This is not expected to affect net income, as the unrealized loss will offset future gains on the related hedged items.<br />
Other current assets in 2008 included deposits made for equipment ordered for delivery through <strong>2009</strong>.<br />
Accounts payable and accrued liabilities were down 32% from 2008. Lower activity levels have reduced purchasing.<br />
Dividends payable were 8% higher than in 2008 reflecting the higher dividend rate of $0.15 per share compared to $0.14 per share<br />
a year ago.<br />
Deferred revenues represent receipts from customers in excess of revenue recognized. In the Compression Group, deferred revenues<br />
arise on progress billings received in advance of revenue recognition. Deferred revenues decreased 56% compared to December 2008<br />
as a result of lower activity. In the Equipment Group, deferred revenues arise on sales of equipment with residual value guarantees,<br />
extended warranty and other customer support agreements as well as on progress billings on long-term construction contracts. Equipment<br />
Group deferred revenues decreased 44% compared to December 2008 on lower sales with residual value guarantees and completion of<br />
several long-term industrial projects.<br />
Current portion of long-term debt reflects scheduled principal repayments due in 2010. This amount is lower as a result of the<br />
maturity of senior debentures in September 2008.<br />
Income taxes receivable reflects amounts owing for corporate income taxes less installments made to date. The amount in <strong>2009</strong> is<br />
a receivable as higher tax installments were made compared to income generated in the year.
38 | TOROMONT <strong>2009</strong> ANNUAL REPORT<br />
Goodwill<br />
The Company performs impairment tests on its goodwill balances on an annual basis or as warranted by events or circumstances. The<br />
assessment of goodwill entails estimating the fair value of operations to which the goodwill relates using the present value of expected<br />
discounted future cash flows. This assessment affirmed goodwill values as at December 31, <strong>2009</strong>.<br />
Employee Share Ownership<br />
The Company employs a variety of stock-based compensation plans to align employees’ interests with corporate objectives.<br />
The Company maintains an Executive Stock Option Plan for certain employees and directors. Stock options have a seven-year term, vest<br />
20% cumulatively on each anniversary date of the grant and are exercisable at the designated common share price. At December 31, <strong>2009</strong>,<br />
2.0 million options to purchase common shares were outstanding, of which 0.9 million were exercisable.<br />
The Company offers an Employee Share Ownership Plan whereby employees can purchase shares by way of payroll deductions. In<br />
2008, the Company enhanced this plan to provide a Company match on contributions at a rate of $1 for every $3 dollars contributed, to a<br />
maximum of $1,000 per annum per employee. Company contributions vest to the employee immediately. Company contributions amounting<br />
to $0.9 million in <strong>2009</strong> (2008 – $0.8 million) were charged to selling and administrative expense when paid. A third party administers the Plan.<br />
The Company also offers a deferred share unit (DSU) plan for executives and non-employee directors, whereby they may elect, on an<br />
annual basis, to receive all or a portion of their management incentive award or fees, respectively, in deferred share units. In addition, the<br />
Board may grant discretionary DSUs to executives. A DSU is a notional unit that reflects the market value of a single <strong>Toromont</strong> common<br />
share and generally vests immediately. DSUs will be redeemed on termination of employment or resignation from the Board, as the case<br />
may be. As at December 31, <strong>2009</strong>, 68,723 units were outstanding at a value of $1,882 (2008 – 79,476 units at a value of $1,671). The<br />
Company records the cost of the DSU Plan as compensation expense. During <strong>2009</strong>, 47,086 units were redeemed for $1,098 (2008 – Nil).<br />
Employee Future Benefits<br />
The Company sponsors pension arrangements for substantially all of its employees, primarily through defined contribution plans in Canada<br />
and a 401(k) matched savings plan in the United States. Certain unionized employees do not participate in Company-sponsored plans,<br />
and contributions are made to these union-sponsored plans in accordance with respective collective bargaining agreements. In the case<br />
of the defined contribution plans, regular contributions are made to the employees’ individual accounts, which are administered by a plan<br />
trustee, in accordance with the plan document. Future expense for these plans will vary based on future participation rates.<br />
Approximately 5% of active employees participate in one of two defined benefit plans:<br />
n Powell Plan – Consists of personnel of Powell Equipment (acquired by <strong>Toromont</strong> in 2001); and<br />
n Other plan assets and obligations – Provides for certain retirees and terminated vested employees of businesses previously acquired<br />
by the Company as well as for retired participants of the defined contribution plan who, in accordance with the plan provisions, have<br />
elected to receive a pension directly from the plan.<br />
Financial markets improved in <strong>2009</strong> after a significant downturn in 2008. This resulted in a gain on opening plan assets of $5.5 million or 13%.<br />
The funded status of the plans has declined from zero to a deficit of $0.4 million. The unrecognized actuarial loss at December 31, <strong>2009</strong>,<br />
was $12.4 million, unchanged from the prior year. Pension plan accounting requires gains and losses to be effectively smoothed over<br />
future periods, beginning in the following period. The Company expects pension expense and cash pension contributions to be similar<br />
to <strong>2009</strong> levels, before consideration of the acquisition of Enerflex.<br />
The Company also has a pension arrangement for certain senior executives that provides for a supplementary retirement payout<br />
in excess of amounts provided for under the registered plan. This “Executive Plan” is a non-contributory pension arrangement and is<br />
solely the obligation of the Company. The Company is not obligated to fund this plan but is obligated to pay benefits under the terms of<br />
the plan as they come due. The Company has posted letters of credit to secure the obligations under this plan, which were $19.9 million<br />
as at December 31, <strong>2009</strong>. As there are only nominal plan assets, the impact of volatility in financial markets on pension expense and<br />
contributions for this plan are insignificant.<br />
The Company estimates a long-term return on plan assets of 7%. While there is no assurance that the plan will be able to generate<br />
this assumed rate of return each year, management believes that it is a reasonable longer-term estimate.<br />
A key assumption in pension accounting is the discount rate. The standard requires that this rate is set with regard to the yield<br />
on high-quality corporate bonds of similar average duration to the cash flow liabilities of the Plans. Yields are volatile and can deviate<br />
significantly from period to period.<br />
Off-Balance Sheet Arrangements<br />
The Company does not have any off-balance sheet arrangements that have, or are reasonably likely to have, a current or future effect<br />
on its results of operations or financial condition.
capital structure<br />
($ MiLLiONs)<br />
<strong>2009</strong><br />
2008<br />
2007<br />
2006<br />
2005<br />
854.1<br />
779.1<br />
654.7<br />
565.6<br />
481.8<br />
(48.9)<br />
36.2<br />
126.8<br />
205.6<br />
203.4<br />
shareholders’ equity<br />
debt, net of cash<br />
TOROMONT <strong>2009</strong> ANNUAL REPORT | 39<br />
Legal and Other Contingencies<br />
Due to the size, complexity and nature of the Company’s operations, various legal matters are pending. Exposure to these claims is<br />
mitigated through levels of insurance coverage considered appropriate by management and by active management of these matters.<br />
In the opinion of management, none of these matters will have a material effect on the Company’s consolidated financial position or<br />
results of operations.<br />
Normal Course Issuer Bid<br />
<strong>Toromont</strong> believes that, from time to time, the purchase of its common shares at prevailing market prices may be a worthwhile investment<br />
and in the best interests of both <strong>Toromont</strong> and its shareholders. As such, the normal course issuer bid with the Toronto Stock Exchange<br />
was renewed in <strong>2009</strong>. This issuer bid allows the Company to purchase up to approximately 4.7 million of its common shares, representing<br />
10% of common shares in the public float, in the year ending August 30, 2010. The actual number of shares purchased and the timing of<br />
any such purchases will be determined by <strong>Toromont</strong>. All shares purchased under the bid will be cancelled.<br />
The Company purchased and cancelled 43,400 shares for $0.9 million (average cost of $19.77 per share) in <strong>2009</strong>. The shares were<br />
purchased for an amount higher than their weighted average book value per share ($1.97 per share) resulting in a reduction of retained<br />
earnings of $772. In 2008, the Company purchased and cancelled 595,600 shares for $12.8 million (average cost of $21.50 per share),<br />
resulting in a reduction of retained earnings of $11.7 million.<br />
Outstanding Share Data<br />
On January 22, 2010, <strong>Toromont</strong> issued 11,362,031 common shares pursuant to purchase of tendered units of Enerflex. As at the date<br />
of this MD&A, the Company had 76,296,981 common shares and 1,893,389 share options outstanding.<br />
The Company will issue approximately 515,300 additional common shares as partial consideration for the purchase of the remaining<br />
units of Enerflex on February 26, 2010.<br />
Dividends<br />
<strong>Toromont</strong> pays a quarterly dividend on its outstanding common shares and has historically targeted a dividend rate that approximates 30%<br />
of trailing earnings from continuing operations. This practice is reviewed from time-to-time, based upon and subject to the Company’s<br />
earnings, financial requirements and general economic circumstances. During <strong>2009</strong>, the Company declared dividends of $0.60 per common<br />
share ($0.56 per common share in 2008).<br />
LIQUIDITY AND CAPITAL RESOURCES<br />
Sources of Liquidity<br />
<strong>Toromont</strong>’s liquidity requirements can be met through a variety of sources, including cash generated from operations, long- and shortterm<br />
borrowings and the issuance of common shares. Borrowings are obtained through a variety of senior debentures, notes payable<br />
and committed long-term credit facilities.<br />
At December 31, <strong>2009</strong>, $156.0 million or 99% of long-term debt carried interest at fixed rates. This debt matures at various dates<br />
through to 2019 with a current weighted average interest rate of 5.3%. The remaining $2.1 million or 1% of long-term debt carried<br />
interest at a variable rate of 0.14% with maturities in 2010.<br />
Combined unsecured credit facilities amounted to $246 million at year-end comprised of $225 million in Canada and U.S. $20 million<br />
in the United States ($21 million Canadian equivalent). Of these combined credit facilities, U.S. $20 million matures in 2010 and the<br />
balance matures in 2011. At December 31, <strong>2009</strong>, there were no drawings against these credit facilities. Letters of credit in the amount<br />
of $33 million were issued against the credit facilities.<br />
<strong>Toromont</strong> secured a term loan facility in January 2010 in connection with the acquisition of Enerflex. Borrowings of up to $450 million<br />
are available to <strong>Toromont</strong> under this facility, with draw downs to occur by July 2010. As at February 5, 2010, $313.8 million was drawn under<br />
this facility. Debt incurred under this facility is unsecured and ranks equally with debt incurred under <strong>Toromont</strong>’s existing credit facility and<br />
debentures. This facility is subject to fees at levels customary for credit facilities of this type. Outstanding loans under this facility bear<br />
interest at a rate equal to the Canadian prime rate plus a specified margin ranging from 175 to 300 basis points. Alternatively, <strong>Toromont</strong><br />
may utilize this facility through the issuance of bankers’ acceptances with acceptance fees ranging from 275 to 400 basis points. The<br />
applicable margin or acceptance fee will, in each case, be determined based on <strong>Toromont</strong>’s leverage ratio. This facility matures in July 2011.<br />
Amounts outstanding from time to time must be repaid on the basis of 15% per annum, payable in equal quarterly installments. Subject<br />
to certain exceptions, this facility also provides that the net proceeds of any new debt issued by <strong>Toromont</strong> during the term of the Credit<br />
Facility must be used to repay any amounts outstanding under this facility. This facility includes covenants, restrictions and events of<br />
default that are substantially the same as the corresponding provisions in <strong>Toromont</strong>’s existing credit facility.<br />
The Company expects that continued cash flows from operations in 2010, cash and cash equivalents on hand and currently available<br />
credit facilities will be more than sufficient to fund requirements for investments in working capital and capital assets.
40 | TOROMONT <strong>2009</strong> ANNUAL REPORT<br />
capital Expenditures<br />
($ MiLLiONs)<br />
<strong>2009</strong><br />
2008<br />
2007<br />
2006<br />
2005<br />
Principal Components of Cash Flow<br />
Cash from operating, investing and financing activities, as reflected in the Consolidated Statements of Cash Flows, are summarized<br />
in the following table:<br />
Years ended December 31 ($ thousands) <strong>2009</strong> 2008<br />
Cash, beginning of year<br />
Cash, provided by (used in):<br />
$ 137,274 $ 103,514<br />
Operations 176,945 174,862<br />
Change in non-cash working capital and other 19,308 (10,150)<br />
Operating activities 196,253 164,712<br />
Investing activities (73,904) (31,940)<br />
Financing activities (51,014) (101,255)<br />
Increase in cash in the year 71,335 31,517<br />
Effect of foreign exchange on cash balances (1,652) 2,243<br />
Cash, end of year $ 206,957 $ 137,274<br />
Cash Flows from Operating Activities<br />
Operating activities provided $196.3 million in the year compared to $164.7 million in 2008. Net earnings adjusted for items not requiring cash<br />
were up 1%. Non-cash working capital and other provided $19.3 million in <strong>2009</strong> compared to using $10.1 million in 2008. The components and<br />
changes in working capital are discussed in more detail in this MD&A under the heading “Consolidated Financial Condition.”<br />
Cash Flows from Investing Activities<br />
Investing activities used $73.9 million in the year compared to $31.9 million in 2008.<br />
During <strong>2009</strong>, <strong>Toromont</strong> purchased 3.9 million trust units of Enerflex at a cost of $37.8 million ($9.69 per unit).<br />
In 2008, <strong>Toromont</strong> realized a net cash inflow of $30.1 million from sale of investments.<br />
Net additions to the rental fleet (additions less proceeds on disposal) in <strong>2009</strong> were $9.6 million compared to $27.4 million in 2008.<br />
Additions to the rental fleet have been curtailed in light of the current economic environment.<br />
Gross investment in property, plant and equipment was $21.3 million, $17.2 million lower than in the prior year. Significant<br />
investments in <strong>2009</strong> included the following:<br />
n $5.7 million for completion of the expansion of the compression facilities in Northern U.S. Operations, including Casper, Wyoming;<br />
n $1.6 million to complete expansion of the compression facilities in Houston, Texas;<br />
n $4.7 million for additions to the service vehicle fleet, primarily for the Equipment Group;<br />
n $5.8 million for facilities renovations and expansion in the Equipment Group; and<br />
n $1.9 million for computer technology upgrades.<br />
Additions in 2008 included significant spending for expansion of the compression facilities in Casper, Wyoming.<br />
In 2008, Aero Tech Manufacturing, a wholly owned subsidiary, was sold for proceeds of $4.0 million.<br />
Cash Flows from Financing Activities<br />
Financing activities used $51.0 million in <strong>2009</strong> compared to $101.3 million in 2008. The significant financing activities and changes from<br />
the prior year were as follows:<br />
n Long-term debt decreased $15.4 million in <strong>2009</strong> due to scheduled debt repayments. In 2008, long-term debt decreased $56.8 million.<br />
n Dividends paid to common shareholders in <strong>2009</strong> totalled $38.2 million, an increase of 9% over 2008 reflecting the higher dividend rate.<br />
n Purchases under the normal course issuer bid used $0.9 million in <strong>2009</strong> compared to $12.8 million in 2008.<br />
n Cash received on exercise of share options totalled $3.4 million compared to $3.5 million in 2008. The number of stock options exercised<br />
was generally consistent with the prior year.<br />
21.3<br />
38.6<br />
26.4<br />
35.9<br />
20.5<br />
39.7<br />
57.9<br />
70.7<br />
66.5<br />
52.3<br />
Property, plant and equipment<br />
Rental fleet additions<br />
OUTLOOK<br />
<strong>Toromont</strong> has a history of performance at a high level for all stakeholders, resulting from consistent application of long-term strategies,<br />
a proven business model and a focus on asset management and progressive, profitable improvement. <strong>Toromont</strong> is well positioned in each<br />
of its diverse markets and both business segments have good growth prospects over the longer term.<br />
In January 2010, Enerflex was substantially acquired through the take-up of 96% of its units, with the remaining units expected to be<br />
acquired in late February 2010. The process of merging Enerflex with <strong>Toromont</strong> Energy Systems is well under way. The newly merged<br />
business, Enerflex <strong>Ltd</strong>., is a well capitalized global leader in the compression market, built on the complementary strengths of its predecessor<br />
organizations. A strong leadership team is in place and the prospects for this business are excellent and will become more evident when<br />
the demand for compression equipment picks up.
TOROMONT <strong>2009</strong> ANNUAL REPORT | 41<br />
The global economy is in recession, the duration of which is impossible to predict. This will present challenges. Fortunately, <strong>2009</strong><br />
started with significant backlogs that cushioned the impact through the first half of the year.<br />
Our Equipment Group is experiencing reduced bookings related to the general economic slowdown. Certain markets continue to<br />
perform well including road building, power systems and precious metals mining and the announced stimulus spending for Canadian<br />
infrastructure looks positive. The parts and service business provides a measure of stability, driven by the larger installed base of<br />
equipment in the field.<br />
Our Compression Group is also experiencing reduced bookings related to the global economic slowdown and on weak natural<br />
gas markets. The Company believes that the long term market fundamentals for natural gas in both Canada and the U.S. are positive.<br />
Process and international markets also provide opportunity. Canadian refrigeration markets have held up well, and the Canadian<br />
governmental spending stimulus contains monies designated for recreational refrigeration projects.<br />
Our management teams have been adjusting to these conditions. Areas of focus include headcount adjustments, asset<br />
management, discretionary spending reductions and limiting capital investment.<br />
Although we reported improved bookings in the fourth quarter of <strong>2009</strong>, it is uncertain whether this improvement is sustainable in<br />
nature. We do not expect a meaningful recovery in our businesses in 2010.<br />
CONTRACTUAL OBLIGATIONS<br />
Contractual obligations are set out in the following table. Management believes that these obligations will be met comfortably through<br />
cash on hand, cash generated from operations and existing short- and long-term financing facilities.<br />
Payments due by Period<br />
Long-term debt<br />
2010 2011 2012 2013 2014 Thereafter Total<br />
– principal $ 14,044 $ 6,889 $ 1,280 $ 1,372 $ 1,471 $ 133,039 $ 158,095<br />
– interest 8,137 7,266 6,986 6,895 6,796 7,635 43,715<br />
Operating leases 4,188 3,423 2,492 1,942 1,423 3,881 17,349<br />
Total $ 26,369 $ 17,578 $ 10,758 $ 10,209 $ 9,690 $ 144,555 $ 219,159<br />
<strong>Toromont</strong> secured a term loan facility in January 2010 in connection with the acquisition of Enerflex. As at February 5, 2010, $313.8<br />
million was drawn under this facility. This debt is not included within the above contractual obligations table. For further details as to this<br />
facility, including its repayment terms, see “Liquidity and Capital Resources – Sources of Liquidity”.<br />
KEY PERFORMANCE MEASURES<br />
Management reviews and monitors its activities and the performance indicators it believes are critical to measuring success. Some of<br />
the key financial performance measures are summarized in the following table. Others include, but are not limited to, measures such as<br />
market share, fleet utilization, customer and employee satisfaction and employee health and safety.<br />
Years ended December 31 <strong>2009</strong> 2008 2007 2006 2005<br />
ExPANdiNg MARKETs ANd<br />
BROAdENiNg PROdUcT OffERiNgs<br />
Revenue growth (14.0%) 12.4% 8.1% 10.2% 12.0%<br />
Revenue generated outside North America (millions) $ 87.9 $ 69.0 $ 75.6 $ 80.8 $ 70.0<br />
Revenues, Equipment Group to Compression Group 48:52 52:48 58:42 56:44 57:43<br />
sTRENgThENiNg PROdUcT sUPPORT<br />
Product support revenue growth (7.7%) 5.5% 6.3% 9.2% 15.8%<br />
iNvEsTiNg iN OUR REsOURcEs<br />
Revenue per employee (thousands) $ 422 $ 463 $ 431 $ 407 $ 392<br />
Investment in information technology (millions) $ 15.3 $ 14.9 $ 13.6 $ 12.7 $ 13.2<br />
Return on capital employed 21.1% 26.4% 24.7% 22.7% 17.8%<br />
sTRONg fiNANciAL POsiTiON<br />
Working capital (millions) $ 539 $ 509 $ 467 $ 470 $ 411<br />
Total debt, net of cash to equity ratio n/m .05:1 .19:1 .36:1 .42:1<br />
Book value (shareholders’ equity) per share $ 13.17 $ 12.06 $ 10.08 $ 8.79 $ 7.57<br />
BUiLd shAREhOLdER vALUE<br />
Basic earnings per share growth (13.9%) 14.3% 21.2% 24.8% 12.6%<br />
Dividends per share growth 7.1% 16.7% 20.0% 25.0% 23.1%<br />
Return on equity 15.5% 21.5% 21.6% 20.6% 18.9%<br />
n/m = not meaningful
42 | TOROMONT <strong>2009</strong> ANNUAL REPORT<br />
While the global recession of <strong>2009</strong> has interrupted the steady string of growth across key performance measures, profitability endured and<br />
the balance sheet continued to strengthen. This has been discussed at length throughout this MD&A.<br />
Measuring <strong>Toromont</strong>’s results against these strategies over the past five years illustrates that the Company has made significant progress.<br />
Since 2005, revenues increased at an average annual rate of 5.7%. Product support revenue growth has averaged 5.8% annually.<br />
Revenue growth in continuing operations has been a result of:<br />
n Significant expansion of compression operations in the United States;<br />
n Additional product offerings over the years from Caterpillar and other suppliers;<br />
n Organic growth through increased fleet size and additional branches;<br />
n Increased customer demand for formal product support agreements; and<br />
n Acquisitions, primarily within the Equipment Group’s rental operations.<br />
Over the same five-year period, revenue growth has been constrained at times by a number of factors including:<br />
n General economic weakness, which has negatively impacted revenues since the latter part of 2008;<br />
n Declines in underlying market conditions such as depressed natural gas prices in Canada;<br />
n Inability to source equipment from suppliers to meet customer demand or delivery schedules; and<br />
n Lack of skilled workers such as mechanics and journeymen resulting in service revenue and efficiency impacts.<br />
Changes in the Canadian/U.S. exchange rate impacts reported revenues in two ways. First the exchange rate impacts on the translation<br />
of results from foreign subsidiaries. Second the exchange rate impacts on the purchase price of equipment that in turn is reflected in<br />
selling prices.<br />
Over the past two years, the Company’s revenue base has been further diversified and in <strong>2009</strong> was fairly evenly split between<br />
Compression and Equipment Groups. The underlying diversification – by industrial market, by type of product/service provided and<br />
by customer provides a certain amount of balance in a cyclical environment.<br />
Revenues generated outside North America have remained relatively consistent from year to year although do vary in terms of<br />
customer and end market. While an important component of the Company’s diversification strategy, operating internationally poses<br />
challenges and as such, international revenue will continue to be generated in a prudent and measured manner.<br />
<strong>Toromont</strong> has generated significant competitive advantage over the past years by investing in its resources, in part to increase<br />
productivity levels. Revenue per employee has increased 8% since 2005.<br />
<strong>Toromont</strong> continues to maintain a strong balance sheet. In <strong>2009</strong>, book value (shareholders’ equity) per share increased 9% over the<br />
prior year on strong earnings. Leverage, as represented by the ratio of total debt, net of cash, to shareholders’ equity, also improved over<br />
the prior year.<br />
<strong>Toromont</strong> has a history of progressive earnings per share growth. This trend was not continued in <strong>2009</strong> due to the weak economic<br />
environment, which reduced revenues.<br />
<strong>Toromont</strong> has paid dividends consistently since 1968, and has increased the dividend in each of the last 20 years.<br />
CONSOLIDATED RESULTS OF OPERATIONS FOR THE FOURTH QUARTER <strong>2009</strong><br />
Three months ended December 31 ($ thousands, except per share amounts) <strong>2009</strong> 2008 % change<br />
REvENUEs $ 452,838 $ 609,704 (26%)<br />
Cost of goods sold 352,485 468,447 (25%)<br />
Gross profit 100,353 141,257 (29%)<br />
Selling and administrative expenses 54,532 66,784 (18%)<br />
OPERATiNg iNcOME 45,821 74,473 (38%)<br />
Interest expense 2,450 2,747 (11%)<br />
Interest and investment income (2,913) (1,881) 55%<br />
Income before income taxes 46,284 73,607 (37%)<br />
Income taxes 14,934 24,497 (39%)<br />
NET EARNiNgs $ 31,350 $ 49,110 (36%)<br />
BAsic EARNiNgs PER shARE $ 0.48 $ 0.76 (37%)<br />
KEy RATiOs:<br />
Gross profit as a % of revenues 22.2% 23.2%<br />
Selling and administrative expenses as a % of revenues 12.0% 11.0%<br />
Operating income as a % of revenues 10.1% 12.2%<br />
Income taxes as a % of income before income taxes 32.3% 33.3%
TOROMONT <strong>2009</strong> ANNUAL REPORT | 43<br />
The Canadian dollar was 14% stronger on average for the fourth quarter of <strong>2009</strong> compared to the similar period last year. The impact on<br />
revenues and net income on translation of foreign subsidiaries, all reported in the Compression Group, were decreases of $21 million and<br />
$2 million respectively.<br />
Revenues were 26% lower in the fourth quarter of <strong>2009</strong> compared to the same period last year. Decreases were reported in both<br />
Compression and Equipment.<br />
Gross profit decreased 29% in the fourth quarter over last year on the lower sales volumes and lower gross margins. Gross profit<br />
margin was 22.2% in <strong>2009</strong>, down from 23.2% in 2008. Lower margins were reported in the Equipment Group on lower volumes, partially<br />
offset by a sales mix shift to a higher proportion of product support business. The Compression Group reported higher margins on<br />
improved project execution and sales mix.<br />
Selling and administrative expenses decreased $12.3 million or 18% versus the comparable period of the prior year. Bad debt<br />
expense decreased $5.4 million reflecting strong collections activity in the quarter and on improved aging of accounts receivable.<br />
Compensation was lower in the fourth quarter on reduced staffing levels and lower profit sharing on lower net earnings. Other expenses<br />
were lower on strong cost control initiatives implemented throughout the year in light of economic conditions.<br />
Interest expense was lower in the quarter compared to the similar period last year on lower average debt balances.<br />
Interest income was higher in the fourth quarter of <strong>2009</strong> as distributions received on investment in Enerflex trust units were partially<br />
offset by lower interest rates on treasury investments.<br />
The effective income tax rate was 32.3% compared to 33.3% in the fourth quarter of 2008 reflecting lower statutory income tax rates.<br />
Net earnings in the quarter were $31.4 million, down 36% from 2008. Basic earnings per share were $0.48 compared with $0.76<br />
in 2008, a decrease of 37%.<br />
Comprehensive income was $43.1 million, comprised of net earnings of $31.4 million and other comprehensive income of $11.7 million.<br />
Other comprehensive income arose primarily on unrealized gains on the Company’s investment in Enerflex trust units which were designated<br />
as available for sale.<br />
Fourth Quarter Results of Operations in the Equipment Group<br />
Three months ended December 31 ($ thousands) <strong>2009</strong> 2008 % change<br />
Equipment sales and rentals<br />
New $ 99,632 $ 133,746 (26%)<br />
Used 32,492 49,391 (34%)<br />
Rental 38,065 43,790 (13%)<br />
Total equipment sales and rentals 170,189 226,927 (25%)<br />
Power generation 2,482 2,117 17%<br />
Product support 66,338 74,860 (11%)<br />
Total revenues $ 239,009 $ 303,904 (21%)<br />
Operating income $ 19,558 $ 39,399 (50%)<br />
KEy RATiOs:<br />
Product support revenues as a % of total revenues 27.8% 24.6%<br />
Group total revenues as a % of consolidated revenues 52.8% 49.8%<br />
Operating income as a % of revenues 8.2% 13.0%<br />
New equipment sales were 26% lower on a decline in new tractor unit deliveries. In the fourth quarter of <strong>2009</strong>, the global economic<br />
uncertainty resulted in fewer year-end purchases and rental conversions.<br />
Used equipment sales were down 34% versus the comparable period of 2008 due to general economic conditions. Used equipment<br />
sales are dependent on a variety of factors and will fluctuate from quarter to quarter.<br />
Rental revenues were down 13% in the quarter compared to the prior year on lower fleet utilization and rental rates in a competitive market.<br />
Product support revenues were down 11% compared to the prior year on lower activity levels.<br />
Operating income was down 50% over last year on lower revenues and lower gross margins. Gross margins decreased due to reduced<br />
price realization on parts and equipment, partially offset by a higher proportion of product support, which carries relatively higher margins<br />
than equipment sales. Selling and administrative expenses declined 15% largely driven by lower staffing levels and lower bad debt expense.<br />
Operating income as a percentage of revenues was 8.2% compared to 13.0% in the fourth quarter of 2008.<br />
Bookings in the fourth quarter were 25% higher than the comparable period last year on improved activity levels in certain sectors<br />
including commercial, mining and road building. Also, bookings in 2008 were negatively impacted by order cancellations.
44 | TOROMONT <strong>2009</strong> ANNUAL REPORT<br />
Fourth Quarter Results of Operations in the Compression Group<br />
Three months ended December 31 ($ thousands) <strong>2009</strong> 2008 % change<br />
Package sales and rentals<br />
Package sales $ 166,200 $ 244,666 (32%)<br />
Rentals 3,322 4,972 (33%)<br />
Total package sales and rentals 169,522 249,638 (32%)<br />
Product support 44,307 56,162 (21%)<br />
Total revenues $ 213,829 $ 305,800 (30%)<br />
Operating income $ 26,263 $ 35,074 (25%)<br />
KEy RATiOs:<br />
Product support revenues as a % of total revenues 20.7% 18.4%<br />
Group total revenues as a % of consolidated revenues 47.2% 50.2%<br />
Operating income as a % of revenues 12.3% 11.5%<br />
Revenues in the Compression Group for the fourth quarter of <strong>2009</strong> were down $92.0 million or 30% from the similar period last year on<br />
the following factors:<br />
n On average, the Canadian dollar was stronger in the fourth quarter of <strong>2009</strong>, resulting in a decrease in revenues on translation of foreign<br />
operations of $21 million.<br />
n Natural gas package sales were down 27% on a constant dollar basis, on lower activity levels.<br />
n Process compression systems were down 37% in the quarter, however were up slightly for the full year. Process system sales depend<br />
on timing of customer orders and requirements.<br />
n Refrigeration revenues for the quarter were 18% lower on weaker industrial and U.S. recreational activity, resulting largely from the weak<br />
economy. Canadian recreational revenues were 10% higher with increased activity levels, especially with the ECO CHILL product line.<br />
n Natural gas product support revenues were 33% lower than the comparable period last year on lower activity in both Canada and the<br />
United States.<br />
n Refrigeration product support revenues were consistent with prior year as increased activity in Canada was largely offset by lower<br />
activity in the United States.<br />
Operating income was 25% lower in the fourth quarter of <strong>2009</strong> compared to the similar period last year on lower volume, partially offset<br />
by higher margins. Gross margin was higher in <strong>2009</strong> compared to 2008 on product mix and project execution. Selling and administrative<br />
expenses were down 23% from the prior year due to lower compensation on reduced headcount and lower bad debt expense.<br />
Bookings in the fourth quarter were up 46% from the prior year with several good orders received late in <strong>2009</strong>. Bookings in 2008<br />
were depressed and included order cancellations from customers in light of economic conditions.<br />
QUARTERLY RESULTS<br />
The following table summarizes unaudited quarterly consolidated financial data for the eight most recently completed quarters. This quarterly<br />
information is unaudited but has been prepared on the same basis as the <strong>2009</strong> annual audited consolidated financial statements.<br />
($ thousands, except per share amounts) Q1 Q2 Q3 Q4<br />
<strong>2009</strong><br />
Revenues<br />
Equipment Group $ 191,693 $ 217,015 $ 233,629 $ 239,009<br />
Compression Group 265,966 267,158 196,293 213,829<br />
Total revenues $ 457,659 $ 484,173 $ 429,922 $ 452,838<br />
Net earnings $ 23,718 $ 33,525 $ 31,923 $ 31,350<br />
Per share information:<br />
Basic earnings per share $ 0.37 $ 0.51 $ 0.50 $ 0.48<br />
Diluted earnings per share $ 0.37 $ 0.51 $ 0.50 $ 0.48<br />
Dividends per share $ 0.15 $ 0.15 $ 0.15 $ 0.15
TOROMONT <strong>2009</strong> ANNUAL REPORT | 45<br />
($ thousands, except per share amounts) Q1 Q2 Q3 Q4<br />
2008<br />
Revenues<br />
Equipment Group $ 202,023 $ 285,845 $ 307,441 $ 303,904<br />
Compression Group 195,036 250,632 270,528 305,800<br />
Total revenues $ 397,059 $ 536,477 $ 577,969 $ 609,704<br />
Net earnings<br />
Continuing operations $ 16,417 $ 38,222 $ 37,104 $ 49,110<br />
Discontinued operations 77 (406) – –<br />
$ 16,494 $ 37,816 $ 37,104 $ 49,110<br />
Per share information:<br />
Basic earnings per share<br />
Continuing operations $ 0.25 $ 0.59 $ 0.57 $ 0.76<br />
Discontinued operations – (0.01) – –<br />
$ 0.25 $ 0.58 $ 0.57 $ 0.76<br />
Diluted earnings per share<br />
Continuing operations $ 0.25 $ 0.59 $ 0.56 $ 0.76<br />
Discontinued operations – (0.01) – –<br />
$ 0.25 $ 0.58 $ 0.56 $ 0.76<br />
Dividends per share $ 0.14 $ 0.14 $ 0.14 $ 0.14<br />
Interim period revenues and earnings historically reflect some seasonality.<br />
The Equipment Group has historically had a distinct seasonal trend in activity levels. Lower revenues are recorded during the<br />
first quarter due to winter shutdowns in the construction industry. The fourth quarter has typically been the strongest quarter due in<br />
part to the timing of customers’ capital investment decisions, delivery of equipment from suppliers for customer-specific orders and<br />
conversions of equipment on rent with a purchase option. This trend has not been evident in the last two years due to the slowdown<br />
in the Canadian economy. Management expects the trend to continue as economic conditions improve.<br />
The Compression Group also has historically had a distinct seasonal trend in activity levels due to well-site access and drilling<br />
patterns, which reflect weather conditions. Generally, higher revenues are reported in the fourth quarter of each year. This trend has<br />
not been evident in the last two years due to deteriorating natural gas markets and general economic conditions. Geographic and<br />
product mix diversification has also served to mitigate this seasonality. Management expects this trend to continue as natural gas<br />
market fundamentals improve.<br />
As a result of the historical seasonal sales trends, inventories increase through the year in order to meet the expected demand<br />
for delivery in the fourth quarter of the fiscal year, while accounts receivable are highest at year end.<br />
SELECTED ANNUAL INFORMATION<br />
($ thousands, except per share amounts) <strong>2009</strong> 2008 2007<br />
Revenues $ 1,824,592 $ 2,121,209 $ 1,886,761<br />
Net earnings – continuing operations $ 120,516 $ 140,853 $ 121,868<br />
Net earnings $ 120,516 $ 140,524 $ 122,280<br />
Earnings per share – continuing operations<br />
Basic $ 1.86 $ 2.17 $ 1.88<br />
Diluted $ 1.86 $ 2.16 $ 1.87<br />
Earnings per share<br />
Basic $ 1.86 $ 2.16 $ 1.89<br />
Diluted $ 1.86 $ 2.15 $ 1.88<br />
Dividends declared per share $ 0.60 $ 0.56 $ 0.48<br />
Total assets $ 1,364,667 $ 1,533,450 $ 1,356,861<br />
Total long-term debt $ 158,095 $ 173,475 $ 230,299
46 | TOROMONT <strong>2009</strong> ANNUAL REPORT<br />
Revenue growth was strong through 2008 with year-over-year increases of 8% and 12% in 2007 and 2008 respectively. The global<br />
economic crisis of late 2008 and <strong>2009</strong> has served to reduce revenues in <strong>2009</strong> as activity levels in end markets has slowed.<br />
Growth in net earnings on a continuing operations basis was strong through 2008, with year-over-year increases of 23% and 16% in<br />
2007 and 2008 respectively. Net earnings declined 14% in <strong>2009</strong> on lower revenues. Net earnings in 2007 and 2008 also included gains on<br />
sales of assets.<br />
Earnings per share have generally varied in line with earnings. The number of common shares outstanding over the last three years<br />
has remained fairly consistent as new shares issued on exercise of stock options have been largely offset by purchases under the normal<br />
course issuer bid.<br />
Dividends have generally increased in proportion to trailing earnings growth.<br />
Total assets have decreased in <strong>2009</strong> as inventories were reduced in light of lower activity levels. Accounts receivable have also<br />
decreased due to lower revenues.<br />
Long-term debt decreased in <strong>2009</strong> and represented 19% of total shareholders’ equity at year end. In 2008, long-term debt represented<br />
22% of shareholders’ equity. At December 31, <strong>2009</strong>, total cash exceeded total long-term debt.<br />
RISKS AND RISK MANAGEMENT<br />
In the normal course of business, <strong>Toromont</strong> is exposed to risks that may potentially impact its financial results in either or both of its<br />
business segments. The Company and each operating segment employ risk management strategies with a view to mitigating these risks<br />
on a cost-effective basis.<br />
Business Cycle<br />
Expenditures on capital goods have historically been cyclical, reflecting a variety of factors including interest rates, foreign exchange<br />
rates, consumer and business confidence, commodity prices, corporate profits, credit conditions and the availability of capital to finance<br />
purchases. <strong>Toromont</strong>’s customers are typically affected, to varying degrees, by these factors and trends in the general business cycle<br />
within their respective markets. As a result, <strong>Toromont</strong>’s financial performance is affected by the impact of such business cycles on the<br />
Company’s customer base.<br />
Commodity prices, and, in particular, changes in the view on long-term trends, affect demand for the Company’s products and services<br />
in both operating segments. Commodity price movements in the natural gas and base metals sectors in particular can have an impact on<br />
customers’ demands for equipment and customer service. With lower commodity prices, demand is reduced as development of new projects<br />
is often stopped and existing projects can be curtailed, both leading to less demand for heavy equipment and compression packages.<br />
<strong>Toromont</strong>’s business is diversified across a wide range of industry market segments and geographic territories, serving to temper the<br />
effects of business cycles on consolidated results. Continued diversification strategies such as expanding the Company’s customer base,<br />
broadening product offerings and geographic diversification are designed to moderate business cycle impacts. Across both operating<br />
segments, the Company has focused on the sale of specialized equipment and ongoing support through parts distribution and skilled service.<br />
Product support growth has been, and will continue to be, fundamental to the mitigation of downturns in the business cycle. The product<br />
support business contributes significantly higher profit margins and is typically subject to less volatility than equipment supply activities.<br />
Product and Supply<br />
Equipment Group<br />
The Equipment Group purchases most of its equipment inventories and parts from Caterpillar under a dealership agreement that dates<br />
back to 1993. As is customary in distribution arrangements of this type, the agreement with Caterpillar can be terminated by either party<br />
upon 90 days’ notice. In the event Caterpillar terminates, it must repurchase substantially all inventories of new equipment and parts at cost.<br />
<strong>Toromont</strong> has maintained an excellent relationship with Caterpillar for 16 years and management expects this will continue going forward.<br />
<strong>Toromont</strong> is dependent on the continued market acceptance of Caterpillar’s products. It is believed that Caterpillar has a solid<br />
reputation as a high-quality manufacturer, with excellent brand recognition and customer support as well as leading market shares in many<br />
of the markets it serves. However, there can be no assurance that Caterpillar will be able to maintain its reputation and market position<br />
in the future. Any resulting decrease in the demand for Caterpillar products could have a material adverse impact on the Company’s<br />
business, results of operations and future prospects.<br />
<strong>Toromont</strong> is also dependent on Caterpillar for timely supply of equipment and parts. From time to time during periods of intense<br />
demand, Caterpillar may find it necessary to allocate its supply of particular products among its dealers. Such allocations of supply have<br />
not, in the past, proven to be a significant impediment in the conduct of business. However, there can be no assurance that Caterpillar<br />
will continue to supply its products in the quantities and timeframes required by customers.
TOROMONT <strong>2009</strong> ANNUAL REPORT | 47<br />
Compression Group<br />
The Compression Group purchases a broad range of materials and components in connection with its manufacturing and service<br />
activities. Though it is generally not dependent on any single source of supply, the ability of suppliers to meet performance, quality<br />
specifications and delivery schedules is important to the maintenance of customer satisfaction. Further, a significant increase in the price<br />
of one or more of these components could have a negative impact on <strong>Toromont</strong>’s results of operations.<br />
Competition<br />
The Company competes with a large number of international, national, regional and local suppliers in each of its markets. Although price<br />
competition can be strong, there are a number of factors that have enhanced the Company’s ability to compete throughout its market areas<br />
including: the range and quality of products and services; ability to meet sophisticated customer requirements; distribution capabilities<br />
including number and proximity of locations; financing offered by Caterpillar Finance; e-commerce solutions; reputation and financial<br />
strength. Increased competitive pressures or the inability of the Company to maintain the factors that have enhanced its competitive<br />
position to date could adversely affect the Company’s business, results of operations or financial condition.<br />
The Compression Group requires skilled engineering and design professionals in order to maintain customer satisfaction and<br />
engage in product innovation. <strong>Toromont</strong> competes for these professionals, not only with other companies in the same industry, but<br />
also with oil and gas producers and other industries. In periods of high energy activity, demand for the skills and expertise of these<br />
professionals increases, making the hiring and retention of these individuals more difficult.<br />
<strong>Toromont</strong> also relies on the skills and availability of trained and experienced tradesmen and technicians in both the Equipment and<br />
Compression Groups in order to provide efficient and appropriate services to customers. Hiring and retaining such individuals is critical<br />
to the success of these businesses. Demographic trends are reducing the number of individuals entering the trades, making access to<br />
skilled individuals more difficult. The Company has several remote locations which could make attracting and retaining skilled individuals<br />
more difficult.<br />
Credit Risk<br />
Financial instruments that potentially subject the Company to concentrations of credit risk consist of cash equivalents, accounts<br />
receivable and derivative financial instruments. The carrying amount of assets included on the balance sheet represents the maximum<br />
credit exposure.<br />
Cash equivalents consist mainly of short-term investments, such as money market deposits. No asset-backed commercial paper<br />
products were held. The Company manages its credit exposure associated with cash equivalents by ensuring there is no significant<br />
concentration of credit risk with a single counterparty, and by dealing only with highly rated financial institutions as counterparties.<br />
The Company has accounts receivable from a large diversified customer base, and is not dependent on any single customer,<br />
industry or geographic area. The Company has accounts receivable from customers engaged in various industries including oil and<br />
gas production construction, mining, food and beverage, and governmental agencies. These customers are based across North<br />
America with a smaller percentage of accounts receivable held with international clients. Management does not believe that any<br />
single industry or geographic region represents significant credit risk. While the acquisition of Enerflex will increase the concentration<br />
of customers in the natural gas industry, there will be further diversification in terms of geographic representation, as Enerflex has<br />
significant operations in Europe and Australia.<br />
The credit risk associated with derivative financial instruments arises from the possibility that the counterparties may default on their<br />
obligations. In order to minimize this risk, the Company enters into derivative transactions only with highly rated financial institutions.<br />
Warranties and Maintenance Contracts<br />
<strong>Toromont</strong> provides warranties for most of the equipment it sells, typically for a one-year period following sale. The warranty claim risk<br />
is generally shared jointly with the equipment manufacturer. Accordingly, liability is generally limited to the service component of the<br />
warranty claim, while the manufacturer is responsible for providing the required parts.<br />
The Company also enters into long-term maintenance and repair contracts, whereby it is obligated to maintain equipment for its<br />
customers. The length of these contracts varies generally from two to five years. The contracts are typically fixed price with provisions<br />
for inflationary adjustments. Due to the long-term nature of these contracts, there is a risk that maintenance costs may exceed the<br />
estimate, thereby resulting in a loss on the contract. These contracts are closely monitored for early warning signs of cost overruns. In<br />
addition, the manufacturer may, in certain circumstances, share in the cost overruns if profitability falls below a certain threshold.<br />
Foreign Exchange<br />
The Company transacts business in multiple currencies, the most significant of which are the Canadian dollar, the U.S. dollar and the<br />
Euro. As a result, the Company has foreign currency exposure with respect to items denominated in foreign currencies. The types of<br />
foreign exchange risk can be categorized as follows:
48 | TOROMONT <strong>2009</strong> ANNUAL REPORT<br />
Transaction Exposure<br />
The Company sources the majority of its products and major components from the United States. Consequently, reported costs of inventory<br />
and the transaction prices charged to customers for equipment and parts are affected by the relative strength of the Canadian dollar. The<br />
Company mitigates exchange rate risk by entering into foreign currency contracts to fix the cost of imported inventory where appropriate.<br />
In addition, pricing to customers is customarily adjusted to reflect changes in the Canadian dollar landed cost of imported goods.<br />
The Company also sells compression packages in foreign currencies, primarily the U.S. dollar and the Euro, and enters into foreign<br />
currency contracts to reduce these exchange rate risks.<br />
Foreign exchange contracts reduce volatility by fixing landed costs related to specific customer orders and establishing a level<br />
of price stability for high-volume goods such as spare parts. The Company does not enter into foreign exchange forward contracts for<br />
speculative purposes. The gains and losses on the foreign exchange forward contracts designated as cash flow hedges are intended to<br />
offset the translation losses and gains on the hedged foreign currency transactions when they occur.<br />
As a result, the foreign exchange impact on earnings with respect to transactional activity is not significant.<br />
Translation Exposure<br />
At December 31, <strong>2009</strong> all of the Company’s foreign operations are considered self-sustaining. Accordingly, assets and liabilities are<br />
translated into Canadian dollars using the exchange rates in effect at the balance sheet dates. Unrealized translation gains and losses<br />
are deferred and included in accumulated other comprehensive income. The cumulative currency translation adjustments are recognized<br />
in income when there has been a reduction in the net investment in the foreign operations. Analysis of Enerflex’s foreign operations will<br />
be performed in 2010 to determine whether they are self-sustaining or integrated.<br />
Foreign currency-based earnings are translated into Canadian dollars each period. As a result, fluctuations in the value of the<br />
Canadian dollar relative to these other currencies will impact reported net income. Such exchange rate fluctuations have historically<br />
not been material year-over-year relative to the overall earnings or financial position of the Company. The impact in <strong>2009</strong> was to reduce<br />
revenues by $40 million and net income by approximately $3 million.<br />
However, exchange rate fluctuations may be more significant in future periods as a result of <strong>Toromont</strong>’s acquisition of Enerflex.<br />
When Enerflex’s results of operations are consolidated with those of <strong>Toromont</strong>, a larger percentage of revenues and expenses will be<br />
denominated in currencies other than the Canadian dollar.<br />
Interest Rate<br />
The Company minimizes its interest rate risk by managing its portfolio of floating and fixed rate debt, as well as managing the term<br />
to maturity.<br />
The Company is exposed to changes in interest rates, which may impact on the Company’s floating rate borrowing costs. At<br />
December 31, <strong>2009</strong>, the Company’s debt portfolio is comprised of 99% fixed rate and 1% floating rate debt. In January 2010, in<br />
connection with the acquisition of Enerflex, <strong>Toromont</strong> secured a term loan facility providing for the availability of an additional $450 million<br />
of floating rate debt, of which $313.8 million had been drawn as at February 5, 2010. Further draw downs of this facility will be made as<br />
required. Assuming the full amount of the facility is drawn down, <strong>Toromont</strong>’s debt portfolio would be comprised of approximately 26%<br />
fixed rate and 74% floating rate debt.<br />
Fixed rate debt exposes the Company to future interest rate movements upon refinancing the debt at maturity. The Company’s fixed<br />
rate debt matures between 2011 and 2019, with 80% maturing in 2015.<br />
Further, the fair value of the Company’s fixed rate debt obligations may be negatively affected by declines in interest rates, thereby<br />
exposing the Company to potential losses on early settlements or refinancing. The Company does not intend to settle or refinance any<br />
existing debt before maturity.<br />
Floating rate debt exposes the Company to fluctuations in short-term interest rates by causing related interest payments and<br />
finance expense to vary.<br />
Financing Arrangements<br />
The Company requires capital to finance its growth and to refinance its outstanding debt obligations as they come due for repayment. If the<br />
cash generated from the Company’s business, together with the credit available under existing bank facilities, is not sufficient to fund future<br />
capital requirements, the Company will require additional debt or equity financing in the capital markets. The Company’s ability to access<br />
capital markets on terms that are acceptable will be dependent upon prevailing market conditions, as well as the Company’s future financial<br />
condition. Further, the Company’s ability to increase its debt financing may be limited by its financial covenants or its credit rating objectives.<br />
The Company maintains a conservative leverage structure and although it does not anticipate difficulties, there can be no assurance that<br />
capital will be available on suitable terms and conditions, or that borrowing costs and credit ratings will not be adversely affected.
TOROMONT <strong>2009</strong> ANNUAL REPORT | 49<br />
Integration Risk<br />
The anticipated benefits and synergies from acquiring Enerflex will depend in part on whether the operations, systems, management and<br />
cultures of Enerflex and <strong>Toromont</strong> can be integrated in an efficient and effective manner and whether the presumed bases or sources of<br />
synergies produce the benefits anticipated. Most operational and strategic decisions with respect to the combined organization have not<br />
yet been made and may not have been fully identified. These decisions and the integration of Enerflex with <strong>Toromont</strong> Energy Systems will<br />
present significant challenges to management. There can be no assurance that there will be operational or other synergies realized by<br />
the combined company, or that the integration of the two companies’ operations, systems, management, personnel and cultures will be<br />
timely or effectively accomplished, or ultimately will be successful in achieving the anticipated benefits. The integration process may lead<br />
to greater than expected operating costs, customer loss and business disruption (including, without limitation, difficulties in maintaining<br />
relationships with employees, customers or suppliers) for <strong>Toromont</strong> or the combined organization that may affect the ability of the combined<br />
organization to realize the anticipated benefits of the combination or may otherwise materially and adversely affect <strong>Toromont</strong>’s business,<br />
results of operations or financial condition.<br />
Environmental Regulation<br />
<strong>Toromont</strong>’s customers, particularly in North America and Europe, are subject to significant and ever-increasing environmental legislation<br />
and regulation. This legislation can impact <strong>Toromont</strong> in two ways. First, it may increase the technical difficulty in meeting environmental<br />
requirements in product design, which could increase the cost of these businesses’ products. Second, it may result in a reduction in activity<br />
by <strong>Toromont</strong>’s customers in environmentally sensitive areas, in turn reducing the sales opportunities available to <strong>Toromont</strong>.<br />
<strong>Toromont</strong> is also subject to a broad range of environmental laws and regulations. These may, in certain circumstances, impose<br />
strict liability for environmental contamination, which may render <strong>Toromont</strong> liable for remediation costs, natural resource damages and<br />
other damages as a result of conduct that was lawful at the time it occurred or the conduct of, or conditions caused by, prior owners,<br />
operators or other third parties. In addition, where contamination may be present, it is not uncommon for neighbouring land owners<br />
and other third parties to file claims for personal injury, property damage and recovery of response costs. Remediation costs and other<br />
damages arising as a result of environmental laws and regulations, and costs associated with new information, changes in existing<br />
environmental laws and regulations or the adoption of new environmental laws and regulations could be substantial and could negatively<br />
impact <strong>Toromont</strong>’s business, results of operations or financial condition.<br />
CRITICAL ACCOUNTING POLICIES AND ESTIMATES<br />
The Company’s significant accounting policies are described in Note 1 to the audited consolidated financial statements. The preparation<br />
of financial statements in conformity with Canadian GAAP requires estimates and assumptions that affect the results of operations<br />
and financial position. By their nature, these judgments are subject to an inherent degree of uncertainty and are based upon historical<br />
experience, trends in the industry and information available from outside sources. Management reviews its estimates on an ongoing<br />
basis. Different accounting policies, or changes to estimates or assumptions could potentially have a material impact, positive or<br />
negative, on <strong>Toromont</strong>’s financial position and results of operations. The critical accounting policies and estimates described below<br />
affect both the Equipment Group and Compression Group similarly and therefore are not discussed on a segmented basis.<br />
Revenue Recognition<br />
The Company reflects revenues generated from the assembly and manufacture of projects using the percentage-of-completion approach<br />
of accounting for performance of production-type contracts. This approach to revenue recognition requires management to make a<br />
number of estimates and assumptions surrounding the expected profitability of the contract, the estimated degree of completion based<br />
on cost progression and other detailed factors. Although these factors are routinely reviewed as part of the project management process,<br />
changes in these estimates or assumptions could lead to changes in the revenues recognized in a given period. However, there are many<br />
of these projects in process at any given point, the majority of which are in actual construction for a period of three months or less.<br />
Property, Plant and Equipment<br />
Fixed assets are stated at cost less accumulated depreciation, including asset impairment losses. Depreciation is calculated using the<br />
straight-line method over the estimated useful lives of the assets.<br />
The estimated useful lives of fixed assets are reviewed on a regular basis. Assessing the reasonableness of the estimated useful<br />
lives of fixed assets requires judgment and is based on currently available information.<br />
Fixed assets are also reviewed for potential impairment on a regular basis or whenever events or changes in circumstances indicate<br />
that the carrying amount may not be recoverable. In cases where the undiscounted expected future cash flows are less than the carrying<br />
amount, an impairment loss is recognized. Impairment losses on long-lived assets are measured as the amount by which the carrying<br />
value of an asset or asset group exceeds its fair value, as determined by the discounted future cash flows of the asset or asset group. In<br />
estimating future cash flows, the Company uses its best estimates based on internal plans that incorporate management’s judgments as<br />
to the remaining service potential of the fixed assets.
50 | TOROMONT <strong>2009</strong> ANNUAL REPORT<br />
Changes in circumstances, such as technological advances and changes to business strategy can result in actual useful lives and<br />
future cash flows differing significantly from estimates. The assumptions used, including rates and methodologies, are reviewed on an<br />
ongoing basis to ensure they continue to be appropriate. Revisions to the estimated useful lives of fixed assets or future cash flows<br />
constitute a change in accounting estimate and are applied prospectively.<br />
Income Taxes<br />
The liability method of accounting for income taxes is used. Future income tax assets and liabilities, measured at substantively enacted<br />
tax rates, are recognized for all temporary differences caused when the tax bases of assets and liabilities differ from those reported in<br />
the audited consolidated financial statements.<br />
Income tax rules and regulations in the countries in which the Company operates and income tax treaties between these countries<br />
are subject to interpretation and require estimates and assumptions in determining the Company’s consolidated income tax provision<br />
that may be challenged by the taxation authorities.<br />
Changes or differences in these estimates or assumptions may result in changes to the current or future income tax balances on<br />
the consolidated balance sheet, a charge or credit to income tax expense in the consolidated statement of earnings and may result in<br />
cash payments or receipts. Additional information on income taxes is provided in Note 17 to the accompanying audited consolidated<br />
financial statements.<br />
CHANGES IN ACCOUNTING POLICIES<br />
Goodwill and Intangible Assets<br />
Effective January 1, <strong>2009</strong>, the Company adopted the Canadian Institute of Chartered Accountants (CICA) Handbook Section<br />
3064 Goodwill and Intangible Assets, which replaced previous guidance. The standard establishes guidelines for the recognition,<br />
measurement, presentation and disclosure of goodwill and intangible assets subsequent to initial recognition. The standard had no<br />
impact on the Company’s consolidated financial statements.<br />
Credit Risk and the Fair Value of Financial Instruments<br />
Effective January 1, <strong>2009</strong>, the Company adopted CICA EIC 173 Credit Risk and the Fair Value of Financial Assets and Financial Liabilities.<br />
This guidance clarified that an entity’s own credit risk and the credit risk of the counterparty should be taken into account in determining<br />
the fair value of financial assets and financial liabilities including derivative instruments. Adoption of this guidance had no impact on the<br />
Company’s consolidated financial statements.<br />
Financial Instruments – Disclosures<br />
In June <strong>2009</strong>, the CICA amended Section 3862 Financial Instruments – Disclosures. The amendments enhance disclosures about<br />
fair value measurements, including the relative reliability of the inputs used in those measurements, and about the liquidity risk, of<br />
financial instruments. The amendment establishes a three level hierarchy that reflects the significance of the inputs used in fair value<br />
measurements on financial instruments. The amendment is effective for annual financial statements relating to fiscal years ending after<br />
September 30, <strong>2009</strong>. The amendments are effective for the Company’s <strong>2009</strong> annual consolidated financial statements and its adoption<br />
did not have an impact on the financial position, cash flow or earnings of the Company. The required disclosures are provided in Note 14.<br />
Comparative information is not required in the year of adoption.<br />
Financial Instruments – Recognition and Measurement<br />
In <strong>2009</strong>, the CICA made several amendments and clarifications to Section 3855 Financial Instruments – Recognition and Measurement.<br />
The changes were as follows:<br />
n Clarified the effective interest method which is a method of calculating the amortized cost of financial assets and financial liabilities and<br />
of allocating the interest income or interest expense over the relevant period<br />
n Clarified the requirements regarding reclassification of held-for-trading financial instruments containing embedded derivatives<br />
n Eliminated the distinction between debt securities and other debt instruments and changed the categories to which debt instruments<br />
are required or are permitted to be classified.<br />
The adoption of these amendments did not have a material impact on the financial position, cash flow or earnings of the Company.<br />
FUTURE ACCOUNTING STANDARDS<br />
In January <strong>2009</strong>, the CICA issued Handbook Section 1582 Business Combinations, Section 1601 Consolidated Financial Statements, and<br />
Section 1602 Non-controlling Interests. These new standards are harmonized with International Financial <strong>Report</strong>ing Standards (IFRS).<br />
Section 1582 specifies a number of changes, including: an expanded definition of a business, a requirement to measure all business
TOROMONT <strong>2009</strong> ANNUAL REPORT | 51<br />
acquisitions at fair value, a requirement to measure non-controlling interests at fair value, and a requirement to recognize acquisition-related<br />
costs as expenses. Section 1601 establishes the standards for preparing consolidated financial statements. Section 1602 specifies that<br />
non-controlling interests be treated as a separate component of equity, not as a liability or other item outside of equity. The new standards<br />
will become effective in 2011. Early adoption is permitted. If an entity applies this Section before January 1, 2011, it shall also adopt Section<br />
1601 and 1602. The Company is currently considering early adoption of Section 1582.<br />
INTERNATIONAL FINANCIAL REPORTING STANDARDS<br />
International Financial <strong>Report</strong>ing Standards (IFRS) will be required in Canada for publicly accountable enterprises for fiscal years<br />
beginning on or after January 1, 2011. IFRS uses a conceptual framework similar to Canadian GAAP, but there are significant differences<br />
on recognition, measurement and disclosures.<br />
The conversion project consists of four phases: diagnostic, design and planning, solution development and implementation.<br />
Investments in training and resources will be made throughout the transition period to facilitate a timely conversion.<br />
Based on diagnostics completed to date, the areas identified with the most potential impact are as follows: property, plant and<br />
equipment; provisions; certain aspects of revenue recognition; expanded disclosure requirements and IFRS 1 First Time Adoption.<br />
The Company expects the transition to IFRS to potentially impact financial reporting, business processes, internal controls and<br />
information systems.<br />
We are in the solution development phase and have established issue-specific work teams to focus on quantification of impact,<br />
generating options and making recommendations in the identified risk areas. During this phase, we will establish a staff communications<br />
plan, develop our staff training programs, and evaluate the impacts of the IFRS transition on other business activities.<br />
Although our solution development activities are well underway and commencing according to plan, continued progress is<br />
necessary before the Company can prudently increase the specificity of the disclosure of IFRS changeover accounting policy<br />
differences. In addition, due to anticipated changes in Canadian GAAP and IFRS prior to the Company’s transition to IFRS, the full impact<br />
of adopting IFRS on the Company’s future financial position and results of operations cannot be reasonably determined at this time.<br />
<strong>Toromont</strong> anticipates a significant increase in disclosure resulting from the adoption of IFRS and is continuing to assess the level of<br />
disclosure required as well as systems changes that may be necessary to gather and process the required information.<br />
RESPONSIBILITY OF MANAGEMENT AND THE BOARD OF DIRECTORS<br />
Management is responsible for the information disclosed in this MD&A and the accompanying consolidated financial statements, and<br />
has in place appropriate information systems, procedures and controls to ensure that information used internally by management and<br />
disclosed externally is materially complete and reliable. In addition, the Company’s Audit Committee, on behalf of the Board of Directors,<br />
provides an oversight role with respect to all public financial disclosures made by the Company, and has reviewed and approved this MD&A<br />
and the accompanying consolidated financial statements. The Audit Committee is also responsible for determining that management<br />
fulfills its responsibilities in the financial control of operations, including disclosure controls and procedures and internal control over<br />
financial reporting.<br />
DISCLOSURE CONTROLS AND PROCEDURES AND INTERNAL CONTROL OVER FINANCIAL REPORTING<br />
The Chairman & Chief Executive Officer and the Chief Financial Officer, together with other members of management, have evaluated the<br />
effectiveness of the Company’s disclosure controls and procedures and internal controls over financial reporting as at December 31, <strong>2009</strong>,<br />
using the internal control integrated framework issued by the Committee of Sponsoring Organizations of the Treadway Commission.<br />
Based on that evaluation, they have concluded that the design and operation of the Company’s disclosure controls and procedures were<br />
adequate and effective as at December 31, <strong>2009</strong>, to provide reasonable assurance that a) material information relating to the Company<br />
and its consolidated subsidiaries would have been known to them and by others within those entities, and b) information required to be<br />
disclosed is recorded, processed, summarized and reported within required time periods. They have also concluded that the design<br />
and operation of internal controls over financial reporting were adequate and effective as at December 31, <strong>2009</strong>, to provide reasonable<br />
assurance regarding the reliability of financial reporting and the preparation of financial reporting in accordance with GAAP.<br />
There have been no changes in the design of the Company’s internal controls over financial reporting during the fourth quarter of<br />
<strong>2009</strong> that would materially affect, or is reasonably likely to materially affect, the Company’s internal controls over financial reporting.<br />
While the Officers of the Company have evaluated the effectiveness of disclosure controls and procedures and internal control over<br />
financial reporting as at December 31, <strong>2009</strong> and have concluded that these controls and procedures are being maintained as designed,<br />
they expect that the disclosure controls and procedures and internal controls over financial reporting may not prevent all errors and fraud.<br />
A control system, no matter how well conceived or operated, can only provide reasonable, not absolute, assurance that the objectives of<br />
the control system are met.
52 | TOROMONT <strong>2009</strong> ANNUAL REPORT<br />
NON-GAAP FINANCIAL MEASURES<br />
The success of the Company and business unit strategies is measured using a number of key performance indicators, which are outlined<br />
below. These measures are also used by management in its assessment of relative investments in operations. These key performance<br />
indicators are not measurements in accordance with Canadian GAAP. It is possible that these measures will not be comparable to similar<br />
measures prescribed by other companies. They should not be considered as an alternative to net income or any other measure of<br />
performance under Canadian GAAP.<br />
Operating Income and Operating Margin<br />
Each business segment assumes responsibility for its operating results as measured by, amongst other factors, operating income, which<br />
is defined as income before income taxes, interest income and interest expense. Financing and related interest charges cannot be attributed<br />
to business segments on a meaningful basis that is comparable to other companies. Business segments and income tax jurisdictions<br />
are not synonymous, and it is believed that the allocation of income taxes distorts the historical comparability of the performance of<br />
the business segments. Consolidated and segmented operating income is reconciled to net earnings in tables where used in this MD&A.<br />
Operating income margin is calculated by dividing operating income by total revenue.<br />
Return on Equity (ROE) and Return on Capital Employed (ROCE)<br />
Return on equity is monitored to assess the profitability of the consolidated Company. ROE is calculated by dividing net earnings by<br />
opening shareholders’ equity.<br />
ROCE is a key performance indicator that is utilized to assess both current operating performance and prospective investments.<br />
The numerator used for the calculation is income before income taxes, interest expense and interest income (excluding interest on<br />
rental conversions). The denominator in the calculation is the monthly average capital employed, which is defined as net debt plus<br />
shareholders’ equity.<br />
Working Capital and Non-Cash Working Capital<br />
Working capital is defined as current assets less current liabilities. Non-cash working capital is defined as working capital less cash<br />
and equivalents.
Management’s <strong>Report</strong><br />
TOROMONT <strong>2009</strong> ANNUAL REPORT | 53<br />
The preparation and presentation of the Company’s consolidated financial statements is the responsibility of management. The<br />
financial statements have been prepared in accordance with Canadian generally accepted accounting principles and necessarily<br />
include estimates, which are based on management’s best judgments. Information contained elsewhere in the <strong>Annual</strong> <strong>Report</strong> is<br />
consistent, where applicable, with that contained in the financial statements.<br />
Management maintains appropriate systems of internal control. Policies and procedures are designed to give reasonable<br />
assurance that transactions are appropriately authorized, assets are safeguarded from loss or unauthorized use and financial records<br />
are properly maintained to provide reliable information for preparation of financial statements.<br />
Ernst & Young LLP, an independent firm of Chartered Accountants, were appointed by the shareholders as external auditors to<br />
examine the consolidated financial statements in accordance with generally accepted auditing standards in Canada and provide an<br />
independent professional opinion. Their report is presented with the consolidated financial statements.<br />
The Board of Directors, acting through an Audit Committee comprised solely of independent directors, is responsible for<br />
determining that management fulfills its responsibilities in the preparation of the consolidated financial statements and the financial<br />
control of operations. The Audit Committee recommends the independent auditors for appointment by the shareholders. It meets<br />
regularly with financial management and the internal and external auditors to discuss internal controls, auditing matters and financial<br />
reporting issues. The independent auditors have unrestricted access to the Audit Committee. The consolidated financial statements<br />
and Management’s Discussion and Analysis have been approved by the Board of Directors for inclusion in this <strong>Annual</strong> <strong>Report</strong>, based<br />
on the review and recommendation of the Audit Committee.<br />
Signed Signed<br />
Robert M. Ogilvie Paul R. Jewer Toronto, Ontario, Canada<br />
Chairman and Vice President Finance and February 5, 2010<br />
Chief Executive Officer Chief Financial Officer<br />
Auditors’ <strong>Report</strong><br />
To the Shareholders of <strong>Toromont</strong> <strong>Industries</strong> <strong>Ltd</strong>.:<br />
We have audited the consolidated balance sheets of <strong>Toromont</strong> <strong>Industries</strong> <strong>Ltd</strong>. as at December 31, <strong>2009</strong> and 2008 and the consolidated<br />
statements of earnings, retained earnings, comprehensive income and cash flows for the years then ended. These financial statements<br />
are the responsibility of the Company’s management. Our responsibility is to express an opinion on these financial statements based<br />
on our audits.<br />
We conducted our audits in accordance with Canadian generally accepted auditing standards. Those standards require that<br />
we plan and perform an audit to obtain reasonable assurance whether the financial statements are free of material misstatement. An<br />
audit includes examining, on a test basis, evidence supporting the amounts and disclosures in the financial statements. An audit also<br />
includes assessing the accounting principles used and significant estimates made by management, as well as evaluating the overall<br />
financial statement presentation.<br />
In our opinion, these consolidated financial statements present fairly, in all material respects, the financial position of the<br />
Company as at December 31, <strong>2009</strong> and 2008 and the results of its operations and its cash flows for the years then ended in<br />
accordance with Canadian generally accepted accounting principles.<br />
Signed<br />
Ernst & Young LLP Toronto, Ontario, Canada<br />
Chartered Accountants February 5, 2010<br />
Licensed Public Accountants
54 | TOROMONT <strong>2009</strong> ANNUAL REPORT<br />
Consolidated Balance Sheets<br />
As at December 31 ($ thousands) <strong>2009</strong> 2008<br />
AssETs<br />
Current assets<br />
Cash and cash equivalents $ 206,957 $ 137,274<br />
Accounts receivable 244,759 375,059<br />
Inventories (note 5) 373,110 499,360<br />
Income taxes receivables 16,967 2,068<br />
Future income taxes (note 17) 34,326 34,934<br />
Derivative financial instruments – 13,212<br />
Other current assets 6,037 11,381<br />
Total current assets 882,156 1,073,288<br />
Property, plant and equipment (note 6) 186,491 199,370<br />
Rental equipment (note 7) 183,175 203,277<br />
Derivative financial instruments – 1,403<br />
Other assets (note 8) 78,045 21,312<br />
Goodwill 34,800 34,800<br />
Total assets $ 1,364,667 $ 1,533,450<br />
LiABiLiTiEs<br />
Current liabilities<br />
Accounts payable and accrued liabilities (note 9) $ 238,164 $ 346,118<br />
Deferred revenues 89,810 194,261<br />
Current portion of long-term debt (note 10) 14,044 15,363<br />
Income taxes payable – 6,304<br />
Derivative financial instruments 874 1,966<br />
Total current liabilities 342,892 564,012<br />
Deferred revenues 13,386 25,480<br />
Long-term debt (note 10) 144,051 158,112<br />
Accrued pension liability (note 16) 2,351 2,322<br />
Future income taxes (note 17) 7,924 4,421<br />
shAREhOLdERs’ EQUiTy<br />
Share capital (note 11) 132,261 127,704<br />
Contributed surplus (note 12) 10,012 8,978<br />
Retained earnings 712,418 631,522<br />
Accumulated other comprehensive (loss) income (note 13) (628) 10,899<br />
Total shareholders’ equity 854,063 779,103<br />
Total liabilities and shareholders’ equity $ 1,364,667 $ 1,533,450<br />
See accompanying notes<br />
On behalf of the Board:<br />
Signed Signed<br />
Robert M. Ogilvie John S. McCallum<br />
Director Director
Consolidated Statements<br />
of Earnings<br />
TOROMONT <strong>2009</strong> ANNUAL REPORT | 55<br />
Years ended December 31 ($ thousands, except share amounts) <strong>2009</strong> 2008<br />
REvENUEs $ 1,824,592 $ 2,121,209<br />
Cost of goods sold 1,415,476 1,660,285<br />
Gross profit 409,116 460,924<br />
Selling and administrative expenses 226,764 253,070<br />
OPERATiNg iNcOME 182,352 207,854<br />
Interest expense 8,815 11,753<br />
Interest and investment income (6,355) (14,999)<br />
Income before income taxes 179,892 211,100<br />
Income taxes 59,376 70,247<br />
Earnings from continuing operations 120,516 140,853<br />
Loss on disposal of discontinued operations (note 3) – (432)<br />
Earnings from discontinued operations, net of tax (note 3) – 103<br />
NET EARNiNgs $ 120,516 $ 140,524<br />
BAsic EARNiNgs PER shARE (note 18)<br />
Continuing operations $ 1.86 $ 2.17<br />
Discontinued operations – (0.01)<br />
$ 1.86 $ 2.16<br />
diLUTEd EARNiNgs PER shARE (note 18)<br />
Continuing operations $ 1.86 $ 2.16<br />
Discontinued operations – (0.01)<br />
$ 1.86 $ 2.15<br />
WEighTEd AvERAgE NUMBER Of shAREs OUTsTANdiNg – BAsic 64,716,775 65,016,778<br />
WEighTEd AvERAgE NUMBER Of shAREs OUTsTANdiNg – diLUTEd 64,830,866 65,439,046<br />
See accompanying notes<br />
Consolidated Statements<br />
of Retained Earnings<br />
Years ended December 31 ($ thousands) <strong>2009</strong> 2008<br />
Retained earnings, beginning of year $ 631,522 $ 539,039<br />
Net earnings 120,516 140,524<br />
Dividends (38,848) (36,391)<br />
Shares purchased for cancellation (note 11) (772) (11,650)<br />
Retained earnings, end of year $ 712,418 $ 631,522<br />
See accompanying notes
56 | TOROMONT <strong>2009</strong> ANNUAL REPORT<br />
Consolidated Statements<br />
of Comprehensive Income<br />
Years ended December 31 ($ thousands) <strong>2009</strong> 2008<br />
Net earnings<br />
Other comprehensive income:<br />
$ 120,516 $ 140,524<br />
Unrealized (loss) gain on translation of financial statements<br />
of self-sustaining foreign operations (23,308) 21,072<br />
Loss on translation of financial statements of self-sustaining foreign<br />
operations transferred to net income on dispositon of operations<br />
Change in fair value of derivatives designated as cash flow hedges,<br />
– 1,090<br />
net of income tax (recovery) expense (<strong>2009</strong> - ($2,181); 2008 - $4,062)<br />
Loss (gain) on derivatives designated as cash flow hedges<br />
transferred to net income in the current period,<br />
(4,063) 7,547<br />
net of income tax expense (recovery) (<strong>2009</strong> - $122; 2008 - ($1,415)<br />
Unrealized gain on financial assets designated as available-for-sale,<br />
229 (2,626)<br />
net of income taxes ($3,090) 15,615 –<br />
Gain on financial assets designated as available-for-sale transferred<br />
to net income on realization, net of income taxes of $24 – (44)<br />
Other comprehensive (loss) income (11,527) 27,039<br />
Comprehensive income $ 108,989 $ 167,563<br />
See accompanying notes
Consolidated Statements<br />
of Cash Flows<br />
TOROMONT <strong>2009</strong> ANNUAL REPORT | 57<br />
Years ended December 31 ($ thousands) <strong>2009</strong> 2008<br />
OPERATiNg AcTiviTiEs<br />
Net earnings $ 120,516 $ 140,524<br />
Items not requiring cash and cash equivalents<br />
Depreciation 58,165 56,070<br />
Stock-based compensation 2,289 2,494<br />
Accrued pension liability 29 (1,261)<br />
Future income taxes<br />
Gain on sale of:<br />
3,093 (8,972)<br />
Rental equipment, property, plant and equipment (7,147) (6,191)<br />
Investments – (8,234)<br />
Loss on disposal of discontinued operations – 432<br />
176,945 174,862<br />
Net change in non-cash working capital and other (note 21) 19,308 (10,150)<br />
Cash provided by operating activities 196,253 164,712<br />
iNvEsTiNg AcTiviTiEs<br />
Additions to:<br />
Rental equipment (39,712) (57,901)<br />
Property, plant and equipment (21,329) (38,574)<br />
Investments<br />
Proceeds on disposal of:<br />
(37,797) (13,811)<br />
Rental equipment 30,078 30,456<br />
Property, plant and equipment 5,128 1,319<br />
Investments – 43,948<br />
Disposal of discontinued operations (note 3) – 4,038<br />
Increase in other assets (10,272) (786)<br />
Business acquisitions (note 4) – (629)<br />
Cash used in investing activities (73,904) (31,940)<br />
fiNANciNg AcTiviTiEs<br />
Decrease in term credit facility debt – (30,000)<br />
Repayment of other long-term debt (15,380) (26,824)<br />
Dividends (38,165) (35,138)<br />
Shares purchased for cancellation (858) (12,808)<br />
Cash received on exercise of options 3,389 3,515<br />
Cash used in financing activities (51,014) (101,255)<br />
Effect of exchange rate changes on cash denominated<br />
in foreign currency (1,652) 2,243<br />
Increase in cash and cash equivalents 69,683 33,760<br />
Cash and cash equivalents at beginning of year 137,274 103,514<br />
Cash and cash equivalents at end of year $ 206,957 $ 137,274<br />
sUPPLEMENTAL cAsh fLOW iNfORMATiON (note 21)<br />
See accompanying notes
58 | TOROMONT <strong>2009</strong> ANNUAL REPORT<br />
Notes to the Consolidated Financial Statements<br />
December 31, <strong>2009</strong><br />
($ thousands except where otherwise indicated)<br />
1. DESCRIPTION OF BUSINESS AND SIGNIFICANT ACCOUNTING POLICIES<br />
<strong>Toromont</strong> <strong>Industries</strong> <strong>Ltd</strong>. and its subsidiaries (the “Company”) operate through two business segments: Equipment Group and Compression<br />
Group. The Equipment Group includes one of the world’s larger Caterpillar dealerships by revenue and geographic territory in addition<br />
to industry leading rental operations. The Compression Group is a Global leader specializing in the design, engineering, fabrication,<br />
and installation of natural gas compression units and hydrocarbon and petrochemical process systems and industrial and recreational<br />
refrigeration systems. Both Groups offer comprehensive product support capabilities. <strong>Toromont</strong> is listed on the Toronto Stock Exchange<br />
under the symbol TIH.<br />
These consolidated financial statements have been prepared by management in accordance with Canadian Generally Accepted<br />
Accounting Principles (“GAAP”).<br />
Basis of Consolidation<br />
The consolidated financial statements include the accounts of the Company and its wholly owned subsidiaries. All significant inter-company<br />
accounts and transactions have been eliminated.<br />
Use of Estimates<br />
The preparation of the consolidated financial statements in conformity with Canadian GAAP requires management to make estimates<br />
and assumptions that affect the reported amounts of assets and liabilities and disclosures of contingent assets and liabilities at the date<br />
of the financial statements and the reported amounts of revenues and expenses during the year. Actual results could differ from those<br />
estimates. Estimates are used in accounting for items and matters such as long-term contracts, allowance for uncollectible accounts<br />
receivable, allowance for inventory obsolescence, product warranty, estimated useful lives of assets for depreciation, asset and goodwill<br />
impairment assessments, employee benefits and income taxes.<br />
Revenue Recognition<br />
Revenue is recognized when persuasive evidence of an arrangement exists, the price is fixed or determinable, performance requirements<br />
are achieved and ultimate collection is reasonably assured. In addition to this general policy, the following describes the specific revenue<br />
recognition policies for each major category of revenue.<br />
(a) Revenues from the sale of equipment are recorded when goods are shipped to the customer, at which time title to the equipment and<br />
significant risks of ownership have passed.<br />
(b) Revenues from the supply of equipment systems involving design, manufacture, installation and start-up are determined using the<br />
percentage-of-completion method, based on total costs incurred as a proportion of expected total costs of the project. Revenues and<br />
costs begin to be recognized when progress reaches a stage of completion sufficient to reasonably determine the probable results.<br />
Any foreseeable losses on such projects are charged to operations when determined.<br />
(c) Revenues from equipment rentals are recognized in accordance with the terms of the relevant agreement with the customer, generally<br />
on a straight-line basis over the term of the agreement.<br />
(d) Product support services include sales of parts and servicing of equipment. For the sale of parts, revenues are recognized when the<br />
part is shipped to the customer. For servicing of equipment, revenues are recognized as the service work is completed and billed.<br />
(e) Revenues on extended warranty and long-term maintenance contracts are recognized either on a percentage-of-completion basis<br />
proportionate to the service work that has been performed based on the parts and labour service provided, or on a straight-line basis<br />
over the life of the warranty. At the completion of the contract, any remaining profit on the contract is recognized as revenue. Any<br />
losses estimated during the term of the contract are recognized when identified.<br />
(f) Revenues on equipment sold directly to customers or to third-party lessors for which the Company has provided a guarantee to<br />
repurchase the equipment at predetermined residual values and dates are accounted for as operating leases wherein revenue is<br />
recognized over the period extending to the date of the residual guarantee.<br />
Translation of Foreign Currencies<br />
Transactions denominated in foreign currencies are translated into Canadian dollars at the rate of exchange in effect at the time of the<br />
transaction. Monetary assets and liabilities are translated into Canadian dollars at the year-end exchange rate. Non-monetary items are<br />
translated at historical rates. All exchange gains and losses are included in earnings.<br />
Foreign subsidiaries are financially and operationally self-sustaining. Accordingly, their assets and liabilities are translated into<br />
Canadian funds at the year-end exchange rate. Revenue and expense items are translated at the average exchange rate for the year. The<br />
foreign exchange impact of these translations is included in accumulated other comprehensive income in shareholders’ equity.
TOROMONT <strong>2009</strong> ANNUAL REPORT | 59<br />
Financial Instruments<br />
Financial instruments are measured at fair value on initial recognition. After initial recognition, financial instruments are measured at<br />
their fair values, except for loans and receivables and other financial liabilities, which are measured at cost or amortized cost using the<br />
interest rate method.<br />
The Company primarily applies the market approach for recurring fair value measurements. Three levels of inputs may be used to<br />
measure fair value:<br />
n Level 1 – unadjusted quoted prices in active markets for identical assets or liabilities<br />
n Level 2 – observable inputs other than Level 1 prices that are observable or can be corroborated by observable market data for<br />
substantially the full term of asset or liability<br />
n Level 3 – unobservable inputs that are supported by little or no market activity and that are significant to the fair value of the assets<br />
or liabilities<br />
The Company has made the following classifications:<br />
n Cash and cash equivalents are classified as assets held for trading and are measured at fair value. Gains and losses resulting from the<br />
periodic revaluation are recorded in net income.<br />
n Accounts receivable are classified as loans and receivables and are recorded at amortized cost using the effective interest rate method.<br />
n Investments are classified as available for sale and are recorded at fair value based on quoted market prices. Gains and losses resulting<br />
from the periodic revaluation are recorded in other comprehensive income.<br />
n Accounts payable and accrued liabilities and long-term debt are classified as other financial liabilities. Subsequent measurements are<br />
recorded at amortized cost using the effective interest rate method.<br />
Transaction costs are expensed as incurred for financial instruments classified or designated as held for trading. Transaction costs for<br />
financial assets classified as available for sale are added to the value of the instrument at acquisition. Transaction costs related to other<br />
financial liabilities are added to the value of the instrument at acquisition and taken into net income using the effective interest rate method.<br />
Derivative Financial Instruments and Hedge Accounting<br />
Derivative financial agreements are used to manage exposure to fluctuations in exchange rates. The Company does not enter into<br />
derivative financial agreements for speculative purposes.<br />
Derivative financial instruments are measured at their fair value upon initial recognition and on each subsequent reporting date.<br />
The fair value of quoted derivatives is equal to their positive or negative market value. If a market value is not available, the fair value is<br />
calculated using standard financial valuation models, such as discounted cash flow or option pricing models. Derivatives are carried as<br />
assets when the fair value is positive and as liabilities when the fair value is negative.<br />
The Company elected to apply hedge accounting for foreign exchange forward contracts for firm commitments and anticipated<br />
transactions. These are also designated as cash flow hedges. For cash flow hedges, fair value changes of the effective portion of the<br />
hedging instrument are recognized in accumulated other comprehensive income, net of taxes. The ineffective portion of the fair value<br />
changes is recognized in net income. Amounts charged to accumulated other comprehensive income are reclassified to the income<br />
statement when the hedged transaction affects the income statement.<br />
All hedging relationships are formally documented, including the risk management objective and strategy. On an ongoing basis, an<br />
assessment is made as to whether the designated derivative financial instruments continue to be effective in offsetting changes in cash<br />
flows of the hedged transactions.<br />
Income Taxes<br />
The liability method of accounting for income taxes is used. Future income tax assets and liabilities are recognized for the future income<br />
tax consequences attributable to differences between the financial statement carrying values of existing assets and liabilities and their<br />
respective income tax bases. Future income tax assets and liabilities are measured using enacted or substantively enacted income tax<br />
rates expected to apply to taxable income in the years in which those temporary differences are expected to be recovered or settled. The<br />
effect on future income tax assets and liabilities of a change in income tax rates is recognized in net earnings in the period that includes<br />
the date of substantive enactment.<br />
Stock-Based Compensation<br />
The fair value method of accounting for stock options is used. The fair value of option grants are calculated using the Black-Scholes option<br />
pricing model and is recognized as compensation expense over the vesting period of those grants with a corresponding adjustment to<br />
contributed surplus. On the exercise of stock options, the consideration paid by the employee and the related amounts in contributed surplus<br />
are credited to common share capital.
60 | TOROMONT <strong>2009</strong> ANNUAL REPORT<br />
Employee Future Benefits<br />
For defined contribution plans, the pension expense recorded in earnings is the amount of the contributions the Company is required to<br />
pay in accordance with the terms of the plan.<br />
For defined benefit plans, the Company accrues its obligations and the related costs, net of plan assets. The Company has adopted<br />
the following policies for its defined benefit plans:<br />
n The cost of pensions earned by employees is actuarially determined using the projected unit credit method pro-rated on length of service<br />
and management’s best estimate assumptions to value its pensions using a measurement date of December 31;<br />
n For the purpose of calculating the expected return on plan assets, those assets are valued at fair value;<br />
n Past service costs from plan amendments are amortized on a straight-line basis over the average remaining service period of employees<br />
active at the date of amendments;<br />
n The excess of the net actuarial gain (loss) over 10% of the greater of the benefit obligation and the fair value of plan assets is amortized<br />
on a straight-line basis over the average remaining service period of the active employees or on the average remaining lifetime in the<br />
case of retirees.<br />
Earnings Per Share (“EPS”)<br />
Basic EPS is calculated by dividing the net earnings available to common shareholders by the weighted average number of common<br />
shares outstanding during the year. Diluted EPS is calculated using the treasury stock method, which assumes that all outstanding stock<br />
option grants are exercised, if dilutive, and the assumed proceeds are used to purchase the Company’s common shares at the average<br />
market price during the year.<br />
Cash and Cash Equivalents<br />
Cash and cash equivalents, including cash on account, demand deposits and short-term investments with original maturities of three<br />
months or less, are recorded at cost, which approximates market value.<br />
Inventories<br />
Inventories are valued at the lower of cost and net realizable value.<br />
Cost of equipment, repair and distribution parts and direct materials include purchase cost and costs incurred in bringing each<br />
product to its present location and condition. Serialized inventory is determined on a specific item basis. Non-serialized inventory is<br />
determined based on a weighted average actual cost.<br />
Cost of work-in-process includes cost of direct materials, labour and an allocation of manufacturing overheads, excluding borrowing<br />
costs, based on normal operating capacity.<br />
Cost of inventories include the transfer from accumulated other comprehensive income (loss) of gains and losses on qualifying cash<br />
flow hedges in respect of the purchase of inventory.<br />
Net realizable value is the estimated selling price in the ordinary course of business, less estimated costs of completion and the<br />
estimated costs necessary to make the sale.<br />
Inventories are written down to net realizable value when the cost of inventories is estimated to be unrecoverable due to obsolescence,<br />
damage or declining selling prices. When circumstances that previously caused inventories to be written down below cost no longer exist<br />
or when there is clear evidence of an increase in selling prices, the amount of the write-down previously recorded is reversed.<br />
Rental Equipment<br />
Rental equipment is recorded at cost. Rental equipment is depreciated over its estimated useful life on a straight-line basis. Estimated<br />
useful lives range from 1 to 15 years.<br />
Property, Plant and Equipment<br />
Property, plant and equipment are recorded at cost. Depreciation is recognized principally on a straight-line basis to depreciate the<br />
cost of these assets over their estimated useful lives. Estimated useful lives range from 20 to 30 years for buildings, 3 to 10 years for<br />
equipment and 20 years for power generation assets.<br />
Leasehold improvements and lease inducements are amortized on a straight-line basis over the term of the lease.<br />
Impairment of Long-lived Assets<br />
Long-lived assets are reviewed for impairment whenever events or changes in circumstances indicate that the carrying amount may not<br />
be recoverable. In cases where the undiscounted expected future cash flows are less than the carrying amount, an impairment loss is<br />
recognized. Impairment losses on long-lived assets are measured as the amount by which the carrying value of an asset group exceeds<br />
its fair value, as determined by the discounted future cash flows of the asset group.
TOROMONT <strong>2009</strong> ANNUAL REPORT | 61<br />
Goodwill<br />
Goodwill represents the cost of acquired businesses in excess of the fair value of net identifiable assets acquired. Goodwill is tested for<br />
impairment annually or more frequently if events or changes in circumstances indicate a potential impairment. In the fourth quarter of<br />
2008 and <strong>2009</strong>, annual goodwill assessments were performed and determined that there was no impairment in either year.<br />
Discontinued Operations<br />
The results of discontinued operations are presented net of tax on a one-line basis in the consolidated statements of earnings. Direct<br />
corporate overheads and income taxes are allocated to discontinued operations. Interest expense (income) and general corporate<br />
overheads are not allocated to discontinued operations.<br />
Comparative Amounts<br />
Certain comparative figures have been restated to conform with the current year’s presentation.<br />
2. CHANGES IN ACCOUNTING POLICIES<br />
Goodwill and Intangible Assets<br />
Effective January 1, <strong>2009</strong>, the Company adopted the Canadian Institute of Chartered Accountants (CICA) Handbook Section 3064 Goodwill<br />
and Intangible Assets, which replaced previous guidance. The standard establishes guidelines for the recognition, measurement, presentation<br />
and disclosure of goodwill and intangible assets subsequent to initial recognition. The standard had no impact on the Company’s consolidated<br />
financial statements.<br />
Credit Risk and the Fair Value of Financial Instruments<br />
Effective January 1, <strong>2009</strong>, the Company adopted CICA EIC 173 Credit Risk and the Fair Value of Financial Assets and Financial Liabilities.<br />
This guidance clarified that an entity’s own credit risk and the credit risk of the counterparty should be taken into account in determining<br />
the fair value of financial assets and financial liabilities including derivative instruments. Adoption of this guidance had no impact on the<br />
Company’s consolidated financial statements.<br />
Financial Instruments – Disclosures<br />
In June <strong>2009</strong>, the CICA amended Section 3862 Financial Instruments – Disclosures. The amendments enhance disclosures about<br />
fair value measurements, including the relative reliability of the inputs used in those measurements, and about the liquidity risk, of<br />
financial instruments. The amendment establishes a three level hierarchy that reflects the significance of the inputs used in fair value<br />
measurements on financial instruments. The amendment is effective for annual financial statements relating to fiscal years ending after<br />
September 30, <strong>2009</strong>. The amendments are effective for the Company’s <strong>2009</strong> annual consolidated financial statements and its adoption<br />
did not have an impact on the financial position, cash flow or earnings of the Company. The required disclosures are provided in note 14.<br />
Comparative information is not required in the year of adoption.<br />
Financial Instruments – Recognition and Measurement<br />
In <strong>2009</strong>, the CICA made several amendments and clarifications to Section 3855 Financial Instruments – Recognition and Measurement.<br />
The changes were as follows:<br />
n Clarified the effective interest method which is a method of calculating the amortized cost of financial assets and financial liabilities and<br />
of allocating the interest income or interest expense over the relevant period<br />
n Clarified the requirements regarding reclassification of held-for-trading financial instruments containing embedded derivatives<br />
n Eliminated the distinction between debt securities and other debt instruments and changed the categories to which debt instruments<br />
are required or are permitted to be classified.<br />
The adoption of these amendments did not have a material impact on the financial position, cash flow or earnings of the Company.<br />
Future Accounting Standards<br />
Business Combinations<br />
In January <strong>2009</strong>, the CICA issued Handbook Section 1582 Business Combinations, Section 1601 Consolidated Financial Statements, and<br />
Section 1602 Non-controlling Interests. These new standards are harmonized with International Financial <strong>Report</strong>ing Standards (IFRS).<br />
Section 1582 specifies a number of changes, including: an expanded definition of a business, a requirement to measure all business<br />
acquisitions at fair value, a requirement to measure non-controlling interests at fair value, and a requirement to recognize acquisitionrelated<br />
costs as expenses. Section 1601 establishes the standards for preparing consolidated financial statements. Section 1602
62 | TOROMONT <strong>2009</strong> ANNUAL REPORT<br />
specifies that non-controlling interests be treated as a separate component of equity, not as a liability or other item outside of equity.<br />
The new standards will become effective in 2011. Early adoption is permitted. If an entity applies this Section before January 1, 2011,<br />
it shall also adopt Section 1601 and 1602. The Company is currently considering early adoption of Section 1582.<br />
International Financial <strong>Report</strong>ing Standards (IFRS)<br />
Canadian GAAP will be converged with IFRS effective January 1, 2011. The transition from Canadian GAAP to IFRS will be applicable for the<br />
Company for the first quarter of 2011 when the Company will prepare both the current and comparative financial information using IFRS.<br />
3. DISCONTINUED OPERATIONS<br />
Effective June 30, 2008, the shares of Aero Tech Manufacturing Inc. were sold to its local management. Revenues and income before<br />
income taxes from discontinued operations in 2008 were $7,621 and $163 respectively.<br />
4. BUSINESS ACQUISITIONS<br />
Effective June 25, 2008, certain assets of a privately owned rental operation in Sault Ste. Marie, Ontario, were purchased. The acquisition<br />
was recorded using the purchase method. The purchase price was $629. The fair value of assets acquired was as follows: non-cash<br />
working capital – $126; property, plant and equipment – $165; and rental assets – $338.<br />
5. INVENTORIES<br />
<strong>2009</strong> 2008<br />
Equipment $ 164,744 $ 232,879<br />
Repair and distribution parts 74,809 80,261<br />
Direct materials 75,740 72,041<br />
Work-in-process 57,817 114,179<br />
$ 373,110 $ 499,360<br />
The amount of inventory recognized as an expense and included in cost of goods sold accounted for other than by the percentage-ofcompletion<br />
method during <strong>2009</strong> was $704 million (2008: $902 million). The amount charged to the income statement and included in cost<br />
of goods sold for the write-down of inventory for valuation issues during <strong>2009</strong> was $13.8 million (2008: $9.6 million).<br />
6. PROPERTY, PLANT AND EQUIPMENT<br />
<strong>2009</strong> 2008<br />
Accumulated Net Book Accumulated Net Book<br />
cost depreciation value Cost Depreciation Value<br />
Land $ 41,269 $ – $ 41,269 $ 39,030 $ – $ 39,030<br />
Buildings 157,830 58,679 99,151 143,333 51,814 91,519<br />
Equipment 129,987 97,774 32,213 147,554 106,928 40,626<br />
Power generation 37,714 24,353 13,361 36,061 23,264 12,797<br />
Assets under construction 497 – 497 15,398 – 15,398<br />
$ 367,297 $ 180,806 $ 186,491 $ 381,376 $ 182,006 $ 199,370<br />
Depreciation expense for the year ended December 31, <strong>2009</strong> was $22,668 (2008 – $23,423).<br />
7. RENTAL EQUIPMENT<br />
<strong>2009</strong> 2008<br />
Cost $ 301,489 $ 311,619<br />
Less: Accumulated depreciation 118,314 108,342<br />
$ 183,175 $ 203,277<br />
Depreciation expense for the year ended December 31, <strong>2009</strong> was $35,497 (2008 – $32,647). Operating income from rental operations for<br />
the year ended December 31, <strong>2009</strong> was $17.2 million (2008 – $31.5 million).
8. OTHER ASSETS<br />
TOROMONT <strong>2009</strong> ANNUAL REPORT | 63<br />
<strong>2009</strong> 2008<br />
Equipment sold with guaranteed residual values $ 10,940 $ 20,981<br />
Investment in marketable securities 56,502 –<br />
Deferred transaction costs 10,160 –<br />
Other 443 331<br />
$ 78,045 $ 21,312<br />
The investment in marketable securities is comprised of 3.9 million trust units of Enerflex Systems Income Fund. Units were purchased at a<br />
cost of $37,797 ($9.69 per unit) and were marked to market value of $56,502 ($14.48) as at December 31, <strong>2009</strong>. These financial instruments<br />
are designated as available for sale and as such the unrealized gain of $18,705 has been credited to other comprehensive income.<br />
9. ACCOUNTS PAYABLE AND ACCRUED LIABILITIES<br />
<strong>2009</strong> 2008<br />
Accounts payable and accrued liabilities $ 228,436 $ 337,073<br />
Dividends payable 9,728 9,045<br />
Total accounts payable and accrued liabilities $ 238,164 $ 346,118<br />
10. LONG-TERM DEBT<br />
<strong>2009</strong> 2008<br />
Senior debentures (b) $ 155,999 $ 166,659<br />
Notes payable (c) 2,096 6,816<br />
Total long-term debt 158,095 173,475<br />
Less current portion 14,044 15,363<br />
$ 144,051 $ 158,112<br />
All debt is unsecured.<br />
(a) The Company maintains $225 million in bank credit in Canada and U.S. $20 million in bank credit in the United States, provided through<br />
committed credit facilities. Of this, U.S. $20 million matures in 2010 and $225 million matures in 2011. Bank borrowings bear interest at<br />
rates ranging from prime to bankers acceptance rates. At December 31, <strong>2009</strong>, the Canadian prime rate was 2.25% and the 30-day banker’s<br />
acceptance rate was 0.3%. Standby letters of credit issued utilized $33,248 of the credit lines at December 31, <strong>2009</strong> (2008 – $62,225).<br />
(b) Terms of the senior debentures are:<br />
n $16,527, 6.80% senior debentures due March 29, 2011, interest payable semi-annually through March 29, 2007; thereafter, blended<br />
principal and interest payments through to maturity;<br />
n $125,000, 4.92% senior debentures due October 13, 2015, interest payable semi-annually, principal due on maturity; and<br />
n $14,471, 7.06% senior debentures due March 29, 2019, interest payable semi-annually through September 29, <strong>2009</strong>; thereafter,<br />
blended principal and interest payments through to maturity.<br />
(c) Notes payable mature in 2010 and bear interest at 0.14%.<br />
These credit arrangements include covenants, restrictions and events of default usually present in credit facilities of this nature, including<br />
requirements to meet certain financial tests periodically and restrictions on additional indebtedness and encumbrances.<br />
Scheduled principal repayments and interest payments on long-term debt are as follows:<br />
Principal Interest<br />
2010 $ 14,044 $ 8,137<br />
2011 6,889 7,266<br />
2012 1,280 6,986<br />
2013 1,372 6,895<br />
2014 1,471 6,796<br />
2015 to 2019 133,039 7,635<br />
$ 158,095 $ 43,715<br />
Interest expense included interest on debt initially incurred for a term greater than one year of $8,636 (2008 – $11,042).
64 | TOROMONT <strong>2009</strong> ANNUAL REPORT<br />
11. SHARE CAPITAL<br />
Authorized<br />
The Company is authorized to issue an unlimited number of common shares and preferred shares. No preferred shares have been issued.<br />
Issued<br />
The changes in the common shares issued and outstanding during the year were as follows:<br />
<strong>2009</strong> 2008<br />
Number of common Number of Common<br />
common share Common Share<br />
shares capital Shares Capital<br />
Balance, beginning of year 64,620,677 $ 127,704 64,943,497 $ 124,124<br />
Exercise of stock options 290,190 4,643 272,780 4,739<br />
Purchase of shares for cancellation (43,400) (86) (595,600) (1,159)<br />
Balance, end of year 64,867,467 $ 132,261 64,620,677 $ 127,704<br />
Shareholder Rights Plan<br />
The Shareholder Rights Plan is designed to encourage the fair treatment of shareholders in connection with any takeover offer for the Company.<br />
Rights issued under the plan become exercisable when a person, and any related parties, acquires or commences a take-over bid to acquire<br />
20% or more of the Company’s outstanding common shares without complying with certain provisions set out in the plan or without approval of<br />
the Company’s Board of Directors. Should such an acquisition occur, each rights holder, other than the acquiring person and related parties, will<br />
have the right to purchase common shares of the Company at a 50% discount to the market price at that time. The Shareholder Rights Plan was<br />
continued and amended in <strong>2009</strong>. Amendments were largely administrative in nature. The plan expires in April 2012.<br />
Normal Course Issuer Bid (“NCIB”)<br />
On August 27, <strong>2009</strong>, <strong>Toromont</strong> announced the renewal of its NCIB program. The issuer bid allows the Company to purchase up to<br />
approximately 4.7 million of its common shares, representing 10% of common shares in the public float, in the year ending August 30, 2010.<br />
The actual number of shares purchased and the timing of any such purchases will be determined by <strong>Toromont</strong>. All shares purchased<br />
under the bid will be cancelled. The Company purchased and cancelled 43,400 shares for $858 (average cost of $19.77 per share) in <strong>2009</strong><br />
under its NCIB program which expired on August 30, <strong>2009</strong>. The shares were purchased for an amount higher than their weighted average<br />
book value per share ($1.97 per share) resulting in a reduction of retained earnings of $772. The Company purchased and cancelled<br />
595,600 shares for $12,808 (average cost of $21.50 per share) in 2008.<br />
<strong>2009</strong> 2008<br />
Total shares purchased (number of shares) 43,400 595,600<br />
Average purchase price (per share) $ 19.77 $ 21.50<br />
Total cash paid (thousands) $ 858 $ 12,808<br />
Book value of shares cancelled 86 1,158<br />
Reduction to retained earnings $ 772 $ 11,650<br />
12. CONTRIBUTED SURPLUS<br />
Contributed surplus consists of accumulated stock option expense less the fair value of the options at the grant date that have been<br />
exercised and reclassified to share capital. Changes in contributed surplus were as follows:<br />
<strong>2009</strong> 2008<br />
Balance, beginning of year $ 8,978 $ 7,707<br />
Stock-based compensation expense, net of forfeitures 2,289 2,494<br />
Value of compensation cost associated with exercised options (1,255) (1,223)<br />
Balance, end of year $ 10,012 $ 8,978
13. ACCUMULATED OTHER COMPREHENSIVE INCOME<br />
The changes in accumulated other comprehensive income were as follows:<br />
TOROMONT <strong>2009</strong> ANNUAL REPORT | 65<br />
<strong>2009</strong> 2008<br />
Balance, beginning of year $ 10,899 $ (16,140)<br />
Other comprehensive (loss) income (11,527) 27,039<br />
Balance, end of year $ (628) $ 10,899<br />
As at December 31, accumulated other comprehensive income was comprised of the following amounts:<br />
<strong>2009</strong> 2008<br />
Unrealized (losses) gains on translation of financial statements of self-sustaining foreign operations<br />
(Losses) gains on foreign exchange derivatives designated as cash flow hedges, net of income tax<br />
$ (15,954) $ 7,355<br />
(recovery) expense (<strong>2009</strong> – ($150); 2008 – $1,909) (289) 3,544<br />
Unrealized gain on financial assets designated as available-for-sale (income taxes – Nil) 15,615 –<br />
Balance, end of year $ (628) $ 10,899<br />
The gains and losses on derivative contracts are intended to offset the transaction losses and gains. The losses of $289 will be reclassified<br />
to net income within the next twelve months. These losses will offset gains recorded on the underlying hedged items, namely foreign<br />
denominated accounts payable and accounts receivable. Management intends to hold these foreign currency contracts to maturity.<br />
14. FINANCIAL INSTRUMENTS<br />
Categories of Financial Assets and Liabilities<br />
The carrying values of the Company’s financial instruments are classified into the following categories:<br />
<strong>2009</strong> 2008<br />
Held for trading (1) $ 206,957 $ 137,274<br />
Loans and receivables (2) $ 244,759 $ 375,059<br />
Available for sale assets (3) $ 56,502 $ –<br />
Other financial liabilities (4) $ 396,259 $ 519,593<br />
Derivatives designated as effective hedges gain (loss) (5) $ (440) $ 5,453<br />
Derivatives designated as held for trading gain (loss) (6) $ (434) $ 7,196<br />
(1) Comprised of cash and cash equivalents. All held for trading assets were designated as such upon initial recognition.<br />
(2) Comprised of accounts receivable.<br />
(3) Comprised of investment in marketable securities, reported in other assets.<br />
(4) Comprised of accounts payable and accrued liabilities and long-term debt.<br />
(5) Comprised of the Company’s foreign exchange forward contracts designated as hedges.<br />
(6) Comprised of the Company’s foreign exchange forward contracts that are not designated as hedges for accounting purposes.<br />
Fair Value Measurements<br />
The following table presents information about the Company’s assets and liabilities measured at fair value on a recurring basis as at<br />
December 31, <strong>2009</strong> and indicates the fair value hierarchy of the valuation techniques used to determine such fair value.<br />
Carrying<br />
fair value<br />
Value Level 1 Level 2 Level 3 Total<br />
AssETs<br />
Marketable securities $ 56,502 $ 56,502 $ – $ – $ 56,502<br />
LiABiLiTiEs<br />
Derivative financial instruments $ 874 $ – $ 874 $ – $ 874<br />
Senior debentures $ 155,999 $ – $ 156,993 $ – $ 156,993<br />
The estimated fair values of cash and cash equivalents, accounts receivable, accounts payable and accrued liabilities, borrowings under<br />
the bank term facility and notes payable approximate their respective carrying values.
66 | TOROMONT <strong>2009</strong> ANNUAL REPORT<br />
The fair value of marketable securities is measured based on quoted market prices.<br />
The fair value of derivative financial instruments is measured using a generally accepted valuation technique, that is, the discounted<br />
value of the difference between the contract’s value at maturity based on the foreign exchange rate set out in the contract and the<br />
contract’s value at maturity based on the foreign exchange rate that the financial institution would use if it were to renegotiate the<br />
same contract at December 31, <strong>2009</strong> under the same conditions. The financial institution’s credit risk is also taken into consideration in<br />
determining fair value.<br />
The fair values of senior debentures is measured using a generally accepted valuation technique, that is, the discounted cash flows<br />
using current interest rates for debt with similar terms and remaining maturities. The Company has no plans to prepay these instruments<br />
prior to maturity.<br />
Derivative Financial Instruments and Hedge Accounting<br />
Foreign exchange contracts and options are transacted with financial institutions to hedge foreign currency denominated obligations<br />
related to purchases of inventory and sales of products. The following table summarizes the Company’s commitments to buy and sell<br />
foreign currencies as at December 31, <strong>2009</strong>.<br />
Average<br />
Notional Exchange<br />
Amount Rate Maturity<br />
Purchase contracts USD 73,639 $ 1.0618 January 2010 to December 2010<br />
EUR 2,729 $ 1.5529 January 2010 to June 2010<br />
Sales contracts USD 3,769 $ 1.0609 January 2010 to December 2010<br />
Management estimates that a loss of $874 would be realized if the contracts were terminated on December 31, <strong>2009</strong>. Certain of these<br />
forward contracts are designated as cash flow hedges, and accordingly, a loss of $440 has been included in other comprehensive income.<br />
These losses are not expected to affect net income as the losses will be reclassified to net income within the next twelve months and will<br />
offset gains recorded on the underlying hedged items, namely foreign denominated accounts payable and accounts receivable. A loss of<br />
$434 on forward contracts not designated as hedges is included in net income which offsets gains recorded on the foreign-denominated<br />
items, namely accounts payable and accounts receivable.<br />
All hedging relationships are formally documented, including the risk management objective and strategy. On an ongoing basis, an<br />
assessment is made as to whether the designated derivative financial instruments continue to be effective in offsetting changes in cash<br />
flows of the hedged transactions.<br />
Risks Arising from Financial Instruments and Risk Management<br />
In the normal course of business, <strong>Toromont</strong> is exposed to financial risks that may potentially impact its operating results in either or both<br />
of its business segments. The Company and each operating segment employ risk management strategies with a view to mitigating<br />
these risks on a cost-effective basis. Derivative financial agreements are used to manage exposure to fluctuations in exchange rates and<br />
interest rates. The Company does not enter into derivative financial agreements for speculative purposes.<br />
Currency risk<br />
The Company transacts business in multiple currencies, the most significant of which are the Canadian dollar and the U.S. dollar. As a<br />
result, the Company has foreign currency exposure with respect to items denominated in foreign currencies. The types of foreign exchange<br />
risk can be categorized as follows:<br />
Transaction exposure<br />
The Company sources the majority of its products and major components from the United States. Consequently, reported costs of inventory<br />
and the transaction prices charged to customers for equipment and parts are affected by the relative strength of the Canadian dollar. The<br />
Company mitigates exchange rate risk by entering into foreign currency contracts to fix the cost of imported inventory where appropriate. In<br />
addition, pricing to customers is customarily adjusted to reflect changes in the Canadian dollar landed cost of imported goods.<br />
The Company also sells compression packages in foreign currencies, primarily the U.S. dollar, and enters into foreign currency<br />
contracts to reduce these exchange rate risks.<br />
The Company maintains a conservative hedging policy whereby all significant transactional currency risks are identified and hedged.<br />
Translation exposure<br />
All of the Company’s foreign operations are considered self-sustaining. Accordingly, assets and liabilities are translated into Canadian<br />
dollars using the exchange rates in effect at the balance sheet dates. Unrealized translation gains and losses are deferred and included<br />
in accumulated other comprehensive income. The cumulative currency translation adjustments are recognized in income when there has<br />
been a reduction in the net investment in the foreign operations.
TOROMONT <strong>2009</strong> ANNUAL REPORT | 67<br />
Foreign currency based earnings are translated into Canadian dollars each period. As a result, fluctuations in the value of the<br />
Canadian dollar relative to these other currencies will impact reported net income. Such exchange rate fluctuations have historically not<br />
been material year-over-year relative to the overall earnings or financial position of the Company. A fluctuation of +/- 5%, provided as an<br />
indicative range in a volatile currency environment, would, everything else being equal, have an annualized effect on net income before<br />
tax of approximately +/– $4.5 million.<br />
Sensitivity analysis<br />
The following sensitivity analysis is intended to illustrate the sensitivity to changes in foreign exchange rates on the Company’s financial<br />
instruments and show the impact on net earnings and comprehensive income. Financial instruments affected by currency risk include<br />
cash and cash equivalents, accounts receivable, accounts payable and derivative instruments. This sensitivity analysis relates to the<br />
position as at December 31, <strong>2009</strong>. The following table shows <strong>Toromont</strong>’s sensitivity to a 5% weakening of the Canadian dollar against the<br />
U.S. dollar. A 5% strengthening of the Canadian dollar would have an equal and opposite effect.<br />
Other<br />
Comprehensive<br />
Net earnings Income<br />
Cdn/U.S. dollar exchange rate –5%<br />
– financial instruments in Canadian operations $ 393 $ 1,371<br />
– financial instruments held in foreign operations $ – $ 2,356<br />
The movement in net earnings in Canadian operations is a result of a change in the fair values of financial instruments. The majority of<br />
these financial instruments are hedged.<br />
The movement in other comprehensive income in Canadian operations reflects the change in the fair value of derivative financial<br />
instruments that are designated as cash flow hedges. The gains or losses on these instruments are not expected to affect net income<br />
as the gains or losses will offset losses or gains on the underlying hedged items.<br />
The movement in other comprehensive income in foreign operations reflects the change in the fair value of financial instruments.<br />
Gains or losses on translation of financial instruments held in self-sustaining subsidiaries are deferred in other comprehensive income.<br />
Credit risk<br />
Financial instruments that potentially subject the Company to credit risk consist of cash equivalents, accounts receivable, investments and<br />
derivative financial instruments. The carrying amount of assets included on the balance sheet represents the maximum credit exposure.<br />
Cash equivalents consist mainly of short-term investments, such as money market deposits. No asset-backed commercial paper<br />
products were held. The Company has deposited the cash equivalents with reputable financial institutions, from which management<br />
believes the risk of loss to be remote.<br />
The Company has accounts receivable from customers engaged in various industries including mining, construction, natural gas<br />
production and transportation, food and beverage, and governmental agencies that are not concentrated in any specific geographic<br />
area. These specific industries may be affected by economic factors that may impact accounts receivable. Management does not believe<br />
that any single industry or particular geographic region represents significant credit risk. Credit risk concentration with respect to trade<br />
receivables is mitigated by the Company’s large customer base.<br />
As at December 31, <strong>2009</strong>, $14.3 million or 5.7% of accounts receivable were outstanding for more than 90 days (2008 – $21.9 million<br />
or 5.7%). The movement in the Company’s allowance for doubtful accounts was as follows:<br />
<strong>2009</strong> 2008<br />
Balance, beginning of year $ 9,774 $ 6,501<br />
Change in foreign exchange rates (437) 356<br />
Provisions and revisions, net (2,241) 2,917<br />
Balance, end of year $ 7,096 $ 9,774<br />
The Company minimizes the credit risk of investments by investing excess cash in short-term securities that meet minimum requirements<br />
for quality and liquidity as allowed under the Company’s treasury policy. Other securities may be purchased or disposed of as specifically<br />
approved by the Company’s Board of Directors. Marketable securities at December 31, <strong>2009</strong> are comprised of trust units of Enerflex<br />
Systems Income Fund. The maximum credit risk associated with these financial instruments is represented by their carrying values.<br />
The credit risk associated with derivative financial instruments arises from the possibility that the counterparties may default on their<br />
obligations. In order to minimize this risk, the Company enters into derivative transactions only with highly rated financial institutions.
68 | TOROMONT <strong>2009</strong> ANNUAL REPORT<br />
Interest rate risk<br />
In relation to its debt financing, the Company is exposed to changes in interest rates, which may impact on the Company’s borrowing<br />
costs. Floating rate debt exposes the Company to fluctuations in short-term interest rates. As at December 31, <strong>2009</strong>, $2.1 million or 1%<br />
of the Company’s total debt portfolio was subject to movements in floating interest rates. A +/– 1.0% change in interest rates, which<br />
is indicative of the change in the prime lending rate over the preceding twelve-month period, would, all things being equal, have an<br />
insignificant impact on income before income taxes for the period.<br />
The Company minimizes its interest rate risk by managing its portfolio of floating and fixed rate debt, as well as managing the term<br />
to maturity. The Company may use derivative instruments such as interest rate swap agreements to manage its current and anticipated<br />
exposure to interest rates. There were no interest rate swap agreements outstanding as at December 31, <strong>2009</strong> or 2008.<br />
Liquidity risk<br />
Liquidity risk is the risk that the Company may encounter difficulties in meeting obligations associated with financial liabilities. As at<br />
December 31, <strong>2009</strong>, the Company was holding cash and cash equivalents of $207 million and had unutilized lines of credit of $213 million.<br />
The contractual maturities of the Company’s long-term debt and scheduled interest payments are presented in Note 10.<br />
Accounts payable are primarily due within 90 days and will be satisfied from current working capital.<br />
The Company expects that continued cash flows from operations in 2010, together with cash and cash equivalents on hand and<br />
currently available credit facilities, will be more than sufficient to fund its requirements for investments in working capital, capital assets<br />
and dividend payments.<br />
Market risk<br />
The Company is subject to market risk arising from its investments in marketable securities. Marketable securities are market traded<br />
equity instruments which are accounted for based on their quoted market value. The investments in marketable securities are in publicly<br />
traded markets which are susceptible to significant volatility. To the extent that market prices vary from those at the previous reporting<br />
periods, unrealized gains or losses would be recorded through other comprehensive income/(loss).<br />
15. STOCK-BASED COMPENSATION<br />
The Company maintains an Executive Stock Option Plan for certain employees and directors. Under the plan, options may be granted for up<br />
to 6,096,000 common shares. Stock options have a seven-year term, vest 20% cumulatively on each anniversary date of the grant and are<br />
exercisable at the designated common share price, which is fixed at prevailing market prices of the common shares at the date the option is<br />
granted. Each stock option is exercisable into one common share of the Company at the price specified in the terms of the option.<br />
A reconciliation of the outstanding options is as follows:<br />
Twelve months ended December 31 <strong>2009</strong> 2008<br />
Weighted Weighted<br />
Average Average<br />
Number of Exercise Number of Exercise<br />
Options Price Options Price<br />
Options outstanding, beginning of year 1,917,599 $ 21.62 1,843,359 $ 18.78<br />
Granted 508,000 22.05 384,400 28.76<br />
Exercised (290,190) 11.53 (272,780) 12.15<br />
Forfeited (173,600) 25.14 (37,380) 24.28<br />
Options outstanding, end of year 1,961,809 $ 22.91 1,917,599 $ 21.62<br />
Options exercisable, end of year 900,607 $ 20.85 906,983 $ 17.06<br />
The following table summarizes stock options outstanding and exercisable at December 31, <strong>2009</strong>:<br />
Options Outstanding Options Exercisable<br />
Weighted Weighted Weighted<br />
Range of Average Average Average<br />
Exercise Number Remaining Exercise Number Exercise<br />
Prices Outstanding Life (years) Price Outstanding Price<br />
$10.28 – $10.71 71,420 0.1 $ 10.68 71,420 $ 10.68<br />
$16.59 – $23.34 1,006,149 3.7 20.51 495,519 18.93<br />
$24.58 – $28.84 884,240 4.2 26.63 333,668 25.89<br />
Total 1,961,809 3.8 $ 22.91 900,607 $ 20.85
TOROMONT <strong>2009</strong> ANNUAL REPORT | 69<br />
The fair value of each stock option granted is estimated on the date of grant. The fair value of the stock options was determined using<br />
the Black-Scholes option pricing model with the following assumptions:<br />
<strong>2009</strong> 2008<br />
Weighted average fair value price per option $ 4.55 $ 6.88<br />
Expected life of options (years) 5.80 5.84<br />
Expected stock price volatility 25.0% 25.0%<br />
Expected dividend yield 2.7% 2.0%<br />
Risk-free interest rate 2.0% 3.3%<br />
Deferred Share Unit Plan<br />
The Company offers a deferred share unit (DSU) plan for executives and non-employee directors, whereby they may elect, on an annual<br />
basis, to receive all or a portion of their management incentive award or fees, respectively in deferred share units. In addition, the<br />
Board may grant discretionary DSUs to executives. A DSU is a notional unit that reflects the market value of a single common share of<br />
<strong>Toromont</strong> and generally vests immediately. The DSUs will be redeemed on termination of employment or resignation from the Board, as<br />
the case may be. The redemption amount will be based upon the average of the high and low trading prices of the common shares on<br />
the TSX for the five trading days preceding the redemption date. As at December 31, <strong>2009</strong>, 68,723 units were outstanding at a value of<br />
$1,882 (2008 – 79,476 units at a value of $1,671). The Company records the cost of the DSU Plan as compensation expense. During <strong>2009</strong>,<br />
47,086 units were redeemed for $1,098 (2008 – Nil).<br />
Employee Share Ownership Plan<br />
The Company offers an Employee Share Ownership Plan whereby employees who meet the eligibility criteria can purchase shares by<br />
way of payroll deductions. In 2008, the plan was enhanced to provide a Company match of up to $1,000 per employee per annum based<br />
on contributions by the Company of $1 for every $3 dollars contributed by the employee. Company contributions vest to the employee<br />
immediately. Company contributions amounting to $0.9 million in <strong>2009</strong> (2008 – $0.8 million), were charged to selling and administrative<br />
expense when paid. The Plan is administered by a third party.<br />
16. EMPLOYEE FUTURE BENEFITS<br />
The Company sponsors pension arrangements for substantially all of its employees, primarily through defined contribution plans in Canada<br />
and a 401(k) matched savings plan in the United States. Certain unionized employees do not participate in Company-sponsored plans,<br />
and contributions are made to these union-sponsored plans in accordance with respective collective bargaining agreements. In the case<br />
of the defined contribution plans, regular contributions are made to the employees’ individual accounts, which are administered by a plan<br />
trustee, in accordance with the plan document.<br />
Approximately 5% of participating employees are included in defined benefit plans.<br />
(a) Powell Plan – This is a legacy plan whose members were employees of Powell Equipment when it was acquired by <strong>Toromont</strong> in 2001.<br />
The plan is a contributory plan that provides pension benefits based on length of service and career average earnings. The last<br />
actuarial valuation of the plan was completed as at December 31, 2006. The next valuation is scheduled as at December 31, <strong>2009</strong>.<br />
(b) Executive Plan – This is a non-contributory pension arrangement for certain senior executives that provides for a supplementary<br />
retirement payout in excess of amounts provided for under the registered plan. The most recent actuarial valuation of the plan was<br />
completed as at December 31, <strong>2009</strong>. The next valuation is scheduled as at December 31, 2010.<br />
(c) Other plan assets and obligations – This provides for certain retirees and terminated vested employees of businesses previously<br />
acquired by the Company as well as for retired participants of the defined contribution plan that, in accordance with the plan<br />
provisions, have elected to receive a pension directly from the plan. The most recent actuarial valuation of the plan was completed as<br />
at January 1, <strong>2009</strong>. The next valuation is scheduled as at January 1, 2012.
70 | TOROMONT <strong>2009</strong> ANNUAL REPORT<br />
The changes in the fair value of assets and the pension obligations and the funded status of the defined benefit plans were as follows:<br />
<strong>2009</strong> 2008<br />
AccRUEd BENEfiT OBLigATiONs<br />
Balance, beginning of year $ 61,517 $ 71,529<br />
Transfers – 153<br />
Service cost 1,412 1,570<br />
Interest cost 3,685 3,656<br />
Actuarial loss (gain) 4,538 (7,330)<br />
Benefits paid (5,503) (8,061)<br />
Balance, end of year $ 65,649 $ 61,517<br />
PLAN AssETs<br />
Fair value, beginning of year $ 45,364 $ 58,159<br />
Transfers 15 16<br />
Actual return on plan assets 5,867 (7,482)<br />
Company contributions 2,235 2,280<br />
Participant contributions 422 452<br />
Benefits paid (5,503) (8,061)<br />
Fair value, end of year $ 48,400 $ 45,364<br />
fUNdEd sTATUs Of ThE PLANs $ (17,249) $ (16,153)<br />
Unrecognized actuarial loss 15,785 15,013<br />
Unrecognized past service benefit (887) (1,182)<br />
AccRUEd PENsiON LiABiLiTy $ (2,351) $ (2,322)<br />
The funded status of the Company’s defined benefit pension plans at year-end are as follows:<br />
<strong>2009</strong> 2008<br />
funded Funded<br />
Accrued status – Accrued status –<br />
benefit surplus benefit surplus<br />
obligation Plan assets (deficit) obligation Plan assets (deficit)<br />
Powell Plan $ 38,392 $ 36,583 $ (1,809) $ 35,937 $ 34,646 $ (1,291)<br />
Executive Plan 18,923 2,071 (16,852) 17,868 1,724 (16,144)<br />
Other plan assets and obligations 8,334 9,746 1,412 7,712 8,994 1,282<br />
Funded status of the plans $ 65,649 $ 48,400 $ (17,249) $ 61,517 $ 45,364 $ (16,153)<br />
The Executive Plan is a supplemental pension plan and is solely the obligation of the Company. The Company is not obligated to fund<br />
this plan but is obligated to pay benefits under the terms of the plan as they come due. The Company has posted letters of credit in the<br />
amount of $19.9 million to secure the obligations under this plan.<br />
The significant annual actuarial assumptions adopted in measuring the accrued benefit obligations were as follows:<br />
<strong>2009</strong> 2008<br />
Discount rate 5.75% 6.25%<br />
Expected long-term rate of return on plan assets 7.00% 7.00%<br />
Rate of compensation increase 4.00% 4.00%
The allocations of plan assets are as follows:<br />
TOROMONT <strong>2009</strong> ANNUAL REPORT | 71<br />
<strong>2009</strong> 2008<br />
Equity securities 44.2% 40.5%<br />
Debt securities 43.9% 43.7%<br />
Real estate 11.9% 12.4%<br />
Cash and cash equivalents –% 3.4%<br />
No plan assets are directly invested in the Company’s securities.<br />
The net pension expense for the years ended December 31 included the following components:<br />
<strong>2009</strong> 2008<br />
dEfiNEd BENEfiT PLANs<br />
Service cost $ 990 $ 1,118<br />
Interest cost 3,686 3,656<br />
Actual return on plan assets (5,867) 7,482<br />
Actuarial loss (gain) 4,538 (7,330)<br />
Difference between actual and expected return on assets 2,876 (11,406)<br />
Difference between actual and recognized actuarial loss (3,663) 7,643<br />
Difference between actual and recognized past service benefits (296) (296)<br />
2,264 867<br />
dEfiNEd cONTRiBUTiON PLANs 8,788 9,102<br />
401(K) MATchEd sAviNgs PLAN 787 818<br />
Net pension expense $ 11,839 $ 10,787<br />
The total cash amount paid or payable for employee future benefits in <strong>2009</strong>, including defined benefit and defined contribution plans,<br />
was $12,116 (2008 – $12,343).<br />
17. INCOME TAXES<br />
Significant components of the provision for income tax expense were as follows:<br />
<strong>2009</strong> 2008<br />
Current income tax expense $ 56,283 $ 79,219<br />
Future income tax expense (recovery) 3,093 (8,972)<br />
Total income tax expense $ 59,376 $ 70,247<br />
A reconciliation of income taxes at Canadian statutory rates with the reported income taxes was as follows:<br />
<strong>2009</strong> 2008<br />
Statutory Canadian federal and provincial income tax rates 33.0% 33.5%<br />
Expected taxes on income $ 59,364 $ 70,719<br />
Increase (decrease) in income taxes resulting from:<br />
Lower effective tax rates in other jurisdictions (102) (1,380)<br />
Manufacturing and processing rate reduction (147) (164)<br />
Expenses not deductible for tax purposes 1,138 1,485<br />
Non-taxable gains (93) (794)<br />
Effect of future income tax rate reductions 814 419<br />
Other (1,598) (38)<br />
Provision for income taxes $ 59,376 $ 70,247<br />
Effective income tax rate 33.0% 33.3%
72 | TOROMONT <strong>2009</strong> ANNUAL REPORT<br />
The income tax effects of temporary differences that gave rise to significant portions of the future income tax assets and future income<br />
tax liabilities were as follows:<br />
<strong>2009</strong> 2008<br />
cURRENT fUTURE iNcOME TAx AssETs<br />
Accrued liabilities $ 12,761 $ 14,573<br />
Deferred revenue 2,358 5,772<br />
Accounts receivable 2,490 3,029<br />
Inventories 16,554 12,977<br />
Cash flow hedges in other comprehensive income 163 (1,417)<br />
$ 34,326 $ 34,934<br />
NON-cURRENT fUTURE iNcOME TAx LiABiLiTiEs<br />
Capital assets $ (9,047) $ (9,250)<br />
Other 4,213 5,321<br />
Cash flow hedges in other comprehensive income – (492)<br />
Available for sale financial assets in other comprehensive income (3,090) –<br />
$ (7,924) $ (4,421)<br />
18. EARNINGS PER SHARE<br />
The following table sets forth the computation of basic and diluted earnings per share.<br />
<strong>2009</strong> 2008<br />
Net earnings available to common shareholders $ 120,516 $ 140,524<br />
Weighted average common shares outstanding 64,716,775 65,016,778<br />
Dilutive effect of stock option conversion 114,091 422,268<br />
Diluted weighted average common shares outstanding 64,830,866 65,439,046<br />
BAsic EARNiNgs PER shARE<br />
Continuing operations $ 1.86 $ 2.17<br />
Discontinued operations – (0.01)<br />
$ 1.86 $ 2.16<br />
diLUTEd EARNiNgs PER shARE<br />
Continuing operations $ 1.86 $ 2.16<br />
Discontinued operations – (0.01)<br />
$ 1.86 $ 2.15<br />
In <strong>2009</strong>, 884,240 outstanding stock options with an exercise price range of $24.58 to $28.84 were excluded from the calculation of diluted<br />
earnings per share as these options were anti-dilutive. In 2008, 383,400 outstanding stock options were excluded from the calculation.<br />
19. COMMITMENTS<br />
Certain land, buildings and equipment are leased under several non-cancellable operating leases that require minimum annual payments<br />
as follows:<br />
2010 $ 4,188<br />
2011 3,423<br />
2012 2,492<br />
2013 1,942<br />
2014 1,423<br />
2015 and thereafter 3,881<br />
$ 17,349
TOROMONT <strong>2009</strong> ANNUAL REPORT | 73<br />
20. CAPITAL MANAGEMENT<br />
The Company defines capital as the aggregate of shareholders’ equity (excluding accumulated other comprehensive income) and longterm<br />
debt less cash and cash equivalents.<br />
The Company’s capital management framework is designed to maintain a flexible capital structure that allows for optimization of the<br />
cost of capital at acceptable risk while balancing the interests of both equity and debt holders.<br />
The Company generally targets a net debt to equity ratio of 0.5:1, although there is a degree of variability associated with the timing<br />
of cash flows. Also, if appropriate opportunities are identified, the Company is prepared to significantly increase this ratio depending upon<br />
the opportunity.<br />
The above capital management criteria can be illustrated as follows:<br />
december 31 December 31<br />
<strong>2009</strong> 2008<br />
Shareholders’ equity excluding accumulated other comprehensive income $ 854,691 $ 768,204<br />
Long-term debt 158,095 173,475<br />
Cash and cash equivalents (206,957) (137,274)<br />
Capital under management $ 805,829 $ 804,405<br />
Net debt as a % of capital under management n/m 5%<br />
Net debt to equity ratio n/m 0.05:1<br />
n/m – not meaningful, cash exceeds long-term debt at December 31, <strong>2009</strong><br />
The Company is subject to minimum capital requirements relating to bank credit facilities and senior debentures. The Company has<br />
comfortably met these minimum requirements during the year.<br />
There were no changes in the Company’s approach to capital management during the period.<br />
21. SUPPLEMENTAL CASH FLOW INFORMATION<br />
<strong>2009</strong> 2008<br />
Net change in non-cash working capital and other<br />
Accounts receivable $ 130,300 $ (37,920)<br />
Inventories 126,250 (97,691)<br />
Accounts payable and accrued liabilities (101,028) 61,943<br />
Deferred revenues (104,451) 33,583<br />
Other (31,763) 29,935<br />
$ 19,308 $ (10,150)<br />
Cash paid during the year for:<br />
Interest $ 9,818 $ 12,306<br />
Income taxes $ 77,204 $ 78,604<br />
Non-cash transactions:<br />
Capital asset additions included in accounts payable and accrued liabilities $ 467 $ 460<br />
22. SEGMENTED INFORMATION<br />
The Company has two reportable operating segments, each supported by the corporate office. The business segments are strategic<br />
business units that offer different products and services, and each is managed separately. The corporate office provides finance,<br />
treasury, legal, human resources and other administrative support to the business segments. Corporate overheads are allocated to the<br />
business segments based on operating income.<br />
The Equipment Group includes one of the world’s larger Caterpillar dealerships by revenue and geographic territory in addition<br />
to industry leading rental operations. The Compression Group is a global leader specializing in the design, engineering, fabrication,<br />
and installation of natural gas compression units and hydrocarbon and petrochemical process systems and industrial and recreational<br />
refrigeration systems. Both groups offer comprehensive product support capabilities.<br />
The accounting policies of the reportable operating segments are the same as those described in the summary of significant<br />
accounting policies. Each reportable operating segment’s performance is measured based on operating income. No reportable operating<br />
segment is reliant on any single external customer.
74 | TOROMONT <strong>2009</strong> ANNUAL REPORT<br />
Equipment Group Compression Group Consolidated<br />
<strong>2009</strong> 2008 <strong>2009</strong> 2008 <strong>2009</strong> 2008<br />
Equipment/package sales $ 455,180 $ 648,547 $ 746,741 $ 792,856 $ 1,201,921 $ 1,441,403<br />
Rentals 137,536 151,342 15,238 21,149 152,774 172,491<br />
Product support 278,938 290,431 181,267 207,991 460,205 498,422<br />
Power generation 9,692 8,893 – – 9,692 8,893<br />
Total revenues $ 881,346 $ 1,099,213 $ 943,246 $ 1,021,996 $ 1,824,592 $ 2,121,209<br />
Operating income $ 85,441 $ 108,672 $ 96,911 $ 99,182 $ 182,352 $ 207,854<br />
Interest expense 8,815 11,753<br />
Interest and investment income (6,355) (14,999)<br />
Income taxes 59,376 70,247<br />
Net earnings from continuing operations $ 120,516 $ 140,853<br />
Selected Balance Sheet Information<br />
Equipment Group Compression Group Consolidated<br />
<strong>2009</strong> 2008 <strong>2009</strong> 2008 <strong>2009</strong> 2008<br />
Identifiable assets $ 599,358 $ 731,553 $ 459,572 $ 633,941 $ 1,058,930 $ 1,365,494<br />
Corporate assets 305,737 167,956<br />
Total assets $ 1,364,667 $ 1,533,450<br />
Capital expenditures $ 37,706 $ 65,835 $ 23,335 $ 30,640 $ 61,041 $ 96,475<br />
Depreciation $ 43,104 $ 44,002 $ 15,061 $ 12,068 $ 58,165 $ 56,070<br />
Goodwill $ 13,000 $ 13,000 $ 21,800 $ 21,800 $ 34,800 $ 34,800<br />
Operations are based primarily in Canada and the United States. The following summarizes the final destination of revenues to customers<br />
and the assets held in each geographic segment.<br />
<strong>2009</strong> 2008<br />
Revenues<br />
Canada $ 1,127,929 $ 1,445,302<br />
United States 608,798 606,816<br />
International 87,865 69,091<br />
$ 1,824,592 $ 2,121,209<br />
Capital assets and goodwill<br />
Canada $ 350,596 $ 379,992<br />
United States 53,870 57,455<br />
$ 404,466 $ 437,447<br />
23. ECONOMIC RELATIONSHIP<br />
The Company, through its Equipment Group, sells and services heavy equipment and related parts. Distribution agreements are<br />
maintained with several equipment manufacturers, of which the most significant are with subsidiaries of Caterpillar Inc. The distribution<br />
and servicing of Caterpillar products account for the major portion of the Equipment Group’s operations. <strong>Toromont</strong> has had a strong<br />
relationship with Caterpillar since 1993.
TOROMONT <strong>2009</strong> ANNUAL REPORT | 75<br />
24. SUBSEQUENT EVENT<br />
On January 20, 2010, <strong>Toromont</strong> completed its take-over bid for Enerflex Systems Income Fund (“Enerflex”), acquiring a total of<br />
approximately 42.2 million trust units and exchangeable limited partnership units. Together with the trust units owned by <strong>Toromont</strong> prior<br />
to commencement of the take-over bid, <strong>Toromont</strong> now owns approximately 96% of the outstanding trust units on a fully-diluted basis.<br />
<strong>Toromont</strong> will acquire the balance of the outstanding trust units on February 26, 2010. The total consideration for the Enerflex units<br />
acquired in the take-over bid and the second step transaction is approximately $670 million.<br />
<strong>Toromont</strong> acquired the Enerflex units tendered to its take-over bid with cash and shares, and will acquire the remaining trust units<br />
on the same terms. In the aggregate, <strong>Toromont</strong> will pay approximately $315.6 million in cash and issue 11.9 million common shares for<br />
these units.<br />
The cash consideration of the purchase price along with transaction costs and repayment of $100.6 million in senior secured notes<br />
payable at Enerflex will be largely financed with additional unsecured bank debt under a new term loan facility that <strong>Toromont</strong> closed in<br />
January 2010. Borrowings of up to $450 million are available to <strong>Toromont</strong> under this facility, with draw downs to occur by July 2010 and<br />
are due in July 2011 (eighteen month term). Interest on borrowings is charged at floating rates based on Canadian prime rate or Canadian<br />
Bankers’ Acceptances rate, plus a specified margin.<br />
This acquisition will be accounted for as a business combination with <strong>Toromont</strong> as the acquirer of Enerflex. The purchase method<br />
of accounting will be used and the earnings will be consolidated from the acquisition date. The Company is in the process of finalizing<br />
the estimated fair values of assets acquired and liabilities assumed at the date of acquisition, including goodwill and identifiable<br />
intangible assets. The consolidated results of operations of Enerflex will be included in the Consolidated Statement of Earnings from<br />
January 20, 2010.<br />
Enerflex is a supplier of products and services to the global oil and gas production industry, and has operations in Canada, Australia,<br />
the Netherlands, the United States, Germany, Pakistan, the United Arab Emirates, Egypt, Indonesia and Malaysia.
76 | TOROMONT <strong>2009</strong> ANNUAL REPORT<br />
Ten-Year Financial Review<br />
For the years ended December 31<br />
($ thousands except where otherwise indicated) <strong>2009</strong> 2008 2007 2006<br />
OPERATiNg REsULTs<br />
Revenues 1,824,592 2,121,209 1,886,761 1,746,162<br />
Net earnings 120,516 140,524 122,280 99,421<br />
Net interest expense (income) 2,460 (3,246) 9,331 11,110<br />
Capital expenditures 61,041 96,475 97,108 102,444<br />
Dividends declared 38,848 36,391 31,061 25,594<br />
fiNANciAL POsiTiON<br />
Working capital 539,264 509,276 466,859 469,638<br />
Capital assets 369,666 402,647 341,159 323,504<br />
Total assets 1,364,667 1,533,450 1,356,861 1,299,992<br />
Long-term debt 144,051 158,112 203,425 238,468<br />
Shareholders’ equity 854,063 779,103 654,730 565,556<br />
fiNANciAL RATiOs<br />
Working capital 2.6:1 1.9:1 2.0:1 2.1:1<br />
Return on opening shareholders’ equity (%) 15.5 21.5 21.6 20.6<br />
Total debt net of cash to shareholders’ equity (.06):1 .05:1 .2:1 .4:1<br />
PER shARE dATA ($)<br />
Net earnings – basic 1.86 2.16 1.89 1.56<br />
Net earnings – diluted 1.86 2.15 1.88 1.54<br />
Dividends declared 0.60 0.56 0.48 0.40<br />
Book value (shareholders’ equity) 13.17 12.06 10.08 8.79<br />
Shares outstanding at year end 64,867,467 64,620,677 64,943,497 64,310,377<br />
Price range<br />
High 27.80 32.90 30.00 27.15<br />
Low 19.26 19.03 22.30 20.08<br />
Close 27.79 22.99 28.26 24.50<br />
Notes<br />
(1) Results in 2004 and prior have not been restated to conform with the current year’s presentation.
TOROMONT <strong>2009</strong> ANNUAL REPORT | 77<br />
2005 2004 (1) 2003 2002 2001 2000<br />
1,584,911 1,434,756 1,299,389 1,076,930 911,005 800,464<br />
78,962 70,518 58,693 40,457 43,700 32,345<br />
10,192 10,202 10,608 7,136 (6,913) 3,797<br />
72,813 65,608 72,922 53,042 77,394 57,968<br />
20,280 16,486 13,319 11,541 10,646 9,257<br />
410,990 263,294 203,577 213,222 218,132 165,098<br />
283,407 297,645 293,211 258,764 252,104 206,526<br />
1,143,972 962,437 856,176 771,902 720,702 613,787<br />
241,265 166,508 159,694 156,479 171,970 157,187<br />
481,812 415,855 376,837 335,316 314,248 218,213<br />
2.1:1 1.8:1 1.7:1 1.8:1 2.0:1 1.7:1<br />
18.9 18.7 17.5 12.9 17.1 15.9<br />
.4:1 .4:1 .5:1 .4:1 .5:1 .7:1<br />
1.25 1.11 0.93 0.63 0.71 0.56<br />
1.23 1.09 0.91 0.62 0.70 0.54<br />
0.32 0.26 0.21 0.18 0.17 0.16<br />
7.57 6.59 5.93 5.28 4.90 3.77<br />
63,624,936 63,082,586 63,563,246 63,455,146 64,194,946 57,951,396<br />
25.68 20.85 16.73 13.25 13.10 10.38<br />
20.05 15.88 9.88 9.25 7.63 6.90<br />
25.40 20.72 16.53 10.33 10.24 8.75
78 | TOROMONT <strong>2009</strong> ANNUAL REPORT<br />
Corporate Information<br />
<strong>Toromont</strong> CAT<br />
3131 Highway 7 West<br />
P.O. Box 5511<br />
Concord, Ontario L4K 1B7<br />
T: 416 667 5511<br />
F: 416 667 5555<br />
S.J. Medhurst<br />
President<br />
Enerflex <strong>Ltd</strong>.<br />
1331 Macleod Trail SE<br />
Suite 904<br />
Calgary, Alberta T2G OK3<br />
T: 403 387 6377<br />
F: 403 720 4385<br />
J. B. Goertzen<br />
President and Chief Executive Officer<br />
Officers<br />
Battlefield – The CAT Rental Store<br />
880 South Service Road<br />
Stoney Creek, Ontario L8H 7S8<br />
T: 905 577 7777<br />
F: 905 643 6008<br />
R.B. Casson<br />
President<br />
CIMCO Refrigeration<br />
65 Villiers Street<br />
Toronto, Ontario M5A 3S1<br />
T: 416 465 7581<br />
F: 416 465 8815<br />
S.D. McLeod<br />
President<br />
Robert M. Ogilvie, Chairman and Chief Executive Officer<br />
Paul R. Jewer, Vice President, Finance and Chief Financial Officer<br />
Michael P. Cuddy, Vice President and Chief Information Officer<br />
David C. Wetherald, Vice President, Human Resources and Legal<br />
ANNUAL MEETING<br />
The <strong>Annual</strong> Meeting of the Shareholders<br />
of <strong>Toromont</strong> <strong>Industries</strong> <strong>Ltd</strong>. will be held<br />
at 10:00 am on Thursday, April 22, 2010<br />
in the Imperial Room at the Fairmont<br />
Royal York Hotel, 100 Front Street West,<br />
Toronto, Ontario.
Design and Coordination: Ove Design & Communications www.ovedesign.com<br />
Editorial: BarnesMcInerney Inc.<br />
HOW TO GET IN TOUCH WITH US<br />
Tel: 416 667 5511<br />
Fax: 416 667 5555<br />
E-mail: investorrelations@toromont.com<br />
www.toromont.com<br />
HOW TO REACH OUR TRANSFER AGENT<br />
AND REGISTRAR<br />
Investors are encouraged to contact<br />
CIBC Mellon Trust Company for information<br />
regarding their security holdings.<br />
CIBC Mellon Trust Company<br />
P.O. Box 7010<br />
Adelaide Street Postal Station<br />
Toronto ON M5C 2W9<br />
CANADA<br />
AnswerLine: 416 643 5500 or<br />
Toll-Free North America: 1 800 387 0825<br />
Email: inquiries@cibcmellon.com<br />
www.cibcmellon.com<br />
COMMON SHARES<br />
Listed on the Toronto Stock Exchange<br />
Stock Symbol – TIH<br />
This annual report was printed in Canada on<br />
stock manufactured totally chlorine-free with<br />
10% postconsumer fibre.