2009 Annual Report - Toromont Industries Ltd.
2009 Annual Report - Toromont Industries Ltd.
2009 Annual Report - Toromont Industries Ltd.

Create successful ePaper yourself
Turn your PDF publications into a flip-book with our unique Google optimized e-Paper software.
34 | TOROMONT <strong>2009</strong> ANNUAL REPORT<br />
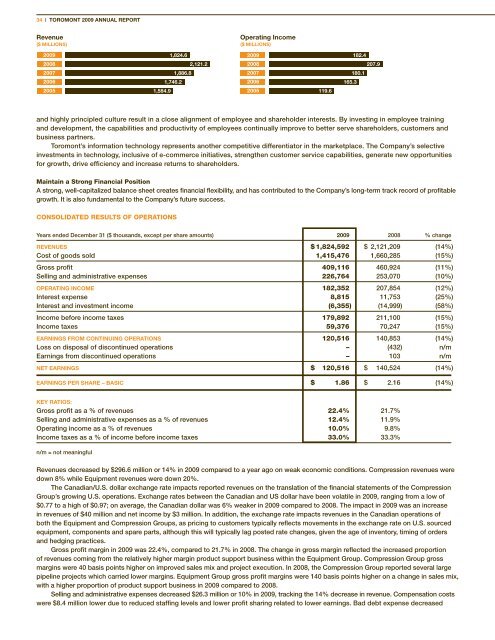
Revenue<br />
($ MiLLiONs)<br />
<strong>2009</strong><br />
2008<br />
2007<br />
2006<br />
2005<br />
and highly principled culture result in a close alignment of employee and shareholder interests. By investing in employee training<br />
and development, the capabilities and productivity of employees continually improve to better serve shareholders, customers and<br />
business partners.<br />
<strong>Toromont</strong>’s information technology represents another competitive differentiator in the marketplace. The Company’s selective<br />
investments in technology, inclusive of e-commerce initiatives, strengthen customer service capabilities, generate new opportunities<br />
for growth, drive efficiency and increase returns to shareholders.<br />
Maintain a Strong Financial Position<br />
A strong, well-capitalized balance sheet creates financial flexibility, and has contributed to the Company’s long-term track record of profitable<br />
growth. It is also fundamental to the Company’s future success.<br />
CONSOLIDATED RESULTS OF OPERATIONS<br />
Years ended December 31 ($ thousands, except per share amounts) <strong>2009</strong> 2008 % change<br />
REvENUEs $ 1,824,592 $ 2,121,209 (14%)<br />
Cost of goods sold 1,415,476 1,660,285 (15%)<br />
Gross profit 409,116 460,924 (11%)<br />
Selling and administrative expenses 226,764 253,070 (10%)<br />
OPERATiNg iNcOME 182,352 207,854 (12%)<br />
Interest expense 8,815 11,753 (25%)<br />
Interest and investment income (6,355) (14,999) (58%)<br />
Income before income taxes 179,892 211,100 (15%)<br />
Income taxes 59,376 70,247 (15%)<br />
EARNiNgs fROM cONTiNUiNg OPERATiONs 120,516 140,853 (14%)<br />
Loss on disposal of discontinued operations – (432) n/m<br />
Earnings from discontinued operations – 103 n/m<br />
NET EARNiNgs $ 120,516 $ 140,524 (14%)<br />
EARNiNgs PER shARE – BAsic $ 1.86 $ 2.16 (14%)<br />
KEy RATiOs:<br />
Gross profit as a % of revenues 22.4% 21.7%<br />
Selling and administrative expenses as a % of revenues 12.4% 11.9%<br />
Operating income as a % of revenues 10.0% 9.8%<br />
Income taxes as a % of income before income taxes 33.0% 33.3%<br />
n/m = not meaningful<br />
1,584.9<br />
1,824.6<br />
1,746.2<br />
1,886.8<br />
2,121.2<br />
Operating income<br />
($ MiLLiONs)<br />
<strong>2009</strong> 182.4<br />
2008<br />
2007<br />
2006<br />
2005<br />
Revenues decreased by $296.6 million or 14% in <strong>2009</strong> compared to a year ago on weak economic conditions. Compression revenues were<br />
down 8% while Equipment revenues were down 20%.<br />
The Canadian/U.S. dollar exchange rate impacts reported revenues on the translation of the financial statements of the Compression<br />
Group’s growing U.S. operations. Exchange rates between the Canadian and US dollar have been volatile in <strong>2009</strong>, ranging from a low of<br />
$0.77 to a high of $0.97; on average, the Canadian dollar was 6% weaker in <strong>2009</strong> compared to 2008. The impact in <strong>2009</strong> was an increase<br />
in revenues of $40 million and net income by $3 million. In addition, the exchange rate impacts revenues in the Canadian operations of<br />
both the Equipment and Compression Groups, as pricing to customers typically reflects movements in the exchange rate on U.S. sourced<br />
equipment, components and spare parts, although this will typically lag posted rate changes, given the age of inventory, timing of orders<br />
and hedging practices.<br />
Gross profit margin in <strong>2009</strong> was 22.4%, compared to 21.7% in 2008. The change in gross margin reflected the increased proportion<br />
of revenues coming from the relatively higher margin product support business within the Equipment Group. Compression Group gross<br />
margins were 40 basis points higher on improved sales mix and project execution. In 2008, the Compression Group reported several large<br />
pipeline projects which carried lower margins. Equipment Group gross profit margins were 140 basis points higher on a change in sales mix,<br />
with a higher proportion of product support business in <strong>2009</strong> compared to 2008.<br />
Selling and administrative expenses decreased $26.3 million or 10% in <strong>2009</strong>, tracking the 14% decrease in revenue. Compensation costs<br />
were $8.4 million lower due to reduced staffing levels and lower profit sharing related to lower earnings. Bad debt expense decreased<br />
119.6<br />
165.3<br />
180.1<br />
207.9