CRC/C/MDG/3-4 - Office of the High Commissioner for Human Rights
CRC/C/MDG/3-4 - Office of the High Commissioner for Human Rights
CRC/C/MDG/3-4 - Office of the High Commissioner for Human Rights

Create successful ePaper yourself
Turn your PDF publications into a flip-book with our unique Google optimized e-Paper software.
<strong>CRC</strong>/C/<strong>MDG</strong>/3-4<br />
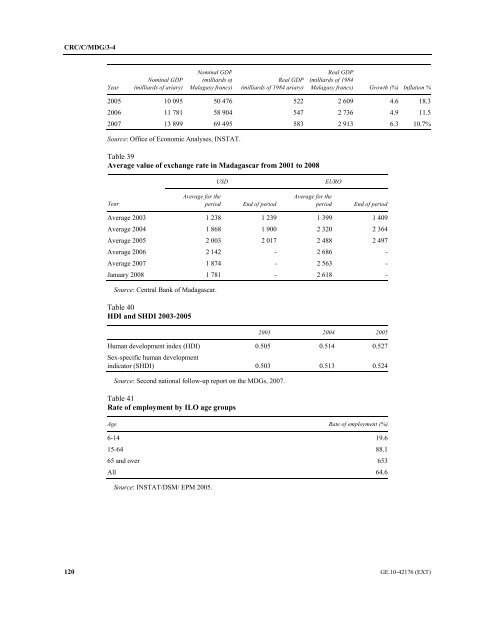
Year<br />
Nominal GDP<br />
(milliards <strong>of</strong> ariary)<br />
Nominal GDP<br />
(milliards <strong>of</strong><br />
Malagasy francs)<br />
Real GDP<br />
(milliards <strong>of</strong> 1984 ariary)<br />
Real GDP<br />
(milliards <strong>of</strong> 1984<br />
Malagasy francs) Growth (%) Inflation %<br />
2005 10 095 50 476 522 2 609 4.6 18.3<br />
2006 11 781 58 904 547 2 736 4.9 11.5<br />
2007 13 899 69 495 583 2 913 6.3 10.7%<br />
Source: <strong>Office</strong> <strong>of</strong> Economic Analyses, INSTAT.<br />
Table 39<br />
Average value <strong>of</strong> exchange rate in Madagascar from 2001 to 2008<br />
Year<br />
USD EURO<br />
Average <strong>for</strong> <strong>the</strong><br />
period End <strong>of</strong> period<br />
Average <strong>for</strong> <strong>the</strong><br />
period End <strong>of</strong> period<br />
Average 2003 1 238 1 239 1 399 1 409<br />
Average 2004 1 868 1 900 2 320 2 364<br />
Average 2005 2 003 2 017 2 488 2 497<br />
Average 2006 2 142 - 2 686 -<br />
Average 2007 1 874 - 2 563 -<br />
January 2008 1 781 - 2 618 -<br />
Source: Central Bank <strong>of</strong> Madagascar.<br />
Table 40<br />
HDI and SHDI 2003-2005<br />
2003 2004 2005<br />
<strong>Human</strong> development index (HDI)<br />
Sex-specific human development<br />
0.505 0.514 0.527<br />
indicator (SHDI) 0.503 0.513 0.524<br />
Source: Second national follow-up report on <strong>the</strong> <strong>MDG</strong>s, 2007.<br />
Table 41<br />
Rate <strong>of</strong> employment by ILO age groups<br />
Age Rate <strong>of</strong> employment (%)<br />
6-14 19.6<br />
15-64 88.1<br />
65 and over 653<br />
All 64.6<br />
Source: INSTAT/DSM/ EPM 2005.<br />
120 GE.10-42176 (EXT)