Confidence Intervals and Sample Size
Confidence Intervals and Sample Size
Confidence Intervals and Sample Size

Create successful ePaper yourself
Turn your PDF publications into a flip-book with our unique Google optimized e-Paper software.
lu49076_ch07.qxd 5/20/2003 3:15 PM Page 325<br />
c h a p t e r<br />
7<br />
<strong>Confidence</strong> <strong>Intervals</strong><br />
<strong>and</strong> <strong>Sample</strong> <strong>Size</strong><br />
Outline<br />
7–1 Introduction<br />
7–2 <strong>Confidence</strong> <strong>Intervals</strong> for the<br />
Mean (s Known or n � 30) <strong>and</strong><br />
<strong>Sample</strong> <strong>Size</strong><br />
7–3 <strong>Confidence</strong> <strong>Intervals</strong> for the<br />
Mean (s Unknown <strong>and</strong> n � 30)<br />
7–4 <strong>Confidence</strong> <strong>Intervals</strong> <strong>and</strong><br />
<strong>Sample</strong> <strong>Size</strong> for Proportions<br />
7–5 <strong>Confidence</strong> <strong>Intervals</strong> for<br />
Variances <strong>and</strong> St<strong>and</strong>ard<br />
Deviations<br />
7–6 Summary<br />
Objectives<br />
After completing this chapter, you<br />
should be able to<br />
1. Find the confidence interval for<br />
the mean when s is known or<br />
n � 30.<br />
2. Determine the minimum sample<br />
size for finding a confidence<br />
interval for the mean.<br />
3. Find the confidence interval for<br />
the mean when s is unknown<br />
<strong>and</strong> n � 30.<br />
4. Find the confidence interval for a<br />
proportion.<br />
5. Determine the minimum sample<br />
size for finding a confidence<br />
interval for a proportion.<br />
6. Find a confidence interval for a<br />
variance <strong>and</strong> a st<strong>and</strong>ard<br />
deviation.<br />
7–1
lu49076_ch07.qxd 5/20/2003 3:15 PM Page 326<br />
326 Chapter 7 <strong>Confidence</strong> <strong>Intervals</strong> <strong>and</strong> <strong>Sample</strong> <strong>Size</strong><br />
7–2<br />
Statistics Today<br />
7–1<br />
Introduction<br />
Would You Change the Channel?<br />
A survey by the Roper Organization found that 45% of the people who were offended<br />
by a television program would change the channel, while 15% would turn off their television<br />
sets. The survey further stated that the margin of error is 3 percentage points <strong>and</strong><br />
4000 adults were interviewed.<br />
Several questions arise:<br />
1. How do these estimates compare with the true population percentages?<br />
2. What is meant by a margin of error of 3 percentage points?<br />
3. Is the sample of 4000 large enough to represent the population of all adults who<br />
watch television in the United States?<br />
After reading this chapter, you will be able to answer these questions, since this<br />
chapter explains how statisticians can use statistics to make estimates of parameters.<br />
Source: The Associated Press.<br />
One aspect of inferential statistics is estimation, which is the process of estimating the<br />
value of a parameter from information obtained from a sample. For example, The Book<br />
of Odds, by Michael D. Shook <strong>and</strong> Robert L. Shook (New York: Penguin Putnam, Inc.),<br />
contains the following statements:<br />
“One out of 4 Americans is currently dieting.” (Calorie Control Council.)
lu49076_ch07.qxd 5/20/2003 3:15 PM Page 327<br />
7–2<br />
<strong>Confidence</strong> <strong>Intervals</strong><br />
for the Mean (S Known<br />
or n ≥ 30) <strong>and</strong> <strong>Sample</strong><br />
<strong>Size</strong><br />
Objective 1. Find the<br />
confidence interval for the<br />
mean when � is known or<br />
n � 30.<br />
Section 7–2 <strong>Confidence</strong> <strong>Intervals</strong> for the Mean (s Known or n � 30) <strong>and</strong> <strong>Sample</strong> <strong>Size</strong> 327<br />
“Seventy-two percent of Americans have flown on commercial airlines.” (“The Bristol<br />
Meyers Report: Medicine in the Next Century.”)<br />
“The average kindergarten student has seen more than 5000 hours of television.” (U.S.<br />
Department of Education.)<br />
“The average school nurse makes $32,786 a year.” (National Association of School Nurses.)<br />
“The average amount of life insurance is $108,000 per household with life insurance.”<br />
(American Council of Life Insurance.)<br />
Since the populations from which these values were obtained are large, these values<br />
are only estimates of the true parameters <strong>and</strong> are derived from data collected from<br />
samples.<br />
The statistical procedures for estimating the population mean, proportion, variance,<br />
<strong>and</strong> st<strong>and</strong>ard deviation will be explained in this chapter.<br />
An important question in estimation is that of sample size. How large should the<br />
sample be in order to make an accurate estimate? This question is not easy to answer<br />
since the size of the sample depends on several factors, such as the accuracy desired <strong>and</strong><br />
the probability of making a correct estimate. The question of sample size will be explained<br />
in this chapter also.<br />
Suppose a college president wishes to estimate the average age of students attending<br />
classes this semester. The president could select a r<strong>and</strong>om sample of 100 students <strong>and</strong><br />
find the average age of these students, say, 22.3 years. From the sample mean, the president<br />
could infer that the average age of all the students is 22.3 years. This type of estimate<br />
is called a point estimate.<br />
A point estimate is a specific numerical value estimate of a parameter. The best point estimate of<br />
the population mean m is the sample mean X .<br />
One might ask why other measures of central tendency, such as the median <strong>and</strong><br />
mode, are not used to estimate the population mean. The reason is that the means of<br />
samples vary less than other statistics (such as medians <strong>and</strong> modes) when many samples<br />
are selected from the same population. Therefore, the sample mean is the best estimate<br />
of the population mean.<br />
<strong>Sample</strong> measures (i.e., statistics) are used to estimate population measures (i.e., parameters).<br />
These statistics are called estimators. As previously stated, the sample mean<br />
is a better estimator of the population mean than the sample median or sample mode.<br />
A good estimator should satisfy the three properties described now.<br />
Three Properties of a Good Estimator<br />
1. The estimator should be an unbiased estimator. That is, the expected value or the mean<br />
of the estimates obtained from samples of a given size is equal to the parameter being<br />
estimated.<br />
2. The estimator should be consistent. For a consistent estimator, as sample size increases,<br />
the value of the estimator approaches the value of the parameter estimated.<br />
3. The estimator should be a relatively efficient estimator. That is, of all the statistics that<br />
can be used to estimate a parameter, the relatively efficient estimator has the smallest<br />
variance.<br />
7–3
lu49076_ch07.qxd 5/20/2003 3:15 PM Page 328<br />
328 Chapter 7 <strong>Confidence</strong> <strong>Intervals</strong> <strong>and</strong> <strong>Sample</strong> <strong>Size</strong><br />
<strong>Confidence</strong> <strong>Intervals</strong><br />
Historical Notes<br />
Point <strong>and</strong> interval<br />
estimates were known as<br />
long ago as the late<br />
1700s. However, it<br />
wasn’t until 1937 that<br />
a mathematician,<br />
J. Neyman, formulated<br />
practical applications<br />
for them.<br />
7–4<br />
As stated in Chapter 6, the sample mean will be, for the most part, somewhat different<br />
from the population mean due to sampling error. Therefore, one might ask a second<br />
question: How good is a point estimate? The answer is that there is no way of knowing<br />
how close the point estimate is to the population mean.<br />
This answer places some doubt on the accuracy of point estimates. For this reason,<br />
statisticians prefer another type of estimate, called an interval estimate.<br />
An interval estimate of a parameter is an interval or a range of values used to estimate the<br />
parameter. This estimate may or may not contain the value of the parameter being estimated.<br />
In an interval estimate, the parameter is specified as being between two values. For<br />
example, an interval estimate for the average age of all students might be 26.9 � m �<br />
27.7, or 27.3 � 0.4 years.<br />
Either the interval contains the parameter or it does not. A degree of confidence<br />
(usually a percent) can be assigned before an interval estimate is made. For instance,<br />
one may wish to be 95% confident that the interval contains the true population mean.<br />
Another question then arises. Why 95%? Why not 99% or 99.5%?<br />
If one desires to be more confident, such as 99% or 99.5% confident, then the interval<br />
must be larger. For example, a 99% confidence interval for the mean age of college<br />
students might be 26.7 � m � 27.9, or 27.3 � 0.6. Hence, a tradeoff occurs. To be<br />
more confident that the interval contains the true population mean, one must make the<br />
interval wider.<br />
The confidence level of an interval estimate of a parameter is the probability that the interval<br />
estimate will contain the parameter.<br />
A confidence interval is a specific interval estimate of a parameter determined by using data<br />
obtained from a sample <strong>and</strong> by using the specific confidence level of the estimate.<br />
<strong>Intervals</strong> constructed in this way are called confidence intervals. Three common<br />
confidence intervals are used: the 90%, the 95%, <strong>and</strong> the 99% confidence intervals.<br />
The algebraic derivation of the formula for determining a confidence interval for a<br />
mean will be shown later. A brief intuitive explanation will be given first.<br />
The central limit theorem states that when the sample size is large, approximately<br />
95% of the sample means will fall within �1.96 st<strong>and</strong>ard errors of the population mean,<br />
that is,<br />
m � 1.96� s<br />
�n �<br />
Now, if a specific sample mean is selected, say, X,<br />
there is a 95% probability that it falls<br />
within the range of m � 1.96(s/ �n).<br />
Likewise, there is a 95% probability that the interval<br />
specified by<br />
X � 1.96� s<br />
�n�<br />
will contain m, as will be shown later. Stated another way,<br />
X � 1.96� s<br />
s<br />
� m � X �<br />
�n� 1.96�<br />
�n�
lu49076_ch07.qxd 5/20/2003 3:15 PM Page 329<br />
Figure 7–1<br />
95% <strong>Confidence</strong> Interval<br />
Section 7–2 <strong>Confidence</strong> <strong>Intervals</strong> for the Mean (s Known or n � 30) <strong>and</strong> <strong>Sample</strong> <strong>Size</strong> 329<br />
Hence, one can be 95% confident that the population mean is contained within that interval<br />
when the values of the variable are normally distributed in the population.<br />
The value used for the 95% confidence interval, 1.96, is obtained from Table E in<br />
Appendix C. For a 99% confidence interval, the value 2.58 is used instead of 1.96 in the<br />
formula. This value is also obtained from Table E <strong>and</strong> is based on the st<strong>and</strong>ard normal<br />
distribution. Since other confidence intervals are used in statistics, the symbol z a/2 (read<br />
“zee sub alpha over two”) is used in the general formula for confidence intervals. The<br />
Greek letter a (alpha) represents the total area in both tails of the st<strong>and</strong>ard normal distribution<br />
curve, <strong>and</strong> a/2 represents the area in each one of the tails. More will be said after<br />
Examples 7–1 <strong>and</strong> 7–2 about finding other values for z a/2.<br />
The relationship between a <strong>and</strong> the confidence level is that the stated confidence<br />
level is the percentage equivalent to the decimal value of 1 � a, <strong>and</strong> vice versa. When<br />
the 95% confidence interval is to be found, a � 0.05, since 1 � 0.05 � 0.95, or 95%.<br />
When a � 0.01, then 1 � a � 1 � 0.01 � 0.99, <strong>and</strong> the 99% confidence interval is being<br />
calculated.<br />
Formula for the <strong>Confidence</strong> Interval of the Mean for a Specific A<br />
X � z ��2� s<br />
�n� � m � X � z ��2� s<br />
�n�<br />
For a 90% confidence interval, z a/2 � 1.65; for a 95% confidence interval, z a/2 � 1.96; <strong>and</strong> for<br />
a 99% confidence interval, z a/2 � 2.58.<br />
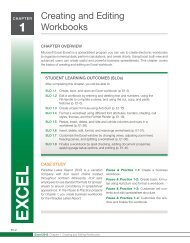
The term za/2(s/ �n)<br />
is called the maximum error of estimate. For a specific value,<br />
say, a � 0.05, 95% of the sample means will fall within this error value on either side<br />
of the population mean, as previously explained. See Figure 7–1.<br />
α = 0.025<br />
2<br />
( )<br />
95%<br />
zα /2<br />
z<br />
n<br />
α = 0.025<br />
2<br />
The maximum error of estimate is the maximum likely difference between the point estimate of a<br />
parameter <strong>and</strong> the actual value of the parameter.<br />
µ<br />
A more detailed explanation of the maximum error of estimate follows Examples<br />
7–1 <strong>and</strong> 7–2, which illustrate the computation of confidence intervals.<br />
( )<br />
σ α /2 σ<br />
Distribution of X’s<br />
n<br />
α = 0.05<br />
7–5
lu49076_ch07.qxd 5/20/2003 3:15 PM Page 330<br />
330 Chapter 7 <strong>Confidence</strong> <strong>Intervals</strong> <strong>and</strong> <strong>Sample</strong> <strong>Size</strong><br />
Example 7–1<br />
Example 7–2<br />
7–6<br />
Rounding Rule for a <strong>Confidence</strong> Interval for a Mean When you are computing a confidence<br />
interval for a population mean by using raw data, round off to one more decimal<br />
place than the number of decimal places in the original data. When you are computing<br />
a confidence interval for a population mean by using a sample mean <strong>and</strong> a st<strong>and</strong>ard deviation,<br />
round off to the same number of decimal places as given for the mean.<br />
The president of a large university wishes to estimate the average age of the students<br />
presently enrolled. From past studies, the st<strong>and</strong>ard deviation is known to be 2 years. A<br />
sample of 50 students is selected, <strong>and</strong> the mean is found to be 23.2 years. Find the 95%<br />
confidence interval of the population mean.<br />
Solution<br />
Since the 95% confidence interval is desired, za/2 � 1.96. Hence, substituting in the<br />
formula<br />
one gets<br />
23.2 � 1.96�<br />
23.2 � 0.6 � m � 23.2 � 0.6<br />
22.6 � m � 23.8<br />
or 23.2 � 0.6 years. Hence, the president can say, with 95% confidence, that the average<br />
age of the students is between 22.6 <strong>and</strong> 23.8 years, based on 50 students.<br />
2<br />
2<br />
� m � 23.2 �<br />
�50� 1.96�<br />
�50�<br />
A survey of 30 adults found that the mean age of a person’s primary vehicle is 5.6 years.<br />
Assuming the st<strong>and</strong>ard deviation of the population is 0.8 year, find the 99% confidence<br />
interval of the population mean.<br />
Source: Based on information in USA TODAY.<br />
Solution<br />
X � z ��2� s<br />
�n� � m � X � z ��2� s<br />
�n�<br />
5.6 � 2.58 � m � 5.6 � 2.58�<br />
5.6 � 0.38 � m � 5.6 � 0.38<br />
5.22 � m � 5.98<br />
or<br />
5.2 � m � 6.0 (rounded)<br />
Hence, one can be 99% confident that the mean age of all primary vehicles is between<br />
5.2 years <strong>and</strong> 6.0 years, based on 30 vehicles.<br />
0.8<br />
� �30�<br />
0.8<br />
�30�<br />
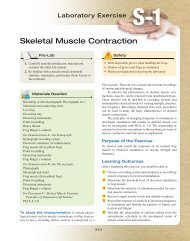
Another way of looking at a confidence interval is shown in Figure 7–2. According<br />
to the central limit theorem, approximately 95% of the sample means fall within 1.96<br />
st<strong>and</strong>ard deviations of the population mean if the sample size is 30 or more or if s is<br />
known when n is less than 30 <strong>and</strong> the population is normally distributed. If it were
lu49076_ch07.qxd 5/20/2003 3:15 PM Page 331<br />
Figure 7–2<br />
95% <strong>Confidence</strong> Interval<br />
for <strong>Sample</strong> Means<br />
Figure 7–3<br />
95% <strong>Confidence</strong> <strong>Intervals</strong><br />
for Each <strong>Sample</strong> Mean<br />
Section 7–2 <strong>Confidence</strong> <strong>Intervals</strong> for the Mean (s Known or n � 30) <strong>and</strong> <strong>Sample</strong> <strong>Size</strong> 331<br />
possible to build a confidence interval about each sample mean, as was done in Examples<br />
7–1 <strong>and</strong> 7–2 for m, 95% of these intervals would contain the population mean, as<br />
shown in Figure 7–3. Hence, one can be 95% confident that an interval built around a<br />
specific sample mean would contain the population mean.<br />
µ � 1.96<br />
σ<br />
( )<br />
µ<br />
n<br />
σ<br />
µ � 1.96( n )<br />
Each represents an X<br />
µ<br />
Each represents an interval about a sample mean<br />
If one desires to be 99% confident, the confidence intervals must be enlarged so that 99<br />
out of every 100 intervals contain the population mean.<br />
7–7<br />
95%
lu49076_ch07.qxd 5/20/2003 3:15 PM Page 332<br />
332 Chapter 7 <strong>Confidence</strong> <strong>Intervals</strong> <strong>and</strong> <strong>Sample</strong> <strong>Size</strong><br />
Figure 7–4<br />
Finding �/2 for a 98%<br />
<strong>Confidence</strong> Interval<br />
Figure 7–5<br />
Finding z �/2 for a 98%<br />
<strong>Confidence</strong> Interval<br />
7–8<br />
Since other confidence intervals (besides 90%, 95%, <strong>and</strong> 99%) are sometimes used in<br />
statistics, an explanation of how to find the values for z a/2 is necessary. As stated<br />
previously, the Greek letter a represents the total of the areas in both tails of the normal<br />
distribution. The value for a is found by subtracting the decimal equivalent for the desired<br />
confidence level from 1. For example, if one wanted to find the 98% confidence interval,<br />
one would change 98% to 0.98 <strong>and</strong> find a � 1 � 0.98, or 0.02. Then a/2 is obtained by<br />
dividing a by 2. So a/2 is 0.02/2, or 0.01. Finally, z 0.01 is the z value that will give an area<br />
of 0.01 in the right tail of the st<strong>and</strong>ard normal distribution curve. See Figure 7–4.<br />
α<br />
2<br />
= 0.01<br />
α = 0.02<br />
α = 0.01<br />
2<br />
–z α /2<br />
0<br />
z α /2<br />
Once a/2 is determined, the corresponding z a/2 value can be found by using the procedure<br />
shown in Chapter 6 (see Example 6–17), which is reviewed here. To get the z a/2<br />
value for a 98% confidence interval, subtract 0.01 from 0.5000 to get 0.4900. Next, locate<br />
the area that is closest to 0.4900 (in this case, 0.4901) in Table E, <strong>and</strong> then find the<br />
corresponding z value. In this example, it is 2.33. See Figure 7–5.<br />
z<br />
0.0<br />
0.1<br />
...<br />
2.3<br />
For confidence intervals, only the positive z value is used in the formula.<br />
When the original variable is normally distributed <strong>and</strong> a is known, the st<strong>and</strong>ard<br />
normal distribution can be used to find confidence intervals regardless of the size of the<br />
sample. When n � 30, the distribution of means will be approximately normal even if<br />
the original distribution of the variable departs from normality. Also, if n � 30 (some<br />
authors use n � 30), s can be substituted for s in the formula for confidence intervals;<br />
<strong>and</strong> the st<strong>and</strong>ard normal distribution can be used to find confidence intervals for means,<br />
as shown in Example 7–3.<br />
0.98<br />
Table E<br />
The St<strong>and</strong>ard Normal Distribution<br />
.00 .01 .02 .03 ... .09<br />
.4901
lu49076_ch07.qxd 5/20/2003 3:16 PM Page 333<br />
Example 7–3<br />
Section 7–2 <strong>Confidence</strong> <strong>Intervals</strong> for the Mean (s Known or n � 30) <strong>and</strong> <strong>Sample</strong> <strong>Size</strong> 333<br />
Solution<br />
The following data represent a sample of the assets (in millions of dollars) of 30<br />
credit unions in southwestern Pennsylvania. Find the 90% confidence interval of<br />
the mean.<br />
12.23 16.56 4.39<br />
2.89 1.24 2.17<br />
13.19 9.16 1.42<br />
73.25 1.91 14.64<br />
11.59 6.69 1.06<br />
8.74 3.17 18.13<br />
7.92 4.78 16.85<br />
40.22 2.42 21.58<br />
5.01 1.47 12.24<br />
2.27 12.77 2.76<br />
Source: Pittsburgh Post Gazette.<br />
STEP 1 Find the mean <strong>and</strong> st<strong>and</strong>ard deviation for the data. Use the formulas shown in<br />
Chapter 3 or your calculator. The mean X � 11.091. The st<strong>and</strong>ard deviation<br />
s � 14.405.<br />
STEP 2 Find a/2. Since the 90% confidence interval is to be used, a � 1 � 0.90 �<br />
0.10, <strong>and</strong><br />
�<br />
2<br />
0.10<br />
� � 0.05<br />
2<br />
STEP 3 Find z a/2. Subtract 0.05 from 0.5000 to get 0.4500. The corresponding z value<br />
obtained from Table E is 1.65. (Note: This value is found by using the z value<br />
for an area between 0.4495 <strong>and</strong> 0.4505. A more precise z value obtained<br />
mathematically is 1.645 <strong>and</strong> is sometimes used; however, 1.65 will be used in<br />
this textbook.)<br />
STEP 4 Substitute in the formula<br />
X � z a� 2� s<br />
�n� � m � X � z a� 2� s<br />
�n�<br />
(Since n � 30, s is used in place of s when s is unknown.)<br />
11.091 � 1.65�<br />
11.091 � 4.339 � m � 11.091 � 4.339<br />
6.752 � m � 15.430<br />
Hence, one can be 90% confident that the population mean of the assets of all credit<br />
unions is between $6.752 million <strong>and</strong> $15.430 million, based on a sample of 30 credit<br />
unions.<br />
14.405<br />
14.405<br />
� � m � 11.091 � 1.65� �<br />
�30 �30<br />
7–9
lu49076_ch07.qxd 5/20/2003 3:16 PM Page 334<br />
334 Chapter 7 <strong>Confidence</strong> <strong>Intervals</strong> <strong>and</strong> <strong>Sample</strong> <strong>Size</strong><br />
<strong>Sample</strong> <strong>Size</strong><br />
Objective 2. Determine the<br />
minimum sample size for<br />
finding a confidence interval<br />
for the mean.<br />
Example 7–4<br />
7–10<br />
Comment to Computer <strong>and</strong> Statistical Calculator Users<br />
This chapter <strong>and</strong> subsequent chapters include examples using raw data. If you are using computer<br />
or calculator programs to find the solutions, the answers you get may vary somewhat<br />
from the ones given in the textbook. This is due to the fact that computers <strong>and</strong> calculators do<br />
not round the answers in the intermediate steps <strong>and</strong> can use 12 or more decimal places for<br />
computation. Also, they use more exact values than those given in the tables in the back of this<br />
book. These discrepancies are part <strong>and</strong> parcel of statistics.<br />
<strong>Sample</strong> size determination is closely related to statistical estimation. Quite often, one<br />
asks, “How large a sample is necessary to make an accurate estimate?” The answer is<br />
not simple, since it depends on three things: the maximum error of estimate, the population<br />
st<strong>and</strong>ard deviation, <strong>and</strong> the degree of confidence. For example, how close to the<br />
true mean does one want to be (2 units, 5 units, etc.), <strong>and</strong> how confident does one wish<br />
to be (90%, 95%, 99%, etc.)? For the purpose of this chapter, it will be assumed that the<br />
population st<strong>and</strong>ard deviation of the variable is known or has been estimated from a previous<br />
study.<br />
The formula for sample size is derived from the maximum error of estimate<br />
formula<br />
<strong>and</strong> this formula is solved for n as follows:<br />
Hence,<br />
E � z ��2� s<br />
�n�<br />
E�n � z ��2 �s�<br />
�n � z ��2 � s<br />
E<br />
n � � z ��2 � s<br />
E � 2<br />
Formula for the Minimum <strong>Sample</strong> <strong>Size</strong> Needed for an Interval Estimate<br />
of the Population Mean<br />
n � � z ��2 � s<br />
E � 2<br />
where E is the maximum error of estimate. If necessary, round the answer up to obtain a whole<br />
number. That is, if there is any fraction or decimal portion in the answer, use the next whole<br />
number for sample size n.<br />
The college president asks the statistics teacher to estimate the average age of the students<br />
at their college. How large a sample is necessary? The statistics teacher would like<br />
to be 99% confident that the estimate should be accurate within 1 year. From a previous<br />
study, the st<strong>and</strong>ard deviation of the ages is known to be 3 years.<br />
Solution<br />
Since a � 0.01 (or 1 � 0.99), za/2 � 2.58, <strong>and</strong> E � 1, substituting in the formula, one gets
lu49076_ch07.qxd 5/20/2003 3:16 PM Page 335<br />
Section 7–2 <strong>Confidence</strong> <strong>Intervals</strong> for the Mean (s Known or n � 30) <strong>and</strong> <strong>Sample</strong> <strong>Size</strong> 335<br />
n � � z��2 � s<br />
E � 2<br />
� � �2.58��3�<br />
1 � 2<br />
� 59.9<br />
which is rounded up to 60. Therefore, to be 99% confident that the estimate is within<br />
1 year of the true mean age, the teacher needs a sample size of at least 60 students.<br />
Notice that when one is finding the sample size, the size of the population is irrelevant<br />
when the population is large or infinite or when sampling is done with replacement.<br />
In other cases, an adjustment is made in the formula for computing sample size. This adjustment<br />
is beyond the scope of this book.<br />
The formula for determining sample size requires the use of the population st<strong>and</strong>ard<br />
deviation. What, then, happens when s is unknown? In this case, an attempt is made to<br />
estimate s. One such way is to use the st<strong>and</strong>ard deviation s obtained from a sample<br />
taken previously as an estimate for s. The st<strong>and</strong>ard deviation can also be estimated by<br />
dividing the range by 4.<br />
Sometimes, interval estimates rather than point estimates are reported. For instance,<br />
one may read a statement such as “On the basis of a sample of 200 families, the survey<br />
estimates that an American family of two spends an average of $84 per week for groceries.<br />
One can be 95% confident that this estimate is accurate within $3 of the true<br />
mean.” This statement means that the 95% confidence interval of the true mean is<br />
$84 � $3 � m � $84 � $3<br />
$81 � m � $87<br />
The algebraic derivation of the formula for a confidence interval is shown next. As<br />
explained in Chapter 6, the sampling distribution of the mean is approximately normal<br />
when large samples (n � 30) are taken from a population. Also,<br />
z �<br />
X � m<br />
s��n<br />
Furthermore, there is a probability of 1 � a that a z will have a value between �z a/2 <strong>and</strong><br />
�z a/2. Hence,<br />
�z ��2 �<br />
Using algebra, one finds<br />
X � m<br />
s��n � z ��2<br />
�z ��2 � s<br />
�n � X � m � z ��2 � s<br />
�n<br />
Subtracting X from both sides <strong>and</strong> from the middle, one gets<br />
�X � z ��2 � s<br />
�n ��m ��X � z ��2 � s<br />
�n<br />
Multiplying by �1, one gets<br />
X � z ��2 � s<br />
�n � m � X � z ��2 � s<br />
�n<br />
Reversing the inequality, one gets the formula for the confidence interval:<br />
X � z��2 � s<br />
�n � m � X � z��2 � s<br />
�n<br />
7–11
lu49076_ch07.qxd 5/20/2003 3:16 PM Page 336<br />
336 Chapter 7 <strong>Confidence</strong> <strong>Intervals</strong> <strong>and</strong> <strong>Sample</strong> <strong>Size</strong><br />
Exercises 7–2<br />
1. What is the difference between a point estimate <strong>and</strong> an<br />
interval estimate of a parameter? Which is better? Why?<br />
2. What information is necessary to calculate a<br />
confidence interval?<br />
3. What is the maximum error of estimate?<br />
4. What is meant by the 95% confidence interval of the<br />
mean?<br />
5. What are three properties of a good estimator?<br />
6. What statistic best estimates m?<br />
7. What is necessary to determine the sample size?<br />
8. When one is determining the sample size for a<br />
confidence interval, is the size of the population relevant?<br />
9. Find each.<br />
a. za/2 for the 99% confidence interval<br />
b. za/2 for the 98% confidence interval<br />
c. za/2 for the 95% confidence interval<br />
d. za/2 for the 90% confidence interval<br />
e. za/2 for the 94% confidence interval<br />
10. Find the 95% confidence interval for the mean<br />
paid attendance at the Major League All-Star games.<br />
A r<strong>and</strong>om sample of the paid attendances is shown.<br />
47,596 68,751 5,838<br />
69,831 28,843 53,107<br />
31,391 48,829 50,706<br />
62,892 55,105 63,974<br />
56,674 38,362 51,549<br />
31,938 31,851 56,088<br />
34,906 38,359 72,086<br />
34,009 50,850 43,801<br />
46,127 49,926 54,960<br />
32,785 48,321 49,671<br />
Source: Time Almanac.<br />
11. A sample of the reading scores of 35 fifth-graders has a<br />
mean of 82. The st<strong>and</strong>ard deviation of the sample is 15.<br />
a. Find the 95% confidence interval of the mean reading<br />
scores of all fifth-graders.<br />
b. Find the 99% confidence interval of the mean reading<br />
scores of all fifth-graders.<br />
c. Which interval is larger? Explain why.<br />
12. Find the 90% confidence interval of the<br />
population mean for the incomes of western<br />
Pennsylvania credit unions. A r<strong>and</strong>om sample of 50 credit<br />
unions is shown. The data are in thous<strong>and</strong>s of dollars.<br />
7–12<br />
84 14 31 72 26<br />
49 252 104 31 8<br />
3 18 72 23 55<br />
133 16 29 225 138<br />
85 24 391 72 158<br />
4340 346 19 5 846<br />
461 254 125 61 123<br />
60 29 10 366 47<br />
28 254 6 77 21<br />
97 6 17 8 82<br />
Source: Pittsburgh Post Gazette.<br />
13. A study of 40 English composition professors showed<br />
that they spent, on average, 12.6 minutes correcting a<br />
student’s term paper.<br />
a. Find the 90% confidence interval of the mean time for<br />
all composition papers when s � 2.5 minutes.<br />
b. If a professor stated that he spent, on average, 30<br />
minutes correcting a term paper, what would be your<br />
reaction?<br />
14. A study of 40 bowlers showed that their average score<br />
was 186. The st<strong>and</strong>ard deviation of the population is 6.<br />
a. Find the 95% confidence interval of the mean score for<br />
all bowlers.<br />
b. Find the 95% confidence interval of the mean score if a<br />
sample of 100 bowlers is used instead of a sample of 40.<br />
c. Which interval is smaller? Explain why.<br />
15. A survey of individuals who passed the seven exams<br />
<strong>and</strong> obtained the rank of Fellow in the actuarial field finds<br />
the average salary to be $150,000. If the st<strong>and</strong>ard deviation<br />
for the sample of 35 Fellows was $15,000, construct a 95%<br />
confidence interval for all Fellows.<br />
Source: BeAnActuary.org.<br />
16. A r<strong>and</strong>om sample of the number of farms (in<br />
thous<strong>and</strong>s) in various states is found below. Estimate<br />
the mean number of farms per state with 90% confidence.<br />
47 95 54 33 64 4 8 57 9 80<br />
8 90 3 49 4 44 79 80 48 16<br />
68<br />
29<br />
7 15 21 52 6 78 109 40 50<br />
Source: N.Y. Times Almanac.<br />
17. Find the 90% confidence interval for the mean<br />
number of local jobs for top corporations in<br />
southwestern Pennsylvania. A sample of 40 selected<br />
corporations is shown.
lu49076_ch07.qxd 5/20/2003 3:16 PM Page 337<br />
7,685 3,100 725 850<br />
11,778 7,300 3,472 540<br />
11,370 5,400 1,570 160<br />
9,953 3,114 2,600 2,821<br />
6,200 3,483 8,954 8<br />
1,000 1,650 1,200 390<br />
1,999 400 3,473 600<br />
1,270 873 400 713<br />
11,960 1,195 2,290 175<br />
887 1,703 4,236 1,400<br />
Source: Pittsburgh Tribune Review.<br />
18. A r<strong>and</strong>om sample of 48 days taken at a large hospital<br />
shows that an average of 38 patients were treated in the<br />
emergency room (ER) per day. The st<strong>and</strong>ard deviation of<br />
the population is 4.<br />
a. Find the 99% confidence interval of the mean number of<br />
ER patients treated each day at the hospital.<br />
b. Find the 99% confidence interval of the mean number of<br />
ER patients treated each day if the st<strong>and</strong>ard deviation<br />
were 8 instead of 4.<br />
c. Why is the confidence interval for part b wider than the<br />
one for part a?<br />
19. Noise levels at various area urban hospitals were<br />
measured in decibels. The mean of the noise levels in 84<br />
corridors was 61.2 decibels, <strong>and</strong> the st<strong>and</strong>ard deviation was<br />
7.9. Find the 95% confidence interval of the true mean.<br />
Source: M. Bayo, A. Garcia, <strong>and</strong> A. Garcia, “Noise Levels in an<br />
Urban Hospital <strong>and</strong> Workers’ Subjective Responses,” Archives of<br />
Environmental Health 50, no. 3, p. 249 (May–June 1995).<br />
Reprinted with permission of the Helen Dwight Reid Educational<br />
Foundation. Published by Heldref Publications, 1319 Eighteenth<br />
St. N.W., Washington, D.C. 20036-1802. Copyright © 1995.<br />
20. The growing seasons for a r<strong>and</strong>om sample of 35 U.S.<br />
cities were recorded, yielding a sample mean of 190.7 days<br />
MINITAB<br />
Step by Step<br />
Section 7–2 <strong>Confidence</strong> <strong>Intervals</strong> for the Mean (s Known or n � 30) <strong>and</strong> <strong>Sample</strong> <strong>Size</strong> 337<br />
Technology Step by Step<br />
<strong>and</strong> a sample st<strong>and</strong>ard deviation of 54.2 days. Estimate the<br />
true mean population of the growing season with 95%<br />
confidence.<br />
Source: The Old Farmer’s Almanac.<br />
21. How many cities’ growing seasons would have to be<br />
sampled in order to estimate the true mean growing season<br />
with 95% confidence within 2 days? (Use the st<strong>and</strong>ard<br />
deviation from Exercise 20.)<br />
22. In the hospital study cited in Exercise 19, the mean<br />
noise level in the 171 ward areas was 58.0 decibels, <strong>and</strong> the<br />
st<strong>and</strong>ard deviation was 4.8. Find the 90% confidence<br />
interval of the true mean.<br />
Source: M. Bayo, A. Garcia, <strong>and</strong> A. Garcia, “Noise Levels in an<br />
Urban Hospital <strong>and</strong> Workers’ Subjective Responses,” Archives of<br />
Environmental Health 50, no. 3, p. 249 (May–June 1995).<br />
Reprinted with permission of the Helen Dwight Reid Educational<br />
Foundation. Published by Heldref Publications, 1319 Eighteenth<br />
St. N.W., Washington, D.C. 20036-1802. Copyright © 1995.<br />
23. An insurance company is trying to estimate the average<br />
number of sick days that full-time food service workers use<br />
per year. A pilot study found the st<strong>and</strong>ard deviation to be<br />
2.5 days. How large a sample must be selected if the<br />
company wants to be 95% confident of getting an interval<br />
that contains the true mean with a maximum error of 1 day?<br />
24. A restaurant owner wishes to find the 99% confidence<br />
interval of the true mean cost of a dry martini. How large<br />
should the sample be if she wishes to be accurate within<br />
$0.10? A previous study showed that the st<strong>and</strong>ard deviation<br />
of the price was $0.12.<br />
25. A health care professional wishes to estimate the birth<br />
weights of infants. How large a sample must she select if<br />
she desires to be 90% confident that the true mean is within<br />
6 ounces of the sample mean? The st<strong>and</strong>ard deviation of the<br />
birth weights is known to be 8 ounces.<br />
Finding a z <strong>Confidence</strong> Interval for the Mean<br />
For Example 7–3, find the 90% confidence<br />
interval estimate for the mean<br />
amount of assets for credit unions in<br />
southwestern Pennsylvania.<br />
1. Maximize the worksheet then enter<br />
the data into C1 of a MINITAB<br />
worksheet. If sigma is known, skip<br />
to step 3.<br />
2. Calculate the st<strong>and</strong>ard deviation for<br />
the sample. It will be used as an<br />
estimate for sigma.<br />
7–13
lu49076_ch07.qxd 5/20/2003 3:16 PM Page 338<br />
338 Chapter 7 <strong>Confidence</strong> <strong>Intervals</strong> <strong>and</strong> <strong>Sample</strong> <strong>Size</strong><br />
TI-83 Plus<br />
Step by Step<br />
7–14<br />
a) Select Calc>Column statistics.<br />
b) Click the option for St<strong>and</strong>ard deviation.<br />
c) Enter C1 Assets for the Input variable <strong>and</strong> s for Store in:.<br />
3. Select Stat>Basic Statistics>1-<strong>Sample</strong> Z.<br />
4. Select C1 Assets for the <strong>Sample</strong>s in Columns.<br />
5. Click in the box for St<strong>and</strong>ard Deviation <strong>and</strong> enter s. Leave the box for Test mean empty.<br />
6. Click the [Options] button. In the dialog box make sure the <strong>Confidence</strong> Level is 90 <strong>and</strong> the<br />
Alternative is not equal.<br />
7. Optional: Click [Graphs], then select Boxplot of data. The boxplot of these data would<br />
clearly show the outliers!<br />
8. Click [OK] twice. The results will be displayed in the session window.<br />
One-<strong>Sample</strong> Z: Assets<br />
The assumed sigma = 14.4054<br />
Variable N Mean StDev SE Mean 90% CI<br />
Assets 30 11.0907 14.4054 2.6301 (6.7646, 15.4167)<br />
Finding a z <strong>Confidence</strong> Interval for the Mean (Data)<br />
1. Enter the data into L1. 2. Press STAT <strong>and</strong> move the cursor to TESTS.<br />
3. Press 7 for ZInterval.<br />
4. Move the cursor to Data <strong>and</strong> press ENTER.<br />
5. Type in the appropriate values.<br />
6. Move the cursor to Calculate <strong>and</strong> press ENTER.<br />
Example TI7–1<br />
This is Example 7–3 from the text. Find the 90% confidence interval for the population mean,<br />
given the data values<br />
12.23 2.89 13.19 73.25 11.59 8.74 7.92 40.22 5.01 2.27<br />
16.56 1.24 9.16 1.91 6.69 3.17 4.78 2.42 1.47 12.77<br />
4.39 2.17 1.42 14.64 1.06 18.13 16.85 21.58 12.24 2.76<br />
The population st<strong>and</strong>ard deviation s is unknown. Since the sample size is n � 30, one can use<br />
the sample st<strong>and</strong>ard deviation s as an approximation for s. After the data values are entered in L1 (step 1 above), press STAT, move the cursor to CALC, press 1 for 1-Var Stats, then press
lu49076_ch07.qxd 5/20/2003 3:16 PM Page 339<br />
Excel<br />
Step by Step<br />
Section 7–2 <strong>Confidence</strong> <strong>Intervals</strong> for the Mean (s Known or n � 30) <strong>and</strong> <strong>Sample</strong> <strong>Size</strong> 339<br />
ENTER. The sample st<strong>and</strong>ard deviation of 14.40544747 will be one of the statistics listed. Then<br />
continue with step 2. At step 5 on the line for s, press VARS for variables, press 5 for Statistics,<br />
press 3 for S x.<br />
The 90% confidence interval is 6.765 � m � 15.417. The difference between these limits <strong>and</strong> the<br />
ones in Example 7–3 is due to rounding.<br />
Finding a z <strong>Confidence</strong> Interval for the Mean (Statistics)<br />
1. Press STAT <strong>and</strong> move the cursor to TESTS.<br />
2. Press 7 for ZInterval.<br />
3. Move the cursor to Stats <strong>and</strong> press ENTER.<br />
4. Type in the appropriate values.<br />
5. Move the cursor to Calculate <strong>and</strong> press ENTER.<br />
Example TI7–2<br />
This is Example 7–1 from the text. Find the 95% confidence interval for the population mean,<br />
given s � 2, X � 23.2, <strong>and</strong> n � 50.<br />
The 95% confidence interval is 22.6 � m � 23.8.<br />
Finding a z <strong>Confidence</strong> Interval for the Mean<br />
Excel has a procedure to produce the maximum error of the estimate. But it does not produce confidence<br />
intervals. However, you may determine confidence intervals for the mean by using the<br />
Mega-Stat Add-in available on your CD <strong>and</strong> Online Learning Center. If you have not installed this<br />
add-in, do so by following the instructions on page 24.<br />
Find the 95% confidence interval when s � 11, using this sample:<br />
43 52 18 20 25 45 43 21 42 32 24 32 19 25 26<br />
44 42 41 41 53 22 25 23 21 27 33 36 47 19 20<br />
1. From the toolbar, select Mega-Stat><strong>Confidence</strong> <strong>Intervals</strong>/<strong>Sample</strong> <strong>Size</strong>.<br />
2. In the dialog box, select the <strong>Confidence</strong> interval mean tab.<br />
3. Enter 32.03 for the mean of the data, <strong>and</strong> then select z. Enter 11 for the st<strong>and</strong>ard deviation<br />
<strong>and</strong> 30 for n, the sample size.<br />
4. Either type in or scroll to 95% for the confidence level, <strong>and</strong> then click [OK].<br />
The result of the procedure is shown next.<br />
7–15
lu49076_ch07.qxd 5/20/2003 3:16 PM Page 340<br />
340 Chapter 7 <strong>Confidence</strong> <strong>Intervals</strong> <strong>and</strong> <strong>Sample</strong> <strong>Size</strong><br />
7–3<br />
<strong>Confidence</strong> <strong>Intervals</strong> for<br />
the Mean (S Unknown<br />
<strong>and</strong> n < 30)<br />
Objective 3. Find the<br />
confidence interval for the<br />
mean when � is unknown <strong>and</strong><br />
n � 30.<br />
Historical Notes<br />
The t distribution was<br />
formulated in 1908 by an<br />
Irish brewing employee<br />
named W. S. Gosset.<br />
Gosset was involved in<br />
researching new methods<br />
of manufacturing ale.<br />
Because brewing<br />
employees were not<br />
allowed to publish results,<br />
Gosset published his<br />
finding using the<br />
pseudonym Student;<br />
hence, the t distribution is<br />
sometimes called<br />
Student’s t distribution.<br />
Figure 7–6<br />
The t Family of Curves<br />
7–16<br />
<strong>Confidence</strong> interval - mean<br />
95% confidence level<br />
32.03 mean<br />
11 std. dev.<br />
30 n<br />
1.960 z<br />
3.936 half-width<br />
35.966 upper confidence limit<br />
28.094 lower confidence limit<br />
When s is known <strong>and</strong> the variable is normally distributed or when s is unknown <strong>and</strong><br />
n � 30, the st<strong>and</strong>ard normal distribution is used to find confidence intervals for the mean.<br />
However, in many situations, the population st<strong>and</strong>ard deviation is not known <strong>and</strong> the<br />
sample size is less than 30. In such situations, the st<strong>and</strong>ard deviation from the sample can<br />
be used in place of the population st<strong>and</strong>ard deviation for confidence intervals. But a<br />
somewhat different distribution, called the t distribution, must be used when the sample<br />
size is less than 30 <strong>and</strong> the variable is normally or approximately normally distributed.<br />
Some important characteristics of the t distribution are described now.<br />
Characteristics of the t Distribution<br />
The t distribution shares some characteristics of the normal distribution <strong>and</strong> differs from it in<br />
others. The t distribution is similar to the st<strong>and</strong>ard normal distribution in these ways.<br />
1. It is bell-shaped.<br />
2. It is symmetric about the mean.<br />
3. The mean, median, <strong>and</strong> mode are equal to 0 <strong>and</strong> are located at the center of the<br />
distribution.<br />
4. The curve never touches the x axis.<br />
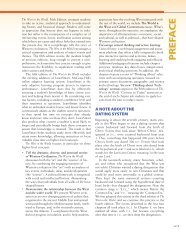
The t distribution differs from the st<strong>and</strong>ard normal distribution in the following ways.<br />
1. The variance is greater than 1.<br />
2. The t distribution is actually a family of curves based on the concept of degrees of<br />
freedom, which is related to sample size.<br />
3. As the sample size increases, the t distribution approaches the st<strong>and</strong>ard normal<br />
distribution. See Figure 7–6.<br />
0<br />
Many statistical distributions use the concept of degrees of freedom, <strong>and</strong> the formulas<br />
for finding the degrees of freedom vary for different statistical tests. The degrees<br />
z<br />
t for d.f. = 20<br />
t for d.f. = 5
lu49076_ch07.qxd 5/20/2003 3:16 PM Page 341<br />
Example 7–5<br />
Figure 7–7<br />
Finding t �/2 for<br />
Example 7–5<br />
Section 7–3 <strong>Confidence</strong> <strong>Intervals</strong> for the Mean (s Unknown or n � 30) 341<br />
of freedom are the number of values that are free to vary after a sample statistic has<br />
been computed, <strong>and</strong> they tell the researcher which specific curve to use when a distribution<br />
consists of a family of curves.<br />
For example, if the mean of 5 values is 10, then 4 of the 5 values are free to vary.<br />
But once 4 values are selected, the fifth value must be a specific number to get a sum of<br />
50, since 50 � 5 � 10. Hence, the degrees of freedom are 5 � 1 � 4, <strong>and</strong> this value tells<br />
the researcher which t curve to use.<br />
The symbol d.f. will be used for degrees of freedom. The degrees of freedom for a<br />
confidence interval for the mean are found by subtracting 1 from the sample size. That<br />
is, d.f. � n � 1. Note: For some statistical tests used later in this book, the degrees of<br />
freedom are not equal to n � 1.<br />
The formula for finding a confidence interval about the mean by using the t distribution<br />
is given now.<br />
Formula for a Specific <strong>Confidence</strong> Interval for the Mean When S Is Unknown<br />
<strong>and</strong> n < 30<br />
X � t ��2� s<br />
�n� � m � X � t ��2� s<br />
�n�<br />
The degrees of freedom are n � 1.<br />
The values for t a/2 are found in Table F in Appendix C. The top row of Table F, labeled<br />
“<strong>Confidence</strong> <strong>Intervals</strong>,” is used to get these values. The other two rows, labeled<br />
“One Tail” <strong>and</strong> “Two Tails,” will be explained in Chapter 8 <strong>and</strong> should not be used here.<br />
Example 7–5 shows how to find the value in Table F for t a/2.<br />
Find the ta/2 value for a 95% confidence interval when the sample size is 22.<br />
Solution<br />
The d.f. � 22 � 1, or 21. Find 21 in the left column <strong>and</strong> 95% in the row labeled “<strong>Confidence</strong><br />
intervals.” The intersection where the two meet gives the value for ta/2, which is<br />
2.080. See Figure 7–7.<br />
d.f.<br />
1<br />
2<br />
3<br />
...<br />
21<br />
...<br />
z ∞<br />
<strong>Confidence</strong><br />
<strong>Intervals</strong><br />
One Tail α<br />
Two Tails α<br />
Table F<br />
The t Distribution<br />
50% 80% 90% 95% 98% 99%<br />
0.25 0.10 0.05 0.025 0.01 0.005<br />
0.50 0.20 0.10 0.05 0.02 0.01<br />
2.080<br />
.674 1.645 1.960<br />
b<br />
1.282 a<br />
2.518<br />
2.326 c<br />
2.831<br />
2.576 d<br />
7–17
lu49076_ch07.qxd 5/20/2003 3:16 PM Page 342<br />
342 Chapter 7 <strong>Confidence</strong> <strong>Intervals</strong> <strong>and</strong> <strong>Sample</strong> <strong>Size</strong><br />
Example 7–6<br />
7–18<br />
Historical Note<br />
Gosset derived the t<br />
distribution by selecting<br />
small r<strong>and</strong>om samples of<br />
measurements taken<br />
from a population of<br />
incarcerated criminals. For<br />
the measures he used the<br />
lengths of one of their<br />
fingers.<br />
Example 7–7<br />
Note: At the bottom of Table F where d.f. ��, the z a/2 values can be found for specific<br />
confidence intervals. The reason is that as the degrees of freedom increase, the<br />
t distribution approaches the st<strong>and</strong>ard normal distribution.<br />
Examples 7–6 <strong>and</strong> 7–7 show how to find the confidence interval when one is using<br />
the t distribution.<br />
Ten r<strong>and</strong>omly selected automobiles were stopped, <strong>and</strong> the tread depth of the right front<br />
tire was measured. The mean was 0.32 inch, <strong>and</strong> the st<strong>and</strong>ard deviation was 0.08 inch.<br />
Find the 95% confidence interval of the mean depth. Assume that the variable is approximately<br />
normally distributed.<br />
Solution<br />
Since s is unknown <strong>and</strong> s must replace it, the t distribution (Table F) must be used for<br />
95% confidence interval. Hence, with 9 degrees of freedom, ta/2 � 2.262.<br />
The 95% confidence interval of the population mean is found by substituting in the<br />
formula<br />
Hence,<br />
0.32 � �2.262� �<br />
0.32 � 0.057 � m � 0.32 � 0.057<br />
0.26 � m � 0.38<br />
Therefore, one can be 95% confident that the population mean tread depth of all right<br />
front tires is between 0.26 <strong>and</strong> 0.38 inch based on a sample of 10 tires.<br />
0.08<br />
�10� � m � 0.32 � �2.262� � 0.08<br />
s<br />
X � t��2� �n�<br />
�10�<br />
� m � X � t��2� s<br />
�n�<br />
The data represent a sample of the number of home fires started by c<strong>and</strong>les for the<br />
past several years. (Data are from the National Fire Protection Association.) Find<br />
the 99% confidence interval for the mean number of home fires started by c<strong>and</strong>les<br />
each year.<br />
5460 5900 6090 6310 7160 8440 9930<br />
Solution<br />
STEP 1 Find the mean <strong>and</strong> st<strong>and</strong>ard deviation for the data.<br />
Use the formulas in Chapter 3 or your calculator.<br />
The mean X � 7041.4.<br />
The st<strong>and</strong>ard deviation s � 1610.3.<br />
STEP 2 Find t a/2 in Table F. Use the 99% confidence interval with d.f. � 6. It is 3.707.<br />
STEP 3 Substitute in the formula <strong>and</strong> solve.<br />
X � t ��2� s<br />
�n� � m � X � t ��2� s<br />
�n�<br />
7041.4 � 3.707�<br />
7041.4 � 2256.2 � m � 7041.4 � 2256.2<br />
4785.2 � m � 9297.6<br />
1610.3<br />
1610.3<br />
� � m � 7041.4 � 3.707� �<br />
�7 �7
lu49076_ch07.qxd 5/20/2003 3:16 PM Page 343<br />
Figure 7–8<br />
When to Use the z or t<br />
Distribution<br />
Exercises 7–3<br />
Section 7–3 <strong>Confidence</strong> <strong>Intervals</strong> for the Mean (s Unknown or n � 30) 343<br />
One can be 99% confident that the population mean of home fires started by<br />
c<strong>and</strong>les each year is between 4785.2 <strong>and</strong> 9297.6, based on a sample of home<br />
fires occurring over a period of 7 years.<br />
Students sometimes have difficulty deciding whether to use z a/2 or t a/2 values when<br />
finding confidence intervals for the mean. As stated previously, when s is known, z a/2<br />
values can be used no matter what the sample size is, as long as the variable is normally<br />
distributed or n � 30. When s is unknown <strong>and</strong> n � 30, s can be used in the formula <strong>and</strong><br />
z a/2 values can be used. Finally, when s is unknown <strong>and</strong> n � 30, s is used in the formula<br />
<strong>and</strong> t a/2 values are used, as long as the variable is approximately normally distributed.<br />
These rules are summarized in Figure 7–8.<br />
Is σ<br />
known?<br />
No<br />
Is n > 30?<br />
No<br />
Use t values <strong>and</strong><br />
α/2<br />
s in the formula.**<br />
1. What are the properties of the t distribution?<br />
2. What is meant by degrees of freedom?<br />
3. When should the t distribution be used to find a<br />
confidence interval for the mean?<br />
4. (ans) Find the values for each.<br />
a. ta/2 <strong>and</strong> n � 18 for the 99% confidence interval for the<br />
mean<br />
b. ta/2 <strong>and</strong> n � 23 for the 95% confidence interval for the<br />
mean<br />
c. ta/2 <strong>and</strong> n � 15 for the 98% confidence interval for the<br />
mean<br />
d. ta/2 <strong>and</strong> n � 10 for the 90% confidence interval for the<br />
mean<br />
e. ta/2 <strong>and</strong> n � 20 for the 95% confidence interval for the<br />
mean<br />
*Variable must be normally distributed when n < 30.<br />
**Variable must be approximately normally distributed.<br />
Yes<br />
Yes<br />
Use z α/2 values<br />
no matter what the sample size is.*<br />
Use z α/2 values <strong>and</strong><br />
s in place of σ in the formula.<br />
It should be pointed out that some statisticians have a different point of view. They<br />
use z a/2 values when s is known <strong>and</strong> t a/2 values when s is unknown. In these circumstances,<br />
a t table that contains t values for sample sizes greater than or equal to 30 would<br />
be needed. The procedure shown in Figure 7–8 is the one used throughout this textbook.<br />
For Exercises 5 through 20, assume that all variables<br />
are approximately normally distributed.<br />
5. The average hemoglobin reading for a sample of 20<br />
teachers was 16 grams per 100 milliliters, with a sample<br />
st<strong>and</strong>ard deviation of 2 grams. Find the 99% confidence<br />
interval of the true mean.<br />
6. A sample of 17 states had these cigarette taxes<br />
(in cents):<br />
112 120 98 55 71 35 99 124 64<br />
150 150 55 100 132 20 70 93<br />
Find a 98% confidence interval for the cigarette tax in all<br />
50 states.<br />
Source: Federation of Tax Administrators.<br />
7–19
lu49076_ch07.qxd 5/20/2003 3:16 PM Page 344<br />
344 Chapter 7 <strong>Confidence</strong> <strong>Intervals</strong> <strong>and</strong> <strong>Sample</strong> <strong>Size</strong><br />
7. A state representative wishes to estimate the<br />
mean number of women representatives per state<br />
legislature. A r<strong>and</strong>om sample of 17 states is selected, <strong>and</strong><br />
the number of women representatives is shown. Based on<br />
the sample, what is the point estimate of the mean? Find the<br />
90% confidence interval of the mean population. (Note:<br />
The population mean is actually 31.72, or about 32.)<br />
Compare this value to the point estimate <strong>and</strong> the confidence<br />
interval. There is something unusual about the data.<br />
Describe it <strong>and</strong> state how it would affect the confidence<br />
interval.<br />
5 33 35 37 24<br />
31 16 45 19 13<br />
18 29 15 39 18<br />
58 132<br />
8. A r<strong>and</strong>om sample of the number of barrels (in<br />
millions) of oil produced per day by world oilproducing<br />
countries is listed here. Estimate the mean oil<br />
production with 95% confidence.<br />
3.56 1.90 7.83 2.83 1.91 5.88 2.91 6.08<br />
Source: N.Y. Times Almanac.<br />
9. A sample of six adult elephants had an average weight<br />
of 12,200 pounds, with a sample st<strong>and</strong>ard deviation of 200<br />
pounds. Find the 95% confidence interval of the true mean.<br />
10. The daily salaries of substitute teachers for eight<br />
local school districts is shown. What is the point<br />
estimate for the mean? Find the 90% confidence interval of<br />
the mean for the salaries of substitute teachers in the region.<br />
60 56 60 55 70 55 60 55<br />
Source: Pittsburgh Tribune Review.<br />
11. A recent study of 28 city residents showed that the<br />
mean of the time they had lived at their present address was<br />
9.3 years. The st<strong>and</strong>ard deviation of the sample was 2<br />
years. Find the 90% confidence interval of the true mean.<br />
12. An automobile shop manager timed six employees <strong>and</strong><br />
found that the average time it took them to change a water<br />
pump was 18 minutes. The st<strong>and</strong>ard deviation of the<br />
sample was 3 minutes. Find the 99% confidence interval of<br />
the true mean.<br />
13. A recent study of 25 students showed that they spent an<br />
average of $18.53 for gasoline per week. The st<strong>and</strong>ard<br />
Extending the Concepts<br />
21. A one-sided confidence interval can be found for<br />
a mean by using<br />
7–20<br />
deviation of the sample was $3.00. Find the 95%<br />
confidence interval of the true mean.<br />
14. For a group of 10 men subjected to a stress situation,<br />
the mean number of heartbeats per minute was 126, <strong>and</strong> the<br />
st<strong>and</strong>ard deviation was 4. Find the 95% confidence interval<br />
of the true mean.<br />
15. For the stress test described in Exercise 14, six women<br />
had an average heart rate of 115 beats per minute. The<br />
st<strong>and</strong>ard deviation of the sample was 6 beats. Find the 95%<br />
confidence interval of the true mean for the women.<br />
16. For a sample of 24 operating rooms taken in the<br />
hospital study mentioned in Exercise 19 in Section 7–2, the<br />
mean noise level was 41.6 decibels, <strong>and</strong> the st<strong>and</strong>ard<br />
deviation was 7.5. Find the 95% confidence interval of the<br />
true mean of the noise levels in the operating rooms.<br />
Source: M. Bayo, A. Garcia, <strong>and</strong> A. Garcia, “Noise Levels in an<br />
Urban Hospital <strong>and</strong> Workers’ Subjective Responses,” Archives of<br />
Environmental Health 50, no. 3, p. 249 (May–June 1995).<br />
Reprinted with permission of the Helen Dwight Reid Educational<br />
Foundation. Published by Heldref Publications, 1319 Eighteenth<br />
St. N.W., Washington, D.C. 20036-1802. Copyright © 1995.<br />
17. The number of grams of carbohydrates in a 12ounce<br />
serving of a regular soft drink is listed here for<br />
a r<strong>and</strong>om sample of sodas. Estimate the mean number of<br />
carbohydrates in all br<strong>and</strong>s of soda with 95% confidence.<br />
48 37 52 40 43 46 41 38<br />
41 45 45 33 35 52 45 41<br />
30 34 46 40<br />
Source: The Doctor’s Pocket Calorie, Fat, <strong>and</strong> Carbohydrate<br />
Counter.<br />
18. For a group of 20 students taking a final exam, the<br />
mean heart rate was 96 beats per minute, <strong>and</strong> the st<strong>and</strong>ard<br />
deviation was 5. Find the 95% confidence interval of the<br />
true mean.<br />
19. The average yearly income for 28 married couples living<br />
in city C is $58,219. The st<strong>and</strong>ard deviation of the sample is<br />
$56. Find the 95% confidence interval of the true mean.<br />
20. The number of unhealthy days based on the AQI<br />
(Air Quality Index) for a r<strong>and</strong>om sample of<br />
metropolitan areas is shown. Construct a 98% confidence<br />
interval based on the data.<br />
61 12 6 40 27 38 93 5 13 40<br />
Source: N.Y. Times Almanac.<br />
s<br />
m � X � t� �n or m � X � t s<br />
�<br />
�n
lu49076_ch07.qxd 5/20/2003 3:16 PM Page 345<br />
where t a is the value found under the row labeled “One<br />
Tail.” Find two one-sided 95% confidence intervals of the<br />
population mean for the data shown <strong>and</strong> interpret the<br />
answers. The data represent the daily revenues in dollars<br />
from 20 parking meters in a small municipality.<br />
MINITAB<br />
Step by Step<br />
Section 7–3 <strong>Confidence</strong> <strong>Intervals</strong> for the Mean (s Unknown or n � 30) 345<br />
Technology Step by Step<br />
Find a t Interval for the Mean<br />
2.60 1.05 2.45 2.90<br />
1.30 3.10 2.35 2.00<br />
2.40 2.35 2.40 1.95<br />
2.80 2.50 2.10 1.75<br />
1.00 2.75 1.80 1.95<br />
For Example 7–7, find the 99% confidence interval for the mean number of home fires started by<br />
c<strong>and</strong>les each year.<br />
1. Type the data into C1 of a MINITAB worksheet. Name the column HomeFires.<br />
2. Select Stat>Basic Statistics>1-<strong>Sample</strong> t.<br />
3. Double-click C1 HomeFires for the <strong>Sample</strong>s in Columns.<br />
4. Click on [Options] <strong>and</strong> be sure the <strong>Confidence</strong> Level is 99 <strong>and</strong> the Alternative is not equal.<br />
5. Click [OK] twice.<br />
6. Check for normality:<br />
a) Select Graph>Probability Plot,<br />
then Single.<br />
b) Select C1 HomeFires for the<br />
variable. The normal plot is<br />
concave, a skewed distribution.<br />
In the session window you will see the<br />
results. The 99% confidence interval estimate<br />
for m is between 500.4 <strong>and</strong> 626.0.<br />
The sample size, mean, st<strong>and</strong>ard deviation,<br />
<strong>and</strong> st<strong>and</strong>ard error of the mean are<br />
also shown.<br />
However, this small sample appears<br />
to have a nonnormal population.<br />
The interval is less likely to contain the true mean.<br />
7–21
lu49076_ch07.qxd 5/20/2003 3:16 PM Page 346<br />
346 Chapter 7 <strong>Confidence</strong> <strong>Intervals</strong> <strong>and</strong> <strong>Sample</strong> <strong>Size</strong><br />
TI-83 Plus<br />
Step by Step<br />
Excel<br />
Step by Step<br />
7–4<br />
<strong>Confidence</strong> <strong>Intervals</strong><br />
<strong>and</strong> <strong>Sample</strong> <strong>Size</strong> for<br />
Proportions<br />
7–22<br />
One-<strong>Sample</strong> T: HomeFires<br />
Variable N Mean StDev SE Mean 99% CI<br />
HomeFires 7 7041.43 1610.27 608.63 (4784.99, 9297.87)<br />
Finding a t <strong>Confidence</strong> Interval for the Mean (Data)<br />
1. Enter the data into L 1.<br />
2. Press STAT <strong>and</strong> move the cursor to TESTS.<br />
3. Press 8 for TInterval.<br />
4. Move the cursor to Data <strong>and</strong> press ENTER.<br />
5. Type in the appropriate values.<br />
6. Move the cursor to Calculate <strong>and</strong> press ENTER.<br />
Finding a t <strong>Confidence</strong> Interval for the Mean (Statistics)<br />
1. Press STAT <strong>and</strong> move the cursor to TESTS.<br />
2. Press 8 for TInterval.<br />
3. Move the cursor to Stats <strong>and</strong> press ENTER.<br />
4. Type in the appropriate values.<br />
5. Move the cursor to Calculate <strong>and</strong> press ENTER.<br />
Finding a t <strong>Confidence</strong> Interval for the Mean<br />
Excel has a procedure to produce the maximum error of the estimate. But it does not produce confidence<br />
intervals. However, you may determine confidence intervals for the mean by using the<br />
Mega-Stat Add-in available on your CD <strong>and</strong> Online Learning Center. If you have not installed this<br />
add-in, do so by following the instructions on page 24.<br />
Find the 95% confidence interval, using this sample:<br />
625 675 535 406 512 680 483 522 619 575<br />
1. From the toolbar, select Mega-Stat><strong>Confidence</strong> <strong>Intervals</strong>/<strong>Sample</strong> <strong>Size</strong>.<br />
2. In the dialog box, select the <strong>Confidence</strong> interval mean tab.<br />
3. Enter 563.2 for the mean of the data, <strong>and</strong> then select t. Enter 87.9 for the st<strong>and</strong>ard deviation<br />
<strong>and</strong> 10 for n, the sample size.<br />
4. Either type in or scroll to 95% for the confidence level, <strong>and</strong> then click [OK].<br />
The result of the procedure will show the output in a new chart as indicated below.<br />
<strong>Confidence</strong> interval - mean<br />
95% confidence level<br />
563.2 mean<br />
87.9 std. dev.<br />
10 n<br />
2.262 t (df � 9)<br />
62.880 half-width<br />
626.080 upper confidence limit<br />
500.320 lower confidence limit<br />
A USA TODAY Snapshots feature stated that 12% of the pleasure boats in the United<br />
States were named Serenity. The parameter 12% is called a proportion. It means that of<br />
all the pleasure boats in the United States, 12 out of every 100 are named Serenity. A proportion<br />
represents a part of a whole. It can be expressed as a fraction, decimal, or per-<br />
12 3<br />
centage. In this case, 12% � 0.12 � or . Proportions can also represent probabilities.<br />
100<br />
25
lu49076_ch07.qxd 5/20/2003 3:16 PM Page 347<br />
Objective 4. Find the<br />
confidence interval for a<br />
proportion.<br />
Example 7–8<br />
Section 7–4 <strong>Confidence</strong> <strong>Intervals</strong> <strong>and</strong> <strong>Sample</strong> <strong>Size</strong> for Proportions 347<br />
In this case, if a pleasure boat is selected at r<strong>and</strong>om, the probability that it is called Serenity<br />
is 0.12.<br />
Proportions can be obtained from samples or populations. The following symbols<br />
will be used.<br />
Symbols Used in Proportion Notation<br />
p � symbol for population proportion<br />
pˆ (read “p hat” ) � symbol for sample proportion<br />
For a sample proportion,<br />
pˆ � X<br />
n<br />
where X � number of sample units that possess the characteristics of interest <strong>and</strong> n � sample<br />
size.<br />
For example, in a study, 200 people were asked if they were satisfied with their job<br />
or profession; 162 said that they were. In this case, n � 200, X � 162, <strong>and</strong> pˆ � X/n �<br />
162/200 � 0.81. It can be said that for this sample, 0.81, or 81%, of those surveyed were<br />
satisfied with their job or profession. The sample proportion is pˆ � 0.81.<br />
The proportion of people who did not respond favorably when asked if they were<br />
satisfied with their job or profession constituted qˆ , where qˆ � (n � X)/n. For this survey,<br />
qˆ � (200 � 162)/200 � 38/200, or 0.19, or 19%.<br />
When pˆ <strong>and</strong> qˆ are given in decimals or fractions, pˆ � qˆ � 1. When pˆ <strong>and</strong> qˆ are<br />
given in percentages, pˆ � qˆ � 100%. It follows, then, that qˆ � 1 � pˆ , or pˆ � 1 � qˆ ,<br />
when pˆ <strong>and</strong> qˆ are in decimal or fraction form. For the sample survey on job satisfaction,<br />
qˆ can also be found by using qˆ � 1 � pˆ , or 1 � 0.81 � 0.19.<br />
Similar reasoning applies to population proportions; that is, p � 1 � q, q � 1 � p,<br />
<strong>and</strong> p � q � 1, when p <strong>and</strong> q are expressed in decimal or fraction form. When p <strong>and</strong> q<br />
are expressed as percentages, p � q � 100%, p � 100% � q, <strong>and</strong> q � 100% � p.<br />
In a recent survey of 150 households, 54 had central air conditioning. Find pˆ <strong>and</strong> qˆ ,<br />
where pˆ is the proportion of households that have central air conditioning.<br />
Solution<br />
Since X � 54 <strong>and</strong> n � 150,<br />
pˆ � X 54<br />
� � 0.36 � 36%<br />
n 150<br />
qˆ �<br />
<strong>and</strong> qˆ � n � X<br />
n<br />
or 1 � pˆ<br />
n � X 150 � 54 96<br />
� � � 0.64 � 64%<br />
n 150 150<br />
One can also find qˆ by using the formula qˆ � 1 � pˆ . In this case, qˆ � 1 � 0.36 � 0.64.<br />
As with means, the statistician, given the sample proportion, tries to estimate the<br />
population proportion. Point <strong>and</strong> interval estimates for a population proportion can be<br />
made by using the sample proportion. For a point estimate of p (the population proportion),<br />
pˆ (the sample proportion) is used. On the basis of the three properties of a good<br />
7–23
lu49076_ch07.qxd 5/20/2003 3:16 PM Page 348<br />
348 Chapter 7 <strong>Confidence</strong> <strong>Intervals</strong> <strong>and</strong> <strong>Sample</strong> <strong>Size</strong><br />
<strong>Confidence</strong> <strong>Intervals</strong><br />
Example 7–9<br />
Example 7–10<br />
7–24<br />
estimator, pˆ is unbiased, consistent, <strong>and</strong> relatively efficient. But as with means, one is<br />
not able to decide how good the point estimate of p is. Therefore, statisticians also use<br />
an interval estimate for a proportion, <strong>and</strong> they can assign a probability that the interval<br />
will contain the population proportion.<br />
To construct a confidence interval about a proportion, one must use the maximum error<br />
of estimate, which is<br />
E � z ��2� pˆqˆ<br />
n<br />
<strong>Confidence</strong> intervals about proportions must meet the criteria that np � 5 <strong>and</strong> nq � 5.<br />
Formula for a Specific <strong>Confidence</strong> Interval for a Proportion<br />
pˆ � z��2� pˆqˆ<br />
n � p � pˆ � z��2� pˆqˆ<br />
n<br />
when np <strong>and</strong> nq are each greater than or equal to 5.<br />
Rounding Rule for a <strong>Confidence</strong> Interval for a Proportion Round off to three decimal places.<br />
A sample of 500 nursing applications included 60 from men. Find the 90% confidence<br />
interval of the true proportion of men who applied to the nursing program.<br />
Solution<br />
Since a � 1 � 0.90 � 0.10 <strong>and</strong> za/2 � 1.65, substituting in the formula<br />
pˆ � z��2� pˆqˆ<br />
n � p � pˆ � z��2� pˆqˆ<br />
n<br />
when pˆ � 60/500 � 0.12 <strong>and</strong> qˆ � 1 � 0.12 � 0.88, one gets<br />
0.12 � 0.024 � p � 0.12 � 0.024<br />
0.096 � p � 0.144<br />
or 9.6% � p � 14.4%<br />
Hence, one can be 90% confident that the percentage of applicants who are men is<br />
between 9.6% <strong>and</strong> 14.4%.<br />
When a specific percentage is given, the percentage becomes pˆ when it is changed<br />
to a decimal. For example, if the problem states that 12% of the applicants were men,<br />
then pˆ � 0.12.<br />
A survey of 200,000 boat owners found that 12% of the pleasure boats were named<br />
Serenity. Find the 95% confidence interval of the true proportion of boats named Serenity.<br />
Source: USA TODAY Snapshot.<br />
0.12 � 1.65 � �0.12��0.88�<br />
500<br />
� p � 0.12 � 1.65 � �0.12��0.88�<br />
500
lu49076_ch07.qxd 5/20/2003 3:16 PM Page 349<br />
<strong>Sample</strong> <strong>Size</strong> for<br />
Proportions<br />
Objective 5. Determine the<br />
minimum sample size for<br />
finding a confidence interval<br />
for a proportion.<br />
Example 7–11<br />
Solution<br />
From the Snapshot, pˆ � 0.12 (i.e., 12%), <strong>and</strong> n � 200,000. Since za/2 � 1.96, substituting<br />
in the formula<br />
�0.12��0.88�<br />
yields 0.12 � 1.96� 200,000 � p � 0.12 � 1.96� �0.12��0.88�<br />
200,000<br />
0.119 � p � 0.121<br />
Hence, one can say with 95% confidence that the true percentage of boats named Serenity<br />
is between 11.9% <strong>and</strong> 12.1%.<br />
To find the sample size needed to determine a confidence interval about a proportion,<br />
use this formula:<br />
Formula for Minimum <strong>Sample</strong> <strong>Size</strong> Needed for Interval Estimate of a Population<br />
Proportion<br />
n � pˆqˆ � z ��2<br />
E � 2<br />
If necessary, round up to obtain a whole number.<br />
This formula can be found by solving the maximum error of estimate value for n:<br />
E � z ��2� pˆqˆ<br />
n<br />
Section 7–4 <strong>Confidence</strong> <strong>Intervals</strong> <strong>and</strong> <strong>Sample</strong> <strong>Size</strong> for Proportions 349<br />
pˆ � z��2� pˆqˆ<br />
n � p � pˆ � z��2� pˆqˆ<br />
n<br />
There are two situations to consider. First, if some approximation of pˆ is known<br />
(e.g., from a previous study), that value can be used in the formula.<br />
Second, if no approximation of pˆ is known, one should use pˆ � 0.5. This value will<br />
give a sample size sufficiently large to guarantee an accurate prediction, given the confidence<br />
interval <strong>and</strong> the error of estimate. The reason is that when pˆ <strong>and</strong> qˆ are each 0.5,<br />
the product pˆ qˆ is at maximum, as shown here.<br />
pˆ<br />
qˆ<br />
pˆ qˆ<br />
0.1 0.9 0.09<br />
0.2 0.8 0.16<br />
0.3 0.7 0.21<br />
0.4 0.6 0.24<br />
0.5 0.5 0.25<br />
0.6 0.4 0.24<br />
0.7 0.3 0.21<br />
0.8 0.2 0.16<br />
0.9 0.1 0.09<br />
A researcher wishes to estimate, with 95% confidence, the proportion of people who<br />
own a home computer. A previous study shows that 40% of those interviewed had a<br />
7–25
lu49076_ch07.qxd 5/20/2003 3:16 PM Page 350<br />
350 Chapter 7 <strong>Confidence</strong> <strong>Intervals</strong> <strong>and</strong> <strong>Sample</strong> <strong>Size</strong><br />
Example 7–12<br />
Exercises 7–4<br />
Source: USA TODAY.<br />
7–26<br />
computer at home. The researcher wishes to be accurate within 2% of the true proportion.<br />
Find the minimum sample size necessary.<br />
Solution<br />
Since za/2 � 1.96, E � 0.02, pˆ � 0.40, <strong>and</strong> qˆ � 0.60, then<br />
n � pˆqˆ � z��2 E � 2<br />
� �0.40��0.60� � 1.96<br />
0.02� 2<br />
� 2304.96<br />
which, when rounded up, is 2305 people to interview.<br />
The same researcher wishes to estimate the proportion of executives who own a car<br />
phone. She wants to be 90% confident <strong>and</strong> be accurate within 5% of the true proportion.<br />
Find the minimum sample size necessary.<br />
Solution<br />
Since there is no prior knowledge of pˆ , statisticians assign the values pˆ � 0.5 <strong>and</strong> qˆ �<br />
0.5. The sample size obtained by using these values will be large enough to ensure the<br />
specified degree of confidence. Hence,<br />
n � pˆqˆ � z��2 E � 2<br />
� �0.5��0.5� � 1.65<br />
0.05� 2<br />
� 272.25<br />
which, when rounded up, is 273 executives to ask.<br />
In determining the sample size, the size of the population is irrelevant. Only the degree<br />
of confidence <strong>and</strong> the maximum error are necessary to make the determination.<br />
1. In each case, find pˆ <strong>and</strong> qˆ .<br />
a. n � 80 <strong>and</strong> X � 40<br />
b. n � 200 <strong>and</strong> X � 90<br />
c. n � 130 <strong>and</strong> X � 60<br />
d. n � 60 <strong>and</strong> X � 35<br />
e. n � 95 <strong>and</strong> X � 43<br />
2. (ans) Find pˆ <strong>and</strong> qˆ for each percentage. (Use each<br />
percentage for pˆ .)<br />
a. 12%<br />
b. 29%<br />
c. 65%<br />
d. 53%<br />
e. 67%<br />
3. AU.S. Travel Data Center survey conducted for Better<br />
Homes <strong>and</strong> Gardens of 1500 adults found that 39% said<br />
that they would take more vacations this year than last year.<br />
Find the 95% confidence interval for the true proportion of<br />
adults who said that they will travel more this year.<br />
4. A recent study of 100 people in Miami found 27 were<br />
obese. Find the 90% confidence interval of the population<br />
proportion of individuals living in Miami who are obese.<br />
Source: Based on information from the Center for Disease Control<br />
<strong>and</strong> Prevention, USA TODAY.<br />
5. The proportion of students in private schools is around<br />
11 percent. A r<strong>and</strong>om sample of 450 students from a wide<br />
geographic area indicated that 55 attended private schools.<br />
Estimate the true proportion of students attending private<br />
schools with 95% confidence. How does your estimate<br />
compare to 11%?<br />
Source: National Center for Education Statistics (nces.ed.gov).<br />
6. The Gallup Poll found that 27% of adults surveyed<br />
nationwide said they had personally been in a tornado. How<br />
many adults should be surveyed to estimate the true<br />
proportion of adults who have been in a tornado with a<br />
95% confidence interval 5% wide?<br />
Source: www.pollingreport.com.
lu49076_ch07.qxd 5/20/2003 3:16 PM Page 351<br />
7. A survey found that out of 200 workers, 168 said they<br />
were interrupted three or more times an hour by phone<br />
messages, faxes, etc. Find the 90% confidence interval of<br />
the population proportion of workers who are interrupted<br />
three or more times an hour.<br />
Source: Based on information from USA TODAY Snapshot.<br />
8. A CBS News/N.Y. Times poll found that 329 out of 763<br />
adults said they would travel to outer space in their lifetime,<br />
given the chance. Estimate the true proportion of adults who<br />
would like to travel to outer space with 92% confidence.<br />
Source: www.pollingreport.com.<br />
9. A study by the University of Michigan found that one<br />
in five 13- <strong>and</strong> 14-year-olds is a sometime smoker. To see<br />
how the smoking rate of the students at a large school<br />
district compared to the national rate, the superintendent<br />
surveyed two hundred 13- <strong>and</strong> 14-year-old students <strong>and</strong><br />
found that 23% said they were sometime smokers. Find the<br />
99% confidence interval of the true proportion <strong>and</strong> compare<br />
this with the University of Michigan’s study.<br />
Source: USA TODAY.<br />
10. A survey of 80 recent fatal traffic accidents showed that<br />
46 were alcohol-related. Find the 95% confidence interval<br />
of the true proportion of fatal alcohol-related accidents.<br />
11. A survey of 90 families showed that 40 owned at least<br />
one gun. Find the 95% confidence interval of the true<br />
proportion of families who own at least one gun.<br />
12. In a certain state, a survey of 500 workers showed that<br />
45% belonged to a union. Find the 90% confidence interval<br />
of the true proportion of workers who belong to a union.<br />
13. In a Gallup Poll of 1005 individuals, 452 thought they<br />
were worse off financially than a year ago. Find the 95%<br />
confidence interval for the true proportion of individuals<br />
that feel they are worse off financially.<br />
Source: Gallup Poll.<br />
14. In a poll of 1000 likely voters, 560 say that the United<br />
States spends too little on fighting hunger at home. Find a<br />
95% confidence interval for the true proportion of voters<br />
who feel this way.<br />
Source: Alliance to End Hunger.<br />
MINITAB<br />
Step by Step<br />
Section 7–4 <strong>Confidence</strong> <strong>Intervals</strong> <strong>and</strong> <strong>Sample</strong> <strong>Size</strong> for Proportions 351<br />
Technology Step by Step<br />
15. A medical researcher wishes to determine the<br />
percentage of females who take vitamins. He wishes to be<br />
99% confident that the estimate is within 2 percentage<br />
points of the true proportion. A recent study of 180 females<br />
showed that 25% took vitamins.<br />
a. How large should the sample size be?<br />
b. If no estimate of the sample proportion is available, how<br />
large should the sample be?<br />
16. A recent study indicated that 29% of the 100 women<br />
over age 55 in the study were widows.<br />
a. How large a sample must one take to be 90% confident<br />
that the estimate is within 0.05 of the true proportion of<br />
women over 55 who are widows?<br />
b. If no estimate of the sample proportion is available, how<br />
large should the sample be?<br />
17. A researcher wishes to estimate the proportion of adult<br />
males who are under 5 feet 5 inches tall. She wants to be<br />
90% confident that her estimate is within 5% of the true<br />
proportion.<br />
a. How large a sample should be taken if in a sample of<br />
300 males, 30 were under 5 feet 5 inches tall?<br />
b. If no estimate of the sample proportion is available, how<br />
large should the sample be?<br />
18. Obesity is defined as a body mass index (BMI) of<br />
3 kg/m2 or more. A 95% confidence interval for the<br />
percentage of U.S. adults aged 20 years <strong>and</strong> over who were<br />
obese was found to be 22.4% to 23.5%. What was the<br />
sample size?<br />
Source: National Center for Health Statistics (www.cdc.gov/nchs).<br />
19. How large a sample should be surveyed to estimate the<br />
true proportion of college students who do laundry once a<br />
week within 3% with 95% confidence?<br />
20. A federal report indicated that 27% of children ages<br />
2 to 5 years had a good diet—an increase over previous<br />
years. How large a sample is needed to estimate the true<br />
proportion of children with good diets within 2% with 95%<br />
confidence?<br />
Source: Federal Interagency Forum on Child <strong>and</strong> Family Statistics,<br />
Washington Observer-Reporter.<br />
Find a <strong>Confidence</strong> Interval for a Proportion<br />
MINITAB will calculate a confidence interval, given the statistics from a sample or given the raw<br />
data. In Example 7–9, in a sample of 500 nursing applications 60 were from men. Find the 90%<br />
confidence interval estimate for the true proportion of male applicants.<br />
7–27
lu49076_ch07.qxd 5/20/2003 3:16 PM Page 352<br />
352 Chapter 7 <strong>Confidence</strong> <strong>Intervals</strong> <strong>and</strong> <strong>Sample</strong> <strong>Size</strong><br />
TI-83 Plus<br />
Step by Step<br />
Excel<br />
Step by Step<br />
7–28<br />
1. Select Stat>Basic Statistics>1 Proportion.<br />
2. Click on the button for Summarized data. No data will be entered in the worksheet.<br />
3. Click in the box for Number of trials <strong>and</strong> enter 500.<br />
4. In the Number of events box, enter 60.<br />
5. Click on [Options].<br />
6. Type 90 for the confidence level.<br />
7. Check the box for Use test <strong>and</strong> interval based on normal distribution.<br />
8. Click [OK] twice.<br />
The results for the confidence interval will be displayed in the session window.<br />
Test <strong>and</strong> CI for One Proportion<br />
Test of p � 0.5 vs p not � 0.<br />
<strong>Sample</strong> X N <strong>Sample</strong> p 90% CI Z-Value P-Value<br />
1 60 500 0.120000 (0.096096, 0.143904) -16.99 0.000<br />
Finding a <strong>Confidence</strong> Interval for a Proportion<br />
1. Press STAT <strong>and</strong> move the cursor to TESTS.<br />
2. Press A (ALPHA, MATH) for 1-PropZlnt.<br />
3. Type in the appropriate values.<br />
4. Move the cursor to Calculate <strong>and</strong> press ENTER.<br />
Example TI7–5<br />
Find the 95% confidence interval of p when X � 60 <strong>and</strong><br />
n � 500, as in Example 7–9.<br />
The 95% confidence level for p is 0.09152 � p �<br />
0.14848. Also pˆ is given.<br />
Finding a <strong>Confidence</strong> Interval for a Proportion<br />
Excel does not produce confidence intervals for a proportion. However, you may determine confidence<br />
intervals for a proportion by using the Mega-Stat Add-in available on your CD <strong>and</strong> Online<br />
Input<br />
Output
lu49076_ch07.qxd 5/20/2003 3:16 PM Page 353<br />
Speaking of<br />
STATISTICS<br />
Here is a survey about college students’ credit card usage.<br />
Suggest several ways that the study could have been<br />
Section 7–4 <strong>Confidence</strong> <strong>Intervals</strong> <strong>and</strong> <strong>Sample</strong> <strong>Size</strong> for Proportions 353<br />
OTHER PEOPLE’S MONEY<br />
Undergrads love their plastic. That<br />
means—you guessed it—students are<br />
learning to become debtors. According to<br />
the Public Interest Research Groups, only<br />
half of all students pay off card balances in<br />
full each month, 36% sometimes do <strong>and</strong><br />
14% never do. Meanwhile, 48% have paid<br />
a late fee. Here's how undergrads stack up,<br />
according to Nellie Mae, a provider of<br />
college loans:<br />
Undergrads with a credit card 78%<br />
Average number of cards owned 3<br />
Average student card debt $1236<br />
Students with 4 or more cards 32%<br />
Balances of $3000 to $7000 13%<br />
Balances over $7000 9%<br />
Reprinted with permission from the January 2002 Reader’s Digest.<br />
Copyright © 2002 by The Reader’s Digest Assn. Inc.<br />
Learning Center. If you have not installed this add-in, do so by following the instructions on<br />
page 24.<br />
There were 500 nursing applications in a sample, including 60 from men. Find the 90% confidence<br />
interval for the true proportion of male applicants.<br />
1. From the toolbar, select Mega-Stat><strong>Confidence</strong> <strong>Intervals</strong>/<strong>Sample</strong> <strong>Size</strong>.<br />
2. In the dialog box, select the <strong>Confidence</strong> interval — p.<br />
3. Enter 60 in the first box; p will automatically switch to x.<br />
4. Enter 500 in the second box for n.<br />
5. Either type in or scroll to 90% for the confidence level, <strong>and</strong> then click [OK].<br />
The result of the procedure will show the output in a new chart, as indicated here.<br />
<strong>Confidence</strong> interval - proportion<br />
90% confidence level<br />
0.12 proportion<br />
500 n<br />
1.645 z<br />
0.024 half-width<br />
0.144 upper confidence limit<br />
0.096 lower confidence limit<br />
more meaningful if confidence intervals had been used.<br />
7–29
lu49076_ch07.qxd 5/20/2003 3:16 PM Page 354<br />
354 Chapter 7 <strong>Confidence</strong> <strong>Intervals</strong> <strong>and</strong> <strong>Sample</strong> <strong>Size</strong><br />
7–5<br />
<strong>Confidence</strong> <strong>Intervals</strong><br />
for Variances <strong>and</strong><br />
St<strong>and</strong>ard Deviations<br />
Objective 6. Find a<br />
confidence interval for a<br />
variance <strong>and</strong> a st<strong>and</strong>ard<br />
deviation.<br />
7–30<br />
Historical Note<br />
The � 2 distribution with 2<br />
degrees of freedom was<br />
formulated by a<br />
mathematician named<br />
Hershel in 1869 while he<br />
was studying the accuracy<br />
of shooting arrows at a<br />
target. Many other<br />
mathematicians have<br />
since contributed to its<br />
development.<br />
In Sections 7–2 through 7–4, confidence intervals were calculated for means <strong>and</strong> proportions.<br />
This section will explain how to find confidence intervals for variances <strong>and</strong> st<strong>and</strong>ard<br />
deviations. In statistics, the variance <strong>and</strong> st<strong>and</strong>ard deviation of a variable are as important<br />
as the mean. For example, when products that fit together (such as pipes) are manufactured,<br />
it is important to keep the variations of the diameters of the products as small as possible;<br />
otherwise, they will not fit together properly <strong>and</strong> will have to be scrapped. In the<br />
manufacture of medicines, the variance <strong>and</strong> st<strong>and</strong>ard deviation of the medication in the<br />
pills play an important role in making sure patients receive the proper dosage. For these<br />
reasons, confidence intervals for variances <strong>and</strong> st<strong>and</strong>ard deviations are necessary.<br />
To calculate these confidence intervals, a new statistical distribution is needed. It is<br />
called the chi-square distribution.<br />
The chi-square variable is similar to the t variable in that its distribution is a family<br />
of curves based on the number of degrees of freedom. The symbol for chi-square is x 2<br />
(Greek letter chi, pronounced “ki”). Several of the distributions are shown in Figure<br />
7–9, along with the corresponding degrees of freedom. The chi-square distribution is obtained<br />
from the values of (n � 1)s 2 /s 2 when r<strong>and</strong>om samples are selected from a normally<br />
distributed population whose variance is s 2 .<br />
A chi-square variable cannot be negative, <strong>and</strong> the distributions are positively<br />
skewed. At about 100 degrees of freedom, the chi-square distribution becomes somewhat<br />
symmetric. The area under each chi-square distribution is equal to 1.00, or 100%.<br />
Table G in Appendix C gives the values for the chi-square distribution. These values<br />
are used in the denominators of the formulas for confidence intervals. Two different<br />
values are used in the formula. One value is found on the left side of the table,<br />
<strong>and</strong> the other is on the right. For example, to find the table values corresponding to the<br />
95% confidence interval, one must first change 95% to a decimal <strong>and</strong> subtract it from
lu49076_ch07.qxd 5/20/2003 3:16 PM Page 355<br />
Figure 7–9<br />
The Chi-Square Family of<br />
Curves<br />
Example 7–13<br />
Figure 7–10<br />
x 2 Table for<br />
Example 7–13<br />
1 (1 � 0.95 � 0.05). Then divide the answer by 2 (a/2 � 0.05/2 � 0.025). This is the<br />
column on the right side of the table, used to get the values for x 2 right. To get the value<br />
for x 2 left, subtract the value of a/2 from 1 (1 � 0.05/2 � 0.975). Finally, find the appropriate<br />
row corresponding to the degrees of freedom n � 1. A similar procedure is<br />
used to find the values for a 90% or 99% confidence interval.<br />
Find the values for x2 right <strong>and</strong> x2 left for a 90% confidence interval when n � 25.<br />
Solution<br />
To find x2 right, subtract 1 � 0.90 � 0.10 <strong>and</strong> divide by 2 to get 0.05.<br />
To find x2 left, subtract 1 � 0.05 to get 0.95. Hence, use the 0.95 <strong>and</strong> 0.05 columns<br />
<strong>and</strong> the row corresponding to 24 d.f. See Figure 7–10.<br />
Degrees of<br />
freedom<br />
1<br />
2<br />
...<br />
24<br />
The answers are<br />
x2 right � 36.415<br />
Section 7–5 <strong>Confidence</strong> <strong>Intervals</strong> for Variances <strong>and</strong> St<strong>and</strong>ard Deviations 355<br />
0.995<br />
d.f. = 1<br />
x 2 left � 13.848<br />
d.f. = 4<br />
0.99 0.975<br />
d.f. = 9<br />
13.848<br />
d.f. = 15<br />
Table G<br />
The Chi-square Distribution<br />
α<br />
0.95 0.90 0.10 0.05 0.025 0.01 0.005<br />
36.415<br />
χ 2 left χ 2 right<br />
Useful estimates for s 2 <strong>and</strong> s are s 2 <strong>and</strong> s, respectively.<br />
χ 2<br />
7–31
lu49076_ch07.qxd 5/20/2003 3:16 PM Page 356<br />
356 Chapter 7 <strong>Confidence</strong> <strong>Intervals</strong> <strong>and</strong> <strong>Sample</strong> <strong>Size</strong><br />
Example 7–14<br />
7–32<br />
To find confidence intervals for variances <strong>and</strong> st<strong>and</strong>ard deviations, one must assume<br />
that the variable is normally distributed.<br />
The formulas for the confidence intervals are shown here.<br />
Formula for the <strong>Confidence</strong> Interval for a Variance<br />
�n � 1�s2 �2 � s<br />
right<br />
2 �n � 1�s2<br />
�<br />
�2 left<br />
d.f. � n � 1<br />
Formula for the <strong>Confidence</strong> Interval for a St<strong>and</strong>ard Deviation<br />
� �n<br />
� 1�s2 �2 �n � 1�s<br />
� s �<br />
right � 2<br />
�2 left<br />
d.f. � n � 1<br />
Recall that s 2 is the symbol for the sample variance <strong>and</strong> s is the symbol for the sample<br />
st<strong>and</strong>ard deviation. If the problem gives the sample st<strong>and</strong>ard deviation s, be sure to<br />
square it when you are using the formula. But if the problem gives the sample variance<br />
s 2 , do not square it when using the formula, since the variance is already in square units.<br />
Rounding Rule for a <strong>Confidence</strong> Interval for a Variance or St<strong>and</strong>ard Deviation When you are<br />
computing a confidence interval for a population variance or st<strong>and</strong>ard deviation by using<br />
raw data, round off to one more decimal place than the number of decimal places in<br />
the original data.<br />
When you are computing a confidence interval for a population variance or st<strong>and</strong>ard<br />
deviation by using a sample variance or st<strong>and</strong>ard deviation, round off to the same<br />
number of decimal places as given for the sample variance or st<strong>and</strong>ard deviation.<br />
Example 7–14 shows how to find a confidence interval for a variance <strong>and</strong> st<strong>and</strong>ard<br />
deviation.<br />
Find the 95% confidence interval for the variance <strong>and</strong> st<strong>and</strong>ard deviation of the nicotine<br />
content of cigarettes manufactured if a sample of 20 cigarettes has a st<strong>and</strong>ard deviation<br />
of 1.6 milligrams.<br />
Solution<br />
Since a � 0.05, the two critical values, respectively, for the 0.025 <strong>and</strong> 0.975 levels for<br />
19 degrees of freedom are 32.852 <strong>and</strong> 8.907. The 95% confidence interval for the variance<br />
is found by substituting in the formula:<br />
�n � 1�s 2<br />
� 2 right<br />
� s2 �n � 1�s2<br />
�<br />
�2 left<br />
�20 � 1��1.6�2 32.852<br />
� s2 �20 � 1��1.6�2<br />
�<br />
8.907<br />
1.5 � s 2 � 5.5
lu49076_ch07.qxd 5/20/2003 3:16 PM Page 357<br />
Example 7–15<br />
Exercises 7–5<br />
Hence, one can be 95% confident that the true variance for the nicotine content is<br />
between 1.5 <strong>and</strong> 5.5.<br />
For the st<strong>and</strong>ard deviation, the confidence interval is<br />
�1.5 � s � �5.5<br />
1.2 � s � 2.3<br />
Hence, one can be 95% confident that the true st<strong>and</strong>ard deviation for the nicotine content<br />
of all cigarettes manufactured is between 1.2 <strong>and</strong> 2.3 milligrams based on a sample<br />
of 20 cigarettes.<br />
Find the 90% confidence interval for the variance <strong>and</strong> st<strong>and</strong>ard deviation for the<br />
price in dollars of an adult single-day ski lift ticket. The data represent a selected<br />
sample of nationwide ski resorts. Assume the variable is normally distributed.<br />
59 54 53 52 51<br />
39 49 46 49 48<br />
Source: USA TODAY.<br />
Solution<br />
Section 7–5 <strong>Confidence</strong> <strong>Intervals</strong> for Variances <strong>and</strong> St<strong>and</strong>ard Deviations 357<br />
STEP 1 Find the variance for the data. Use the formulas in Chapter 3 or your<br />
calculator. The variance s 2 � 28.2.<br />
STEP 2 Find x 2 right <strong>and</strong> x 2 left from Table G in Appendix C. Since a � 0.10, the two<br />
critical values are 3.325 <strong>and</strong> 16.919, using d.f. � 9 <strong>and</strong> 0.95 <strong>and</strong> 0.05.<br />
STEP 3 Substitute in the formula <strong>and</strong> solve.<br />
�n � 1�s2 �2 � s<br />
right<br />
2 �n � 1�s2<br />
�<br />
�2 left<br />
�10 � 1��28.2�<br />
16.919<br />
� s2 �10 � 1��28.2�<br />
�<br />
3.325<br />
15.0 � s2 � 76.3<br />
For the st<strong>and</strong>ard deviation<br />
�15 � s � �76.3<br />
3.87 � s � 8.73<br />
Hence one can be 90% confident that the st<strong>and</strong>ard deviation for the price of all single-day<br />
ski lift tickets of the population is between $3.87 <strong>and</strong> $8.73 based on a sample of 10 nationwide<br />
ski resorts. (Two decimal places are used since the data are in dollars <strong>and</strong> cents.)<br />
Note: If you are using the st<strong>and</strong>ard deviation instead (as in Example 7–14) of the<br />
variance, be sure to square the st<strong>and</strong>ard deviation when substituting in the formula.<br />
1. What distribution must be used when computing<br />
confidence intervals for variances <strong>and</strong> st<strong>and</strong>ard deviations?<br />
2. What assumption must be made when computing<br />
confidence intervals for variances <strong>and</strong> st<strong>and</strong>ard deviations?<br />
7–33
lu49076_ch07.qxd 5/20/2003 3:16 PM Page 358<br />
358 Chapter 7 <strong>Confidence</strong> <strong>Intervals</strong> <strong>and</strong> <strong>Sample</strong> <strong>Size</strong><br />
3. Using Table G, find the values for x2 left <strong>and</strong> x2 right.<br />
a. a � 0.05, n � 16<br />
b. a � 0.10, n � 5<br />
c. a � 0.01, n � 23<br />
d. a � 0.05, n � 29<br />
e. a � 0.10, n � 14<br />
4. Find the 95% confidence interval for the variance <strong>and</strong><br />
st<strong>and</strong>ard deviation for the lifetime of batteries if a sample<br />
of 20 batteries has a st<strong>and</strong>ard deviation of 1.7 months.<br />
Assume the variable is normally distributed.<br />
5. Find the 90% confidence interval for the variance <strong>and</strong><br />
st<strong>and</strong>ard deviation for the time it takes an inspector to<br />
check a bus for safety if a sample of 27 buses has a<br />
st<strong>and</strong>ard deviation of 6.8 minutes. Assume the variable is<br />
normally distributed.<br />
6. Find the 99% confidence interval for the variance <strong>and</strong><br />
st<strong>and</strong>ard deviation of the weights of 25 one-gallon<br />
containers of motor oil if a sample of 14 containers has a<br />
variance of 3.2. The weights are given in ounces. Assume<br />
the variable is normally distributed.<br />
7. The sugar content (in grams) for a r<strong>and</strong>om<br />
sample of 4-ounce containers of applesauce is shown.<br />
Find the 99% confidence interval for the population<br />
variance <strong>and</strong> st<strong>and</strong>ard deviation. Assume the variable is<br />
normally distributed.<br />
18.6 19.5 20.2 20.4 19.3<br />
21.0 20.3 19.6 20.7 18.9<br />
22.1 19.7 20.8 18.9 20.7<br />
21.6 19.5 20.1 20.3 19.9<br />
8. Find the 90% confidence interval for the variance <strong>and</strong><br />
st<strong>and</strong>ard deviation of the ages of seniors at Oak Park<br />
College if a sample of 24 students has a st<strong>and</strong>ard deviation<br />
of 2.3 years. Assume the variable is normally distributed.<br />
Extending the Concepts<br />
13. A confidence interval for a st<strong>and</strong>ard deviation for large<br />
samples taken from a normally distributed population can<br />
be approximated by<br />
s<br />
s � z��2 �2n � s � s � z s<br />
��2<br />
�2n<br />
TI-83 Plus<br />
Step by Step<br />
7–34<br />
Technology Step by Step<br />
9. The number of calories in a 1-ounce serving of<br />
various kinds of regular cheese is shown. Estimate the<br />
population variance <strong>and</strong> st<strong>and</strong>ard deviation with 90%<br />
confidence.<br />
110 45 100 95 110<br />
110 100 110 95 120<br />
130 100 80 105 105<br />
90 110 70 125 108<br />
Source: The Doctor’s Pocket Calorie, Fat, <strong>and</strong> Carbohydrate<br />
Counter.<br />
10. A r<strong>and</strong>om sample of stock prices per share (in<br />
dollars) is shown. Find the 90% confidence interval<br />
for the variance <strong>and</strong> st<strong>and</strong>ard deviation for the prices.<br />
Assume the variable is normally distributed.<br />
26.69 13.88 28.37 12.00<br />
75.37 7.50 47.50 43.00<br />
3.81 53.81 13.62 45.12<br />
6.94 28.25 28.00 60.50<br />
40.25 10.87 46.12 14.75<br />
Source: Pittsburgh Tribune Review.<br />
11. A service station advertises that customers will have to<br />
wait no more than 30 minutes for an oil change. A sample<br />
of 28 oil changes has a st<strong>and</strong>ard deviation of 5.2 minutes.<br />
Find the 95% confidence interval of the population<br />
st<strong>and</strong>ard deviation of the time spent waiting for an oil<br />
change.<br />
12. Find the 95% confidence interval for the variance<br />
<strong>and</strong> st<strong>and</strong>ard deviation of the ounces of coffee that a<br />
machine dispenses in 12-ounce cups. Assume the variable<br />
is normally distributed. The data are given.<br />
12.03 12.10 12.02 11.98 12.00 12.05 11.97 11.99<br />
Find the 95% confidence interval for the population<br />
st<strong>and</strong>ard deviation of calculator batteries. A sample of 200<br />
calculator batteries has a st<strong>and</strong>ard deviation of 18 months.<br />
The TI-83 Plus does not have a built-in confidence interval for the variance or st<strong>and</strong>ard deviation.<br />
However, the downloadable program named SDINT is available on your CD <strong>and</strong> Online Learning<br />
Center. Follow the instructions with your CD for downloading the program.
lu49076_ch07.qxd 5/20/2003 3:16 PM Page 359<br />
7–6<br />
Summary<br />
Finding a <strong>Confidence</strong> Interval for the Variance <strong>and</strong> St<strong>and</strong>ard<br />
Deviation (Data)<br />
1. Enter the data values into L1. 2. Press PRGM, move the cursor to the program named SDINT, <strong>and</strong> press ENTER twice.<br />
3. Press 1 for Data.<br />
4. Type L1 for the list <strong>and</strong> press ENTER.<br />
5. Type the confidence level <strong>and</strong> press ENTER.<br />
6. Press ENTER to clear the screen.<br />
Example TI7–3<br />
This refers to Example 7–15 in the text. Find the 90% confidence interval for the variance<br />
<strong>and</strong> st<strong>and</strong>ard deviation for the data:<br />
59 54 53 52 51 39 49 46 49 48<br />
Finding a <strong>Confidence</strong> Interval for the Variance <strong>and</strong> St<strong>and</strong>ard<br />
Deviation (Statistics)<br />
1. Press PRGM, move the cursor to the program named SDINT, <strong>and</strong> press ENTER twice.<br />
2. Press 2 for Stats.<br />
3. Type the sample st<strong>and</strong>ard deviation <strong>and</strong> press ENTER.<br />
4. Type the sample size <strong>and</strong> press ENTER.<br />
5. Type the confidence level <strong>and</strong> press ENTER.<br />
6. Press ENTER to clear the screen.<br />
Example TI7–4<br />
Section 7–6 Summary 359<br />
This refers to Example 7–14 in the text. Find the 95% confidence interval for the variance <strong>and</strong><br />
st<strong>and</strong>ard deviation, given n � 20 <strong>and</strong> s � 1.6.<br />
An important aspect of inferential statistics is estimation. Estimations of parameters of<br />
populations are accomplished by selecting a r<strong>and</strong>om sample from that population <strong>and</strong><br />
choosing <strong>and</strong> computing a statistic that is the best estimator of the parameter. A good estimator<br />
must be unbiased, consistent, <strong>and</strong> relatively efficient. The best estimators of m<br />
<strong>and</strong> p are <strong>and</strong> , respectively. The best estimators of s2 <strong>and</strong> s are s2 X pˆ<br />
<strong>and</strong> s, respectively.<br />
7–35
lu49076_ch07.qxd 5/20/2003 3:16 PM Page 360<br />
360 Chapter 7 <strong>Confidence</strong> <strong>Intervals</strong> <strong>and</strong> <strong>Sample</strong> <strong>Size</strong><br />
Important Terms<br />
chi-square<br />
distribution 354<br />
confidence interval 328<br />
confidence level 328<br />
consistent estimator 327<br />
Important Formulas<br />
7–36<br />
There are two types of estimates of a parameter: point estimates <strong>and</strong> interval estimates.<br />
A point estimate is a specific value. For example, if a researcher wishes to estimate<br />
the average length of a certain adult fish, a sample of the fish is selected <strong>and</strong><br />
measured. The mean of this sample is computed, for example, 3.2 centimeters. From<br />
this sample mean, the researcher estimates the population mean to be 3.2 centimeters.<br />
The problem with point estimates is that the accuracy of the estimate cannot be determined.<br />
For this reason, statisticians prefer to use the interval estimate. By computing<br />
an interval about the sample value, statisticians can be 95% or 99% (or some other percentage)<br />
confident that their estimate contains the true parameter. The confidence level<br />
is determined by the researcher. The higher the confidence level, the wider the interval<br />
of the estimate must be. For example, a 95% confidence interval of the true mean length<br />
of a certain species of fish might be<br />
3.17 � m � 3.23<br />
whereas the 99% confidence interval might be<br />
3.15 � m � 3.25<br />
When the confidence interval of the mean is computed, the z or t values are used,<br />
depending on whether the population st<strong>and</strong>ard deviation is known <strong>and</strong> depending on the<br />
size of the sample. If s is known or n � 30, the z values can be used. If s is not known,<br />
the t values must be used when the sample size is less than 30 <strong>and</strong> the population is normally<br />
distributed.<br />
Closely related to computing confidence intervals is the determination of the sample<br />
size to make an estimate of the mean. This information is needed to determine the<br />
minimum sample size necessary.<br />
1. The degree of confidence must be stated.<br />
2. The population st<strong>and</strong>ard deviation must be known or be able to be estimated.<br />
3. The maximum error of estimate must be stated.<br />
<strong>Confidence</strong> intervals <strong>and</strong> sample sizes can also be computed for proportions, using<br />
the normal distribution; <strong>and</strong> confidence intervals for variances <strong>and</strong> st<strong>and</strong>ard deviations<br />
can be computed, using the chi-square distribution.<br />
degrees of freedom 340<br />
estimation 326<br />
estimator 327<br />
interval estimate 328<br />
Formula for the confidence interval of the mean when s is<br />
known (when n � 30, s can be used if s is unknown):<br />
X � z A�2� S<br />
�n� � M � X � z A�2� S<br />
�n�<br />
maximum error of<br />
estimate 329<br />
point estimate 327<br />
proportion 346<br />
Formula for the sample size for means:<br />
n � � z A�2 � S<br />
E � 2<br />
where E is the maximum error.<br />
relatively efficient<br />
estimator 327<br />
t distribution 340<br />
unbiased estimator 327
lu49076_ch07.qxd 5/20/2003 3:16 PM Page 361<br />
Formula for the confidence interval of the mean when s is<br />
unknown <strong>and</strong> n � 30:<br />
X � t A�2� s<br />
�n� � M � X � t A�2� s<br />
�n�<br />
Formula for the confidence interval for a proportion:<br />
pˆ � zA�2� pˆqˆ<br />
n � p � pˆ � zA�2� pˆqˆ<br />
n<br />
where pˆ � X�n <strong>and</strong> qˆ � 1 � pˆ .<br />
Review Exercises<br />
1. A study of 36 members of the Central Park Walkers<br />
showed that they could walk at an average rate of 2.6 miles<br />
per hour. The sample st<strong>and</strong>ard deviation is 0.4. Find the<br />
95% confidence interval for the mean for all walkers.<br />
2. In a survey of 1004 individuals, 442 felt that President<br />
George W. Bush spent too much time away from<br />
Washington. Find a 95% confidence interval for the true<br />
population proportion.<br />
Source: USA TODAY/CNN/Gallup Poll.<br />
3. AU.S. Travel Data Center survey reported that<br />
Americans stayed an average of 7.5 nights when they went<br />
on vacation. The sample size was 1500. Find the 95%<br />
confidence interval of the true mean. Assume the st<strong>and</strong>ard<br />
deviation was 0.8 night.<br />
Source: USA TODAY.<br />
4. A sample of 12 funeral homes in Toledo, Ohio,<br />
found these costs for cremation (in dollars).<br />
1320 1052 1090 1285 1570 995 1150<br />
1585 820 1195 1160 590<br />
Find the 95% confidence interval for the population mean.<br />
Source: Toledo Blade.<br />
5. For a certain urban area, in a sample of 5 months, an<br />
average of 28 mail carriers were bitten by dogs each month.<br />
The st<strong>and</strong>ard deviation of the sample was 3. Find the 90%<br />
confidence interval of the true mean number of mail<br />
carriers who are bitten by dogs each month. Assume the<br />
variable is normally distributed.<br />
6. A researcher is interested in estimating the average<br />
salary of teachers in a large urban school district. She wants<br />
to be 95% confident that her estimate is correct. If the<br />
st<strong>and</strong>ard deviation is $1050, how large a sample is needed<br />
to be accurate within $200?<br />
7. A researcher wishes to estimate, within $25, the true<br />
average amount of postage a community college spends<br />
Section 7–6 Summary 361<br />
Formula for the sample size for proportions:<br />
n � pˆqˆ � z A�2<br />
E � 2<br />
Formula for the confidence interval for a variance:<br />
�n � 1�s2 X 2 � S<br />
right<br />
2 �n � 1�s2<br />
�<br />
X 2 left<br />
Formula for confidence interval for a st<strong>and</strong>ard deviation:<br />
� �n<br />
� 1�s2 X 2 �n � 1�s<br />
� S �<br />
right � 2<br />
X 2 left<br />
each year. If she wishes to be 90% confident, how large a<br />
sample is necessary? The st<strong>and</strong>ard deviation is known to be<br />
$80.<br />
8. A U.S. Travel Data Center’s survey of 1500 adults<br />
found that 42% of respondents stated that they favor<br />
historical sites as vacations. Find the 95% confidence<br />
interval of the true proportion of all adults who favor<br />
visiting historical sites as vacations.<br />
Source: USA TODAY.<br />
9. In a study of 200 accidents that required treatment in<br />
an emergency room, 40% occurred at home. Find the 90%<br />
confidence interval of the true proportion of accidents that<br />
occur at home.<br />
10. In a recent study of 100 people, 85 said that they were<br />
dissatisfied with their local elected officials. Find the 90%<br />
confidence interval of the true proportion of individuals<br />
who are dissatisfied with their local elected officials.<br />
11. The federal report in the previous exercise also stated<br />
that 88% of children under age 18 were covered by health<br />
insurance in 2000. How large a sample is needed to<br />
estimate the true proportion of covered children with 90%<br />
confidence with a confidence interval 0.05 wide?<br />
Source: Washington Observer-Reporter.<br />
12. Asurvey by Brides magazine found that 8 out of 10<br />
brides are planning to take the surname of their new<br />
husb<strong>and</strong>. How large a sample is needed to estimate the true<br />
proportion within 3% with 98% confidence?<br />
Source: Time magazine.<br />
13. The st<strong>and</strong>ard deviation of the diameter of 28 oranges<br />
was 0.34 inch. Find the 99% confidence interval of the true<br />
st<strong>and</strong>ard deviation of the diameters of the oranges.<br />
14. A r<strong>and</strong>om sample of 22 lawn mowers was selected,<br />
<strong>and</strong> the motors were tested to see how many miles per<br />
gallon of gasoline each one obtained. The variance of the<br />
7–37
lu49076_ch07.qxd 5/20/2003 3:16 PM Page 362<br />
362 Chapter 7 <strong>Confidence</strong> <strong>Intervals</strong> <strong>and</strong> <strong>Sample</strong> <strong>Size</strong><br />
measurements was 2.6. Find the 95% confidence interval of<br />
the true variance.<br />
15. A r<strong>and</strong>om sample of 15 snowmobiles was selected, <strong>and</strong><br />
the lifetime (in months) of the batteries was measured. The<br />
variance of the sample was 8.6. Find the 90% confidence<br />
interval of the true variance.<br />
7–38<br />
Statistics Today<br />
Data Analysis<br />
Would You Change the Channel?—Revisited<br />
16. The heights of 28 police officers from a large-city<br />
police force were measured. The st<strong>and</strong>ard deviation of the<br />
sample was 1.83 inches. Find the 95% confidence interval<br />
of the st<strong>and</strong>ard deviation of the heights of the officers.<br />
The estimates given in the survey are point estimates. However, since the margin of error<br />
is stated to be 3 percentage points, an interval estimate can easily be obtained. For<br />
example, if 45% of the people changed the channel, then the confidence interval of the<br />
true percentages of people who changed channels would be 42% � p � 48%. The article<br />
fails to state whether a 90%, 95%, or some other percentage was used for the confidence<br />
interval.<br />
Using the formula given in Section 7–4, a minimum sample size of 1068 would be<br />
needed to obtain a 95% confidence interval for p, as shown. Use pˆ <strong>and</strong> qˆ as 0.5, since no<br />
value is known for pˆ .<br />
n � pˆqˆ � z ��2<br />
E � 2<br />
� (0.5)(0.5) � � 1067.1<br />
� 1068<br />
1.96<br />
0.03� 2<br />
The Data Bank is found in Appendix D, or on the<br />
World Wide Web by following links from<br />
www.mhhe.com/math/stat/bluman/.<br />
1. From the Data Bank choose a variable, find the mean,<br />
<strong>and</strong> construct the 95% <strong>and</strong> 99% confidence intervals of the<br />
population mean. Use a sample of at least 30 subjects. Find<br />
the mean of the population, <strong>and</strong> determine whether it falls<br />
within the confidence interval.<br />
2. Repeat Exercise 1, using a different variable <strong>and</strong> a<br />
sample of 15.<br />
3. Repeat Exercise 1, using a proportion. For example,<br />
construct a confidence interval for the proportion of<br />
individuals who did not complete high school.<br />
4. From Data Set III in Appendix D, select a sample of 30<br />
values <strong>and</strong> construct the 95% <strong>and</strong> 99% confidence intervals<br />
of the mean length in miles of major North American<br />
rivers. Find the mean of all the values, <strong>and</strong> determine if the<br />
confidence intervals contain the mean.<br />
5. From Data Set VI in Appendix D, select a sample of 20<br />
values <strong>and</strong> find the 90% confidence interval of the mean of<br />
the number of acres. Find the mean of all the values, <strong>and</strong><br />
determine if the confidence interval contains the mean.<br />
6. From Data Set XIV in Appendix D, select a sample of<br />
20 weights for the Pittsburgh Steelers, <strong>and</strong> find the<br />
proportion of players who weigh over 250 pounds.<br />
Construct a 95% confidence interval for this proportion.<br />
Find the proportion of all Steelers who weigh more than 250<br />
pounds. Does the confidence interval contain this value?
lu49076_ch07.qxd 5/20/2003 3:16 PM Page 363<br />
Chapter Quiz<br />
Determine whether each statement is true or false. If the<br />
statement is false, explain why.<br />
1. Interval estimates are preferred over point estimates<br />
since a confidence level can be specified.<br />
2. For a specific confidence interval, the larger the sample<br />
size, the smaller the maximum error of estimate will be.<br />
3. An estimator is consistent if, as the sample size<br />
decreases, the value of the estimator approaches the value<br />
of the parameter estimated.<br />
4. To determine the sample size needed to estimate a<br />
parameter, one must know the maximum error of estimate.<br />
Select the best answer.<br />
5. When a 99% confidence interval is calculated instead<br />
of a 95% confidence interval with n being the same, the<br />
maximum error of estimate will be<br />
a. Smaller<br />
b. Larger<br />
c. The same<br />
d. It cannot be determined<br />
6. The best point estimate of the population mean is<br />
a. The sample mean<br />
b. The sample median<br />
c. The sample mode<br />
d. The sample midrange<br />
7. When the population st<strong>and</strong>ard deviation is unknown<br />
<strong>and</strong> sample size is less than 30, what table value should be<br />
used in computing a confidence interval for a mean?<br />
a. z<br />
b. t<br />
c. Chi-square<br />
d. None of the above<br />
Complete the following statements with the best answer.<br />
8. A good estimator should be _______, _______, <strong>and</strong><br />
_______.<br />
9. The maximum difference between the point estimate of<br />
a parameter <strong>and</strong> the actual value of the parameter is called<br />
_______.<br />
10. The statement “The average height of an adult male is<br />
5 feet 10 inches” is an example of a(n) _______ estimate.<br />
11. The three confidence intervals used most often are the<br />
_______%, _______%, <strong>and</strong> _______%.<br />
12. A r<strong>and</strong>om sample of 49 shoppers showed that they<br />
spend an average of $23.45 per visit at the Saturday<br />
Mornings Bookstore. The st<strong>and</strong>ard deviation of the sample<br />
Section 7–6 Summary 363<br />
was $2.80. Find the 90% confidence interval of the true<br />
mean.<br />
13. An irate patient complained that the cost of a doctor’s<br />
visit was too high. She r<strong>and</strong>omly surveyed 20 other patients<br />
<strong>and</strong> found that the mean amount of money they spent on<br />
each doctor’s visit was $44.80. The st<strong>and</strong>ard deviation of<br />
the sample was $3.53. Find the 95% confidence interval of<br />
the population mean. Assume the variable is normally<br />
distributed.<br />
14. The average weight of 40 r<strong>and</strong>omly selected school<br />
buses was 4150 pounds. The st<strong>and</strong>ard deviation was 480<br />
pounds. Find the 99% confidence interval of the true mean<br />
weight of the buses.<br />
15. In a study of 10 insurance sales representatives from a<br />
certain large city, the average age of the group was 48.6<br />
years <strong>and</strong> the st<strong>and</strong>ard deviation was 4.1 years. Find the<br />
95% confidence interval of the population mean age of all<br />
insurance sales representatives in that city.<br />
16. In a hospital, a sample of 8 weeks was selected, <strong>and</strong> it<br />
was found that an average of 438 patients were treated in<br />
the emergency room each week. The st<strong>and</strong>ard deviation<br />
was 16. Find the 99% confidence interval of the true mean.<br />
Assume the variable is normally distributed.<br />
17. For a certain urban area, it was found that in a sample<br />
of 4 months, an average of 31 burglaries occurred each<br />
month. The st<strong>and</strong>ard deviation was 4. Find the 90%<br />
confidence interval of the true mean number of burglaries<br />
each month.<br />
18. A university dean wishes to estimate the average<br />
number of hours that freshmen study each week. The<br />
st<strong>and</strong>ard deviation from a previous study is 2.6 hours. How<br />
large a sample must be selected if he wants to be 99%<br />
confident of finding whether the true mean differs from the<br />
sample mean by 0.5 hour?<br />
19. A researcher wishes to estimate within $300 the true<br />
average amount of money a county spends on road repairs<br />
each year. If she wants to be 90% confident, how large a<br />
sample is necessary? The st<strong>and</strong>ard deviation is known to be<br />
$900.<br />
20. A recent study of 75 workers found that 53 people rode<br />
the bus to work each day. Find the 95% confidence interval<br />
of the proportion of all workers who rode the bus to work.<br />
21. In a study of 150 accidents that required treatment in an<br />
emergency room, 36% involved children under 6 years of<br />
age. Find the 90% confidence interval of the true proportion<br />
of accidents that involve children under the age of 6.<br />
7–39
lu49076_ch07.qxd 5/20/2003 3:16 PM Page 364<br />
364 Chapter 7 <strong>Confidence</strong> <strong>Intervals</strong> <strong>and</strong> <strong>Sample</strong> <strong>Size</strong><br />
22. A survey of 90 families showed that 40 owned at<br />
least one television set. Find the 95% confidence interval<br />
of the true proportion of families who own at least one<br />
television set.<br />
23. A nutritionist wishes to determine, within 3%, the true<br />
proportion of adults who do not eat any lunch. If he wishes<br />
to be 95% confident that his estimate contains the<br />
population proportion, how large a sample will be<br />
necessary? A previous study found that 15% of the 125<br />
people surveyed said they did not eat lunch.<br />
24. A sample of 25 novels has a st<strong>and</strong>ard deviation of 9<br />
pages. Find the 95% confidence interval of the population<br />
st<strong>and</strong>ard deviation.<br />
Critical Thinking Challenges<br />
A confidence interval for a median can be found by using<br />
the formulas<br />
n � 1<br />
U � (round up)<br />
2<br />
L � n � U � 1<br />
to define positions in the set of ordered data values.<br />
Suppose a data set has 30 values, <strong>and</strong> one wants to find the<br />
95% confidence interval for the median. Substituting in the<br />
formulas, one gets<br />
� z��2�n 2<br />
WWW<br />
7–40<br />
Data Projects<br />
Use MINITAB, the TI-83 Plus, or a computer program of<br />
your choice to complete these exercises.<br />
1. Select several variables, such as the number of points a<br />
football team scored in each game of a specific season, the<br />
number of passes completed, or the number of yards<br />
gained. Using confidence intervals for the mean, determine<br />
the 90%, 95%, <strong>and</strong> 99% confidence intervals. (Use z or t,<br />
whichever is relevant.) Decide which you think is more<br />
appropriate. When this is completed, write a summary of<br />
your findings by answering the following questions.<br />
a. What was the purpose of the study?<br />
b. What was the population?<br />
c. How was the sample selected?<br />
d. What were the results obtained by using confidence<br />
intervals?<br />
e. Did you use z or t? Why?<br />
25. Find the 90% confidence interval for the variance <strong>and</strong><br />
st<strong>and</strong>ard deviation for the time it takes a state police<br />
inspector to check a truck for safety if a sample of 27 trucks<br />
has a st<strong>and</strong>ard deviation of 6.8 minutes. Assume the<br />
variable is normally distributed.<br />
26. A sample of 20 automobiles has a pollution by-product<br />
release st<strong>and</strong>ard deviation of 2.3 ounces when 1 gallon of<br />
gasoline is used. Find the 90% confidence interval of the<br />
population st<strong>and</strong>ard deviation.<br />
30 � 1 1.96�30<br />
U � � � 21 (rounded up)<br />
2 2<br />
L � 30 � 21 � 1 � 10<br />
when n � 30 <strong>and</strong> za/2 � 1.96.<br />
Arrange the data in order from smallest to largest, <strong>and</strong><br />
then select the 10th <strong>and</strong> 21st values of the data array;<br />
hence, X10 � med � X21. Find the 90% confidence interval for the median for the<br />
data in Exercise 12 in Section 7–2.<br />
2. Using the same data or different data, construct a<br />
confidence interval for a proportion. For example, you<br />
might want to find the proportion of passes completed<br />
by the quarterback or the proportion of passes that were<br />
intercepted. Write a short paragraph summarizing the<br />
results.<br />
You may use the following websites to obtain raw data:<br />
http://www.mhhe.com/math/stat/bluman/<br />
http://lib.stat.cmu.edu/DASL<br />
http://www.statcan.ca/english/