Confidence Intervals and Sample Size
Confidence Intervals and Sample Size
Confidence Intervals and Sample Size

You also want an ePaper? Increase the reach of your titles
YUMPU automatically turns print PDFs into web optimized ePapers that Google loves.
lu49076_ch07.qxd 5/20/2003 3:16 PM Page 340<br />
340 Chapter 7 <strong>Confidence</strong> <strong>Intervals</strong> <strong>and</strong> <strong>Sample</strong> <strong>Size</strong><br />
7–3<br />
<strong>Confidence</strong> <strong>Intervals</strong> for<br />
the Mean (S Unknown<br />
<strong>and</strong> n < 30)<br />
Objective 3. Find the<br />
confidence interval for the<br />
mean when � is unknown <strong>and</strong><br />
n � 30.<br />
Historical Notes<br />
The t distribution was<br />
formulated in 1908 by an<br />
Irish brewing employee<br />
named W. S. Gosset.<br />
Gosset was involved in<br />
researching new methods<br />
of manufacturing ale.<br />
Because brewing<br />
employees were not<br />
allowed to publish results,<br />
Gosset published his<br />
finding using the<br />
pseudonym Student;<br />
hence, the t distribution is<br />
sometimes called<br />
Student’s t distribution.<br />
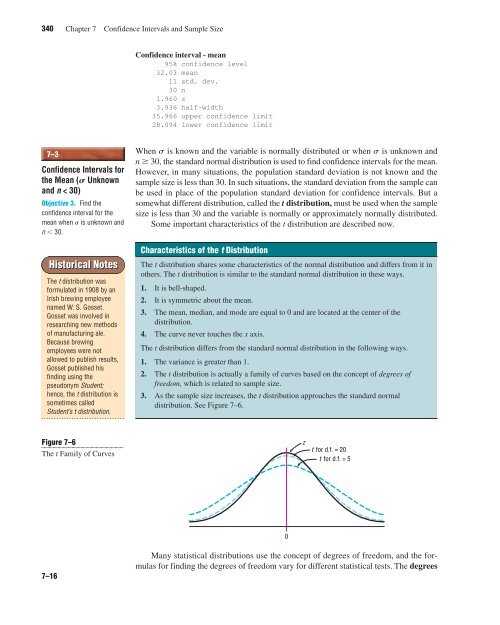
Figure 7–6<br />
The t Family of Curves<br />
7–16<br />
<strong>Confidence</strong> interval - mean<br />
95% confidence level<br />
32.03 mean<br />
11 std. dev.<br />
30 n<br />
1.960 z<br />
3.936 half-width<br />
35.966 upper confidence limit<br />
28.094 lower confidence limit<br />
When s is known <strong>and</strong> the variable is normally distributed or when s is unknown <strong>and</strong><br />
n � 30, the st<strong>and</strong>ard normal distribution is used to find confidence intervals for the mean.<br />
However, in many situations, the population st<strong>and</strong>ard deviation is not known <strong>and</strong> the<br />
sample size is less than 30. In such situations, the st<strong>and</strong>ard deviation from the sample can<br />
be used in place of the population st<strong>and</strong>ard deviation for confidence intervals. But a<br />
somewhat different distribution, called the t distribution, must be used when the sample<br />
size is less than 30 <strong>and</strong> the variable is normally or approximately normally distributed.<br />
Some important characteristics of the t distribution are described now.<br />
Characteristics of the t Distribution<br />
The t distribution shares some characteristics of the normal distribution <strong>and</strong> differs from it in<br />
others. The t distribution is similar to the st<strong>and</strong>ard normal distribution in these ways.<br />
1. It is bell-shaped.<br />
2. It is symmetric about the mean.<br />
3. The mean, median, <strong>and</strong> mode are equal to 0 <strong>and</strong> are located at the center of the<br />
distribution.<br />
4. The curve never touches the x axis.<br />
The t distribution differs from the st<strong>and</strong>ard normal distribution in the following ways.<br />
1. The variance is greater than 1.<br />
2. The t distribution is actually a family of curves based on the concept of degrees of<br />
freedom, which is related to sample size.<br />
3. As the sample size increases, the t distribution approaches the st<strong>and</strong>ard normal<br />
distribution. See Figure 7–6.<br />
0<br />
Many statistical distributions use the concept of degrees of freedom, <strong>and</strong> the formulas<br />
for finding the degrees of freedom vary for different statistical tests. The degrees<br />
z<br />
t for d.f. = 20<br />
t for d.f. = 5