Confidence Intervals and Sample Size
Confidence Intervals and Sample Size
Confidence Intervals and Sample Size

Create successful ePaper yourself
Turn your PDF publications into a flip-book with our unique Google optimized e-Paper software.
lu49076_ch07.qxd 5/20/2003 3:16 PM Page 349<br />
<strong>Sample</strong> <strong>Size</strong> for<br />
Proportions<br />
Objective 5. Determine the<br />
minimum sample size for<br />
finding a confidence interval<br />
for a proportion.<br />
Example 7–11<br />
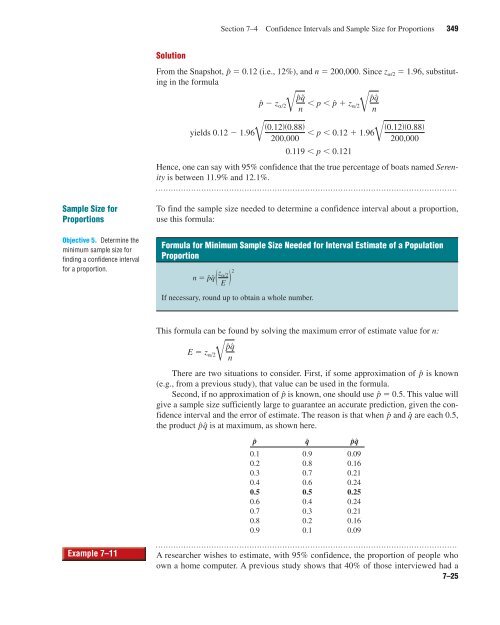
Solution<br />
From the Snapshot, pˆ � 0.12 (i.e., 12%), <strong>and</strong> n � 200,000. Since za/2 � 1.96, substituting<br />
in the formula<br />
�0.12��0.88�<br />
yields 0.12 � 1.96� 200,000 � p � 0.12 � 1.96� �0.12��0.88�<br />
200,000<br />
0.119 � p � 0.121<br />
Hence, one can say with 95% confidence that the true percentage of boats named Serenity<br />
is between 11.9% <strong>and</strong> 12.1%.<br />
To find the sample size needed to determine a confidence interval about a proportion,<br />
use this formula:<br />
Formula for Minimum <strong>Sample</strong> <strong>Size</strong> Needed for Interval Estimate of a Population<br />
Proportion<br />
n � pˆqˆ � z ��2<br />
E � 2<br />
If necessary, round up to obtain a whole number.<br />
This formula can be found by solving the maximum error of estimate value for n:<br />
E � z ��2� pˆqˆ<br />
n<br />
Section 7–4 <strong>Confidence</strong> <strong>Intervals</strong> <strong>and</strong> <strong>Sample</strong> <strong>Size</strong> for Proportions 349<br />
pˆ � z��2� pˆqˆ<br />
n � p � pˆ � z��2� pˆqˆ<br />
n<br />
There are two situations to consider. First, if some approximation of pˆ is known<br />
(e.g., from a previous study), that value can be used in the formula.<br />
Second, if no approximation of pˆ is known, one should use pˆ � 0.5. This value will<br />
give a sample size sufficiently large to guarantee an accurate prediction, given the confidence<br />
interval <strong>and</strong> the error of estimate. The reason is that when pˆ <strong>and</strong> qˆ are each 0.5,<br />
the product pˆ qˆ is at maximum, as shown here.<br />
pˆ<br />
qˆ<br />
pˆ qˆ<br />
0.1 0.9 0.09<br />
0.2 0.8 0.16<br />
0.3 0.7 0.21<br />
0.4 0.6 0.24<br />
0.5 0.5 0.25<br />
0.6 0.4 0.24<br />
0.7 0.3 0.21<br />
0.8 0.2 0.16<br />
0.9 0.1 0.09<br />
A researcher wishes to estimate, with 95% confidence, the proportion of people who<br />
own a home computer. A previous study shows that 40% of those interviewed had a<br />
7–25