Confidence Intervals and Sample Size
Confidence Intervals and Sample Size
Confidence Intervals and Sample Size

You also want an ePaper? Increase the reach of your titles
YUMPU automatically turns print PDFs into web optimized ePapers that Google loves.
lu49076_ch07.qxd 5/20/2003 3:16 PM Page 354<br />
354 Chapter 7 <strong>Confidence</strong> <strong>Intervals</strong> <strong>and</strong> <strong>Sample</strong> <strong>Size</strong><br />
7–5<br />
<strong>Confidence</strong> <strong>Intervals</strong><br />
for Variances <strong>and</strong><br />
St<strong>and</strong>ard Deviations<br />
Objective 6. Find a<br />
confidence interval for a<br />
variance <strong>and</strong> a st<strong>and</strong>ard<br />
deviation.<br />
7–30<br />
Historical Note<br />
The � 2 distribution with 2<br />
degrees of freedom was<br />
formulated by a<br />
mathematician named<br />
Hershel in 1869 while he<br />
was studying the accuracy<br />
of shooting arrows at a<br />
target. Many other<br />
mathematicians have<br />
since contributed to its<br />
development.<br />
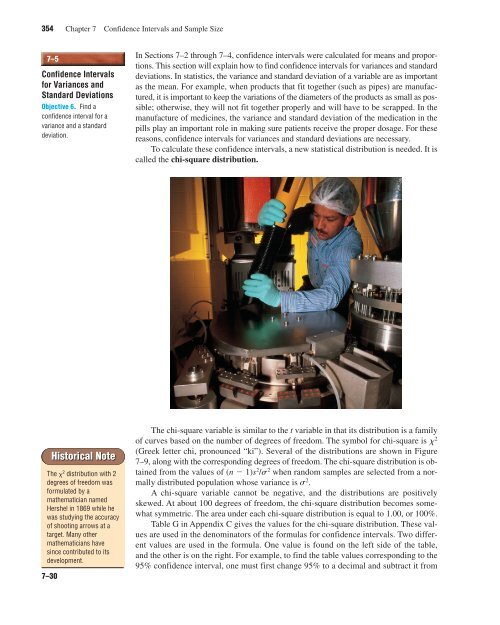
In Sections 7–2 through 7–4, confidence intervals were calculated for means <strong>and</strong> proportions.<br />
This section will explain how to find confidence intervals for variances <strong>and</strong> st<strong>and</strong>ard<br />
deviations. In statistics, the variance <strong>and</strong> st<strong>and</strong>ard deviation of a variable are as important<br />
as the mean. For example, when products that fit together (such as pipes) are manufactured,<br />
it is important to keep the variations of the diameters of the products as small as possible;<br />
otherwise, they will not fit together properly <strong>and</strong> will have to be scrapped. In the<br />
manufacture of medicines, the variance <strong>and</strong> st<strong>and</strong>ard deviation of the medication in the<br />
pills play an important role in making sure patients receive the proper dosage. For these<br />
reasons, confidence intervals for variances <strong>and</strong> st<strong>and</strong>ard deviations are necessary.<br />
To calculate these confidence intervals, a new statistical distribution is needed. It is<br />
called the chi-square distribution.<br />
The chi-square variable is similar to the t variable in that its distribution is a family<br />
of curves based on the number of degrees of freedom. The symbol for chi-square is x 2<br />
(Greek letter chi, pronounced “ki”). Several of the distributions are shown in Figure<br />
7–9, along with the corresponding degrees of freedom. The chi-square distribution is obtained<br />
from the values of (n � 1)s 2 /s 2 when r<strong>and</strong>om samples are selected from a normally<br />
distributed population whose variance is s 2 .<br />
A chi-square variable cannot be negative, <strong>and</strong> the distributions are positively<br />
skewed. At about 100 degrees of freedom, the chi-square distribution becomes somewhat<br />
symmetric. The area under each chi-square distribution is equal to 1.00, or 100%.<br />
Table G in Appendix C gives the values for the chi-square distribution. These values<br />
are used in the denominators of the formulas for confidence intervals. Two different<br />
values are used in the formula. One value is found on the left side of the table,<br />
<strong>and</strong> the other is on the right. For example, to find the table values corresponding to the<br />
95% confidence interval, one must first change 95% to a decimal <strong>and</strong> subtract it from