Confidence Intervals and Sample Size
Confidence Intervals and Sample Size
Confidence Intervals and Sample Size

You also want an ePaper? Increase the reach of your titles
YUMPU automatically turns print PDFs into web optimized ePapers that Google loves.
lu49076_ch07.qxd 5/20/2003 3:16 PM Page 338<br />
338 Chapter 7 <strong>Confidence</strong> <strong>Intervals</strong> <strong>and</strong> <strong>Sample</strong> <strong>Size</strong><br />
TI-83 Plus<br />
Step by Step<br />
7–14<br />
a) Select Calc>Column statistics.<br />
b) Click the option for St<strong>and</strong>ard deviation.<br />
c) Enter C1 Assets for the Input variable <strong>and</strong> s for Store in:.<br />
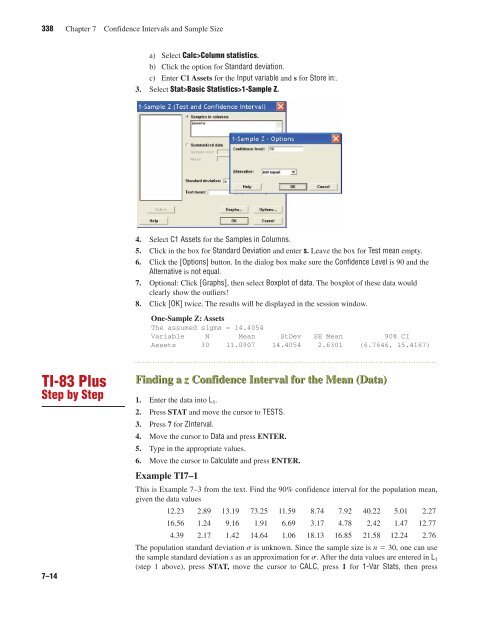
3. Select Stat>Basic Statistics>1-<strong>Sample</strong> Z.<br />
4. Select C1 Assets for the <strong>Sample</strong>s in Columns.<br />
5. Click in the box for St<strong>and</strong>ard Deviation <strong>and</strong> enter s. Leave the box for Test mean empty.<br />
6. Click the [Options] button. In the dialog box make sure the <strong>Confidence</strong> Level is 90 <strong>and</strong> the<br />
Alternative is not equal.<br />
7. Optional: Click [Graphs], then select Boxplot of data. The boxplot of these data would<br />
clearly show the outliers!<br />
8. Click [OK] twice. The results will be displayed in the session window.<br />
One-<strong>Sample</strong> Z: Assets<br />
The assumed sigma = 14.4054<br />
Variable N Mean StDev SE Mean 90% CI<br />
Assets 30 11.0907 14.4054 2.6301 (6.7646, 15.4167)<br />
Finding a z <strong>Confidence</strong> Interval for the Mean (Data)<br />
1. Enter the data into L1. 2. Press STAT <strong>and</strong> move the cursor to TESTS.<br />
3. Press 7 for ZInterval.<br />
4. Move the cursor to Data <strong>and</strong> press ENTER.<br />
5. Type in the appropriate values.<br />
6. Move the cursor to Calculate <strong>and</strong> press ENTER.<br />
Example TI7–1<br />
This is Example 7–3 from the text. Find the 90% confidence interval for the population mean,<br />
given the data values<br />
12.23 2.89 13.19 73.25 11.59 8.74 7.92 40.22 5.01 2.27<br />
16.56 1.24 9.16 1.91 6.69 3.17 4.78 2.42 1.47 12.77<br />
4.39 2.17 1.42 14.64 1.06 18.13 16.85 21.58 12.24 2.76<br />
The population st<strong>and</strong>ard deviation s is unknown. Since the sample size is n � 30, one can use<br />
the sample st<strong>and</strong>ard deviation s as an approximation for s. After the data values are entered in L1 (step 1 above), press STAT, move the cursor to CALC, press 1 for 1-Var Stats, then press