Confidence Intervals and Sample Size
Confidence Intervals and Sample Size
Confidence Intervals and Sample Size

You also want an ePaper? Increase the reach of your titles
YUMPU automatically turns print PDFs into web optimized ePapers that Google loves.
lu49076_ch07.qxd 5/20/2003 3:16 PM Page 359<br />
7–6<br />
Summary<br />
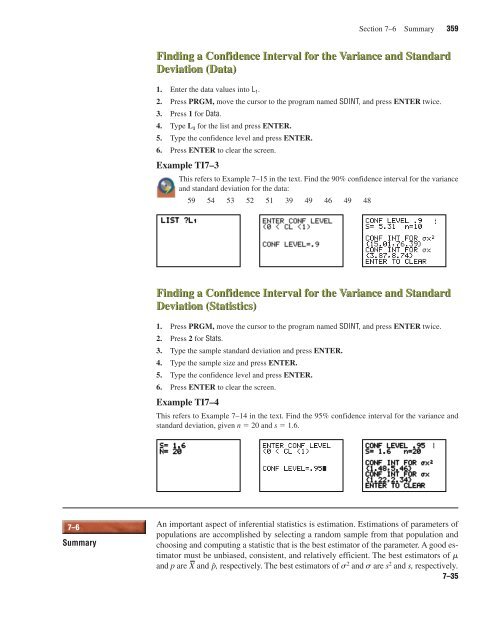
Finding a <strong>Confidence</strong> Interval for the Variance <strong>and</strong> St<strong>and</strong>ard<br />
Deviation (Data)<br />
1. Enter the data values into L1. 2. Press PRGM, move the cursor to the program named SDINT, <strong>and</strong> press ENTER twice.<br />
3. Press 1 for Data.<br />
4. Type L1 for the list <strong>and</strong> press ENTER.<br />
5. Type the confidence level <strong>and</strong> press ENTER.<br />
6. Press ENTER to clear the screen.<br />
Example TI7–3<br />
This refers to Example 7–15 in the text. Find the 90% confidence interval for the variance<br />
<strong>and</strong> st<strong>and</strong>ard deviation for the data:<br />
59 54 53 52 51 39 49 46 49 48<br />
Finding a <strong>Confidence</strong> Interval for the Variance <strong>and</strong> St<strong>and</strong>ard<br />
Deviation (Statistics)<br />
1. Press PRGM, move the cursor to the program named SDINT, <strong>and</strong> press ENTER twice.<br />
2. Press 2 for Stats.<br />
3. Type the sample st<strong>and</strong>ard deviation <strong>and</strong> press ENTER.<br />
4. Type the sample size <strong>and</strong> press ENTER.<br />
5. Type the confidence level <strong>and</strong> press ENTER.<br />
6. Press ENTER to clear the screen.<br />
Example TI7–4<br />
Section 7–6 Summary 359<br />
This refers to Example 7–14 in the text. Find the 95% confidence interval for the variance <strong>and</strong><br />
st<strong>and</strong>ard deviation, given n � 20 <strong>and</strong> s � 1.6.<br />
An important aspect of inferential statistics is estimation. Estimations of parameters of<br />
populations are accomplished by selecting a r<strong>and</strong>om sample from that population <strong>and</strong><br />
choosing <strong>and</strong> computing a statistic that is the best estimator of the parameter. A good estimator<br />
must be unbiased, consistent, <strong>and</strong> relatively efficient. The best estimators of m<br />
<strong>and</strong> p are <strong>and</strong> , respectively. The best estimators of s2 <strong>and</strong> s are s2 X pˆ<br />
<strong>and</strong> s, respectively.<br />
7–35